
Abstract
Aims: Osteoporosis is underdiagnosed because of the lack of a convenient diagnostic method. Circulating microRNAs (miRNAs) emerge as novel biomarkers for disease diagnosis. Here, we conducted a case-control study that included a total of 448 serum samples collected from 182 healthy participants, 132 osteopenia participants, and 134 osteoporosis patients. Methods: Circulating miRNAs dysregulated during osteoporosis were screened and analyzed in three randomly determined sub-cohorts: the discovery cohort identified 22 candidate miRNAs; the training cohort tested the candidate miRNAs and constructed Index 1, comprising five miRNAs by logistic regression, and Index 2, comprising four miRNAs, was developed by linear combination. Results: Both indices were tested in the validation cohort and showed statistically significant results in distinguishing osteoporosis patients from healthy and osteopenic patients. Moreover, Index 1 also showed improved performance over traditional bone turnover biomarkers type I pro-collagen (tPINP) and type I collagen (β-CTx). Conclusion: In conclusion, circulating miRNAs are potential biomarkers for osteoporosis. The diagnostic panel of circulating miRNAs could be a complementary method for dual-energy X-ray absorptiometry (DXA) in mass screening and routine examination to enhance the osteoporosis detection rate.
Introduction
Osteoporosis, characterized by low bone mass and decreased bone quality, is the most common degenerative bone disease in the aged population.1–3 Low bone mineral density (BMD) after osteoporosis is an essential risk of fracture. As reported, osteoporosis was associated with a fracture rate four times that of normal BMD, and osteopenia was associated with a 1.8-fold higher rate. 4 The World Health Organization (WHO) recommends patients with osteoporosis (T score ⩽−2.5) to receive pharmacotherapy. 5 But, due to the gap in diagnosis and a lack of awareness by doctors, osteoporosis is still undertreated.6–9
Since osteoporosis is usually clinically asymptomatic, dual-energy X-ray absorptiometry (DXA) is the gold standard for BMD analysis. 5 Despite the availability of DXA for over a decade, its application is limited by its high expense and immobility. According to reports, less than 30% of women and 4% of men at least 65 years old have had a DXA examination. Moreover, a certain percentage of osteoporosis is first diagnosed after a fracture has occurred.2,10,11 A reliable DXA measurement of central bone must be conducted by specifically trained technologists on professional instruments, which is not conducive to the popularity of this method. Therefore, new noninvasive diagnostic techniques are urgently needed in large-scale screening and routine examination.
Noninvasive biomarkers in serum are potential candidates for osteoporosis diagnosis and fracture prediction. A good marker for osteoporosis needs to be naturally stable, closely relevant to BMD, highly sensitive, and specific to bone remodeling, and with the potential to predict fracture risk. Several subtypes of biochemical bone turnover markers (BTMs) have been applied to evaluate the rate of bone remodeling, but their sensitivity and specificity are strongly affected by age, gender, body weight, and follow-up time. 12 Besides, the association between BTMs and BMD is not strong, which leads to a large dispersion of individual marker concentration indicating subsequent bone loss as well as fracture risk.
Emerging evidence has revealed that circulating microRNAs (miRNAs), a population of miRNAs presenting in the plasma, 13 are potential biomarkers for early diagnosis of disease. In physiological conditions, circulating miRNA signatures are usually steady and persistent. But their expression pattern can be altered systematically in the disease state. 14 The diagnostic potential of circulating miRNAs has been confirmed in a number of diseases, including cancer,15–17 diabetes,18,19 cardiovascular diseases, 20 pulmonary embolism, 21 and liver pathologies. 22 Notably, recent findings uncovered that some circulating miRNAs are dysregulated in primary, secondary, and idiopathic osteoporosis, suggesting a correlation between the signature of circulating miRNAs and osteoporosis. Moreover, emerging studies have explored the potential of circulating miRNAs as biomarkers of osteoporosis diagnosis and osteoporotic fracture prediction.23–30 However, most of these studies were limited by the small sample size and lack of independent validation. Whether circulating miRNAs could be used as biomarkers in populations of different age and gender is still unclear.
Therefore, in this study, we conducted a large-scale case-control study to explore the circulating miRNA signature in patients with osteoporosis, and validate its efficacy in osteoporosis diagnosis.
Methods
Study design overview and participant cohort assignment
The project was approved by the ethical review committee of the Third Affiliated Hospital of Fourth Military Medical University (Ethical Approval Number: IRB-REV-2013-023) and conducted according to the Declaration of Helsinki. All participants were well informed and signed an informed consent form.
The details of the study design are shown in Figure 1. A total of 455 participants from rural and urban areas of Northwest China were recruited from the health examination center of the Affiliated Hospital of Fourth Military Medical University from 1 December 2013 to 28 February 2016. Participants who received routine health examinations were recruited randomly into this study after obtaining their consent. Eventually, 448 participants were included after excluding five participants with hemolysis and two participants with hyperlipemia. All participants were classified into three participant groups by lumbar BMD results: healthy participants (T score ⩾−1.0), osteopenia participants (−2.5 < T score < −1.0), and osteoporosis patients (T scores ⩽−2.5) according to WHO diagnostic criteria. 5 All examinations were performed by professional medical technologists, and the participants were recruited by experienced medical doctors according to the inclusion and exclusion criteria in Supplemental Tables S1 and S2. Circulating miRNAs dysregulated during osteoporosis were screened and analyzed in three randomly determined sub-cohorts. The discovery cohort contained serum samples from randomly selected 10 healthy, 10 osteopenia, and 5 osteoporosis participants of each sub-group included from 1 December 2013, to 28 February 2014 (Supplemental Table S4). Serum samples from participants included from 1 December 2013 to 31 December 2014, along with the samples in the discovery cohort, were allocated to the training cohort. The validation cohort included serum samples from participants included from 1 January 2015, to 28 February 2016. The distribution and clinicopathological information of participants in each sub-group were presented in Supplemental Table S3.

Study design.
For the discovery cohort, miRNA screening was performed on the 25 serum samples. Candidate circulating miRNAs as potential biomarkers were selected following one of the following criteria: (1) the serum levels of the miRNA in osteopenia participants were increased by ⩾50% compared with those in healthy participants, and the serum levels of the miRNA in osteoporosis patients were increased by ⩾50% compared with those in osteopenia participants; (2) the serum levels of the miRNA in osteopenia participants were decreased by ⩾33.3% compared with those in healthy participants, and the serum levels of the miRNA in osteoporosis patients were decreased by ⩾33.3% compared with those in osteopenia participants. In the training cohort, the candidate miRNAs were detected by quantitative real-time RT-PCR, and significant ones were selected to establish two diagnostic indices for osteoporosis. For the validation cohort, the diagnostic panels were tested in 160 independent samples. The estimated sample size of each cohort is shown in Supplemental Table S5.
Anthropometric parameter measurement and DXA test
A certified densitometry technician with 4-years experience executed all anthropometric parameter measurements and the DXA test. Body mass index (BMI) was calculated according to the formula: BMI = body weight (kg)/[height (m)] 2 . The BMD of the first to the fourth lumbar vertebra (L1–L4) was measured using a DXA scanner of the Hologic Discovery Wi system (software V13.3.0) with an array mode (60 s, 1 mm collimator). T scores were calculated based on the Asia reference data.
Whole blood collection and serum preparation
Fasting blood samples were collected in the morning (8:00 a.m. to 12:00 noon). The whole blood (5 ml) was collected by nurse practitioners via ulnar vein puncture and imported into the sterile vacuous dry tube without any anticoagulation agents. The whole blood samples were kept at room temperature for 30 min and then centrifuged (3000 rpm) at 4°C for 15 min. The upper liquid was transferred to an RNA-free tube and centrifugation was repeated to remove residual blood cell and cell debris. Isolated serum was examined by spectrophotometer at 414 nm wavelength to identify and eliminate hemolytic serum, and then stored at −80°C before detection.
MiRNA isolation, microarray, and quantitative RT-PCR
Samples were divided into three subgroups in three cohorts (discovery: 10 healthy controls, 10 osteopenia, 5 osteoporosis; training: 126 healthy controls, 76 osteopenia, 86 osteoporosis; validation: 56 healthy controls, 56 osteopenia, 48 osteoporosis). The frozen serum samples were melted on ice and were then homogenated by a vortex. Total RNA was isolated from 200 μl serum by using a TRI Reagent® BD (750 μl) with Polyacryl Carrier (Molecular Research Center, Cincinnati, OH, USA) according to the manufacturer’s protocol. All instruments directly contacting with the serum were treated with DEPC water to eliminate RNase. For quality control, UniSP2 spike-in control (Qiagen, Hilden, Germany) was introduced to determine the efficiency of RNA isolation according to the instruction.
For miRNA microarray, the samples within each participant group were pooled together and detected using a Human miRNA microarray chip 19.0 (Agilent Technologies, Santa Clara, CA, USA). The microarray chip was scanned by an Agilent Microarray Scanner [resolution 5 μm, photomultiplier tube (PMT) 100%, 5%] and analyzed with Feature Extraction software 10.7 (Agilent Technologies). Raw data were normalized by using Gene Spring software 11.0 (Agilent Technologies). A total of 533 of 2006 covered miRNAs were detected above background compared with the average + 2× standard deviation (SD) from negative control spots. Microarray data can be accessed in the database of the National Center for Biotechnology Information (NCBI; accession number GSE91033).
For quantitative RT-PCR, miRNAs were reverse-transcribed into cDNA by using a Mir-X miRNA First-Strand Synthesis Kit (Clontech, Mountain View, CA, USA) following the manufacturer’s protocol [20 μl reaction system: (2× miRNA Reaction Buffer Mix (10 μl) + miRNA RT Enzyme Mix (2 μl) + 0.1% BSA (2 μl) + total RNA (500 ng) + DEPC water (up to 20 μl); reaction condition: Step 1: 37°C 60 min, Step 2: 85°C 5 s]. Realtime RT-PCR analysis of miRNAs was performed using an SYBR Premix Ex Taq II kit (Tli RNaseH Plus) (Takara, Kyoto, Japan) with a CFX-96 Real-time RT-PCR system (Bio-Rad, Feldkirchen, Germany) [20 μl reaction system: SYBR Premix Ex Taq II (Tli RNaseH Plus) 10 μl) + forward primer (0.8 μl) + reverse primer (0.8 μl)+ cDNA (2.0 μl)+ sterile distilled water (6.4 μl); reaction condition: Step 1: 95°C 30 s, Step 2: PCR reaction; GO TO: 39 (40 cycles), 95°C 5 s, 60°C 30 s, Step 3: Melt Curve]. Each sample was tested for three technical duplicates, and no template control (NTC) resulted in no Ct value. Because there is no consensus on the housekeeping miRNA for RT-PCR assay of circulating miRNA, we tried using U6, 23 miR-16, 31 miR-1228, 15 and spike-in lyophilized Caenorhabditis elegans miRNA mimic as an internal reference according to previous reports. 17 However, in our system, U6 was barely detected, and the expressions of miR-16 and miR-1228 were unstable among the samples (Supplemental Table S15). Therefore, lyophilized C. elegans miR-39 miRNA mimic (5.6 × 10⁸ copies/200 μl, Qiagen) was used as a spike-in reference. The levels of miRNAs were normalized to the levels of C. elegans miR-39 miRNA mimic using the 2–Δct method. The primer sequences are displayed in Supplemental Table S18. For quality control, UniSP3 and UniSP6 spike-in controls (Qiagen) were introduced to determine the efficiency of cDNA synthesis according to the manufacturer’s recommendations.
Diagnostic indices development
The candidate miRNAs isolated from the discovery cohort were verified in the training cohort. Among them, 10 miRNAs were highly expressed in serum, and differed significantly within the three participants groups. The contribution of the 10 miRNAs to the logistic regression formula was assessed respectively using multiple logistic regression analysis. MiRNAs with a p value >0.01 were excluded because of their non-significant contribution to the formula, while the rest were included for index 1 development (Index1 = β0 + β1*miR-A + β2*miR-B + β3*miR-C + β4*miR-D + β5*miR-E +. . .+ βn*miR-N), where β0 is a constant and β1−βn are estimated coefficients of the logistic regression model. This index was fitted from raw data and corresponded to the upper limit in terms of the training cohort.
Index 2 was developed according to a linear combination of 4 miRNAs (Index2 = miR-A + miR-B – miR-C – miR-D), where two miRNAs were significantly up-regulated and the other two were down-regulated. This index was designed to amplify the contrast between cases and controls, and simultaneously remove the influence from technical bias. There were three up-regulated candidate miRNAs; thus, the coefficient of variation (CV) analysis was used to remove the inappropriate one. The miRNA with the highest CV would be excluded from Index 2 because of its lower stability compared with the other two up-regulated miRNAs.
The cutoff point, the area under the receiver operating characteristic (ROC) curve (AUC), p value, designed sensitivity, specificity, accuracy, true positive, true negative, false positive, and false negative were applied to evaluate the performance of miRNAs and Indexes.
BTM measurement
Total PINP and β-CTX levels in serum were analyzed with commercial electrochemiluminescence immunoassay kits (Roche, South San Francisco, CA, USA) and a Cobase e601 machine (Roche). A certified clinical laboratory technician with 5-years experience executed all BTM measurements following standard protocol.
Statistical analysis
For microarray analysis, the raw data were normalized by the Quantile algorithm. The Kruskal–Wallis test was used for pairwise comparisons among three groups. Step-wise multiple logistic regression analysis was used to examine the factors and interaction effects, and to develop the miRNA diagnostic Index1. A simple linear model was used to develop the miRNA diagnostic Index 2. The ROC curve was plotted and the AUC was used to display the diagnostic performance of individual marker and index. The diagnostic performance was considered by defining a cutoff value to fix the sensitivity to 80.0%. The (2 × 2) and (3 × 2) Pearson’s chi-squared tests were used to compare sample information distribution. Covariance analysis was used to exclude the disturbance of age, height, weight, and BMI variations in subgroups. Spearman’s rank correlation analysis was used to investigate the correlation between BMD and miRNAs. All data were calculated in SPSS 13.0 (SPSS, Chicago, IL, USA), PASS 11.0 (NCSS Statistical Software, Kaysville, UT, USA) and Medcalc 16.0 (Medcalc, Seoul, Republic of Korea); p value <0.05 (two sides) was considered to be statistically significant.
Results
Identification of dysregulated circulating miRNAs during osteoporosis
Serum samples collected from 448 participants were involved in this study (Figure 1). Gender, height, weight, and BMI were well-matched in healthy participants, osteopenia participants, and osteoporosis patients in both the training cohort and validation cohort (Supplemental Table S3). Since aging is a major pathogenic factor of osteoporosis, the age distribution differed among the three participants groups (Supplemental Table S3).
In the discovery cohort, miRNA microarray revealed 22 candidate miRNAs, where the expression of 13 miRNAs gradually increased, while the expression of 9 miRNAs gradually decreased as the T-score changes from healthy participants to osteopenia participants to osteoporosis patients (Supplemental Figure S1, Supplemental Table S6). In the training cohort, the 22 candidate miRNAs were verified in 288 samples. Among them, 10 miRNAs (miR-30c-2-3p, miR-199a-5p, miR-424-5p, miR-497-5p, miR-550a-5p, miR-654-5p, miR-663a, miR-877-3p, miR-1260b, miR-1299) were highly expressed in serum and differed significantly among the three participants groups (Supplemental Figure S2, Table 1).
Fold change of 22 candidate miRNAs among the healthy, osteopenic and osteoporotic population in the training cohort.

Notes: αcorrection = 0.0125 (corrected by Bonferroni correction). *p < 0.0125: significant difference between healthy controls and osteoporosis; #p < 0.0125: significant difference between healthy controls and osteopenia.
miRNA, microRNA.
The performance of diagnostic miRNA panels in the training and validation cohort
Based on the results from the training cohort, two models were employed to construct miRNA panels that could distinguish osteoporosis patients from the non-osteoporosis population. Index 1 was developed by the logistic regression model. Five miRNAs (miR-550a-5p, miR-654-5p, miR-663a, miR-1260b, miR-1299) were excluded from the 10 candidate miRNAs because of their non-significant contribution to the formula (Supplemental Table S8). The remaining five miRNAs were finally included in Index 1 (Supplemental Table S16, S17), which is presented as −0.394 + (0.105 × miR-30c-2-3p) + (−1.022 × miR-199a-5p) + (−0.078 × miR-424-5p) + (−0.046 × miR-497-5p) + (0.089 × miR-877-3p). Index 2 is a simple linear model sharing four same miRNAs with Index 1, while miR-497-5p was excluded because of its lower stability in CV analysis (Supplemental Table S9). Index 2 is presented as (miR-30c-2-3p+miR-877-3p)-(miR-199a-5p+miR-424-5p), where two miRNAs are significantly up-regulated and two miRNAs are significantly down-regulated.
To distinguish osteoporosis patients from healthy participants, the AUC was 0.86 (95% CI, 0.81–0.91) for Index 1 and 0.77 (95% CI, 0.70–0.83) for Index 2. To distinguish osteoporosis patients from osteopenia participants, the AUC was 0.80 (95% CI, 0.72–0.87) for Index 1 and 0.69 (95% CI, 0.60–0.77) for Index 2. To distinguish osteopenia participants from healthy participants, the AUC was 0.58 (95% CI, 0.50–0.66) for Index 1 and 0.59 (95% CI, 0.51–0.67) for Index 2 (Figure 2A, B, G–I, Table 2) in the training cohort.
The performance of individual miRNA, Index1 and Index2 in the training cohort.
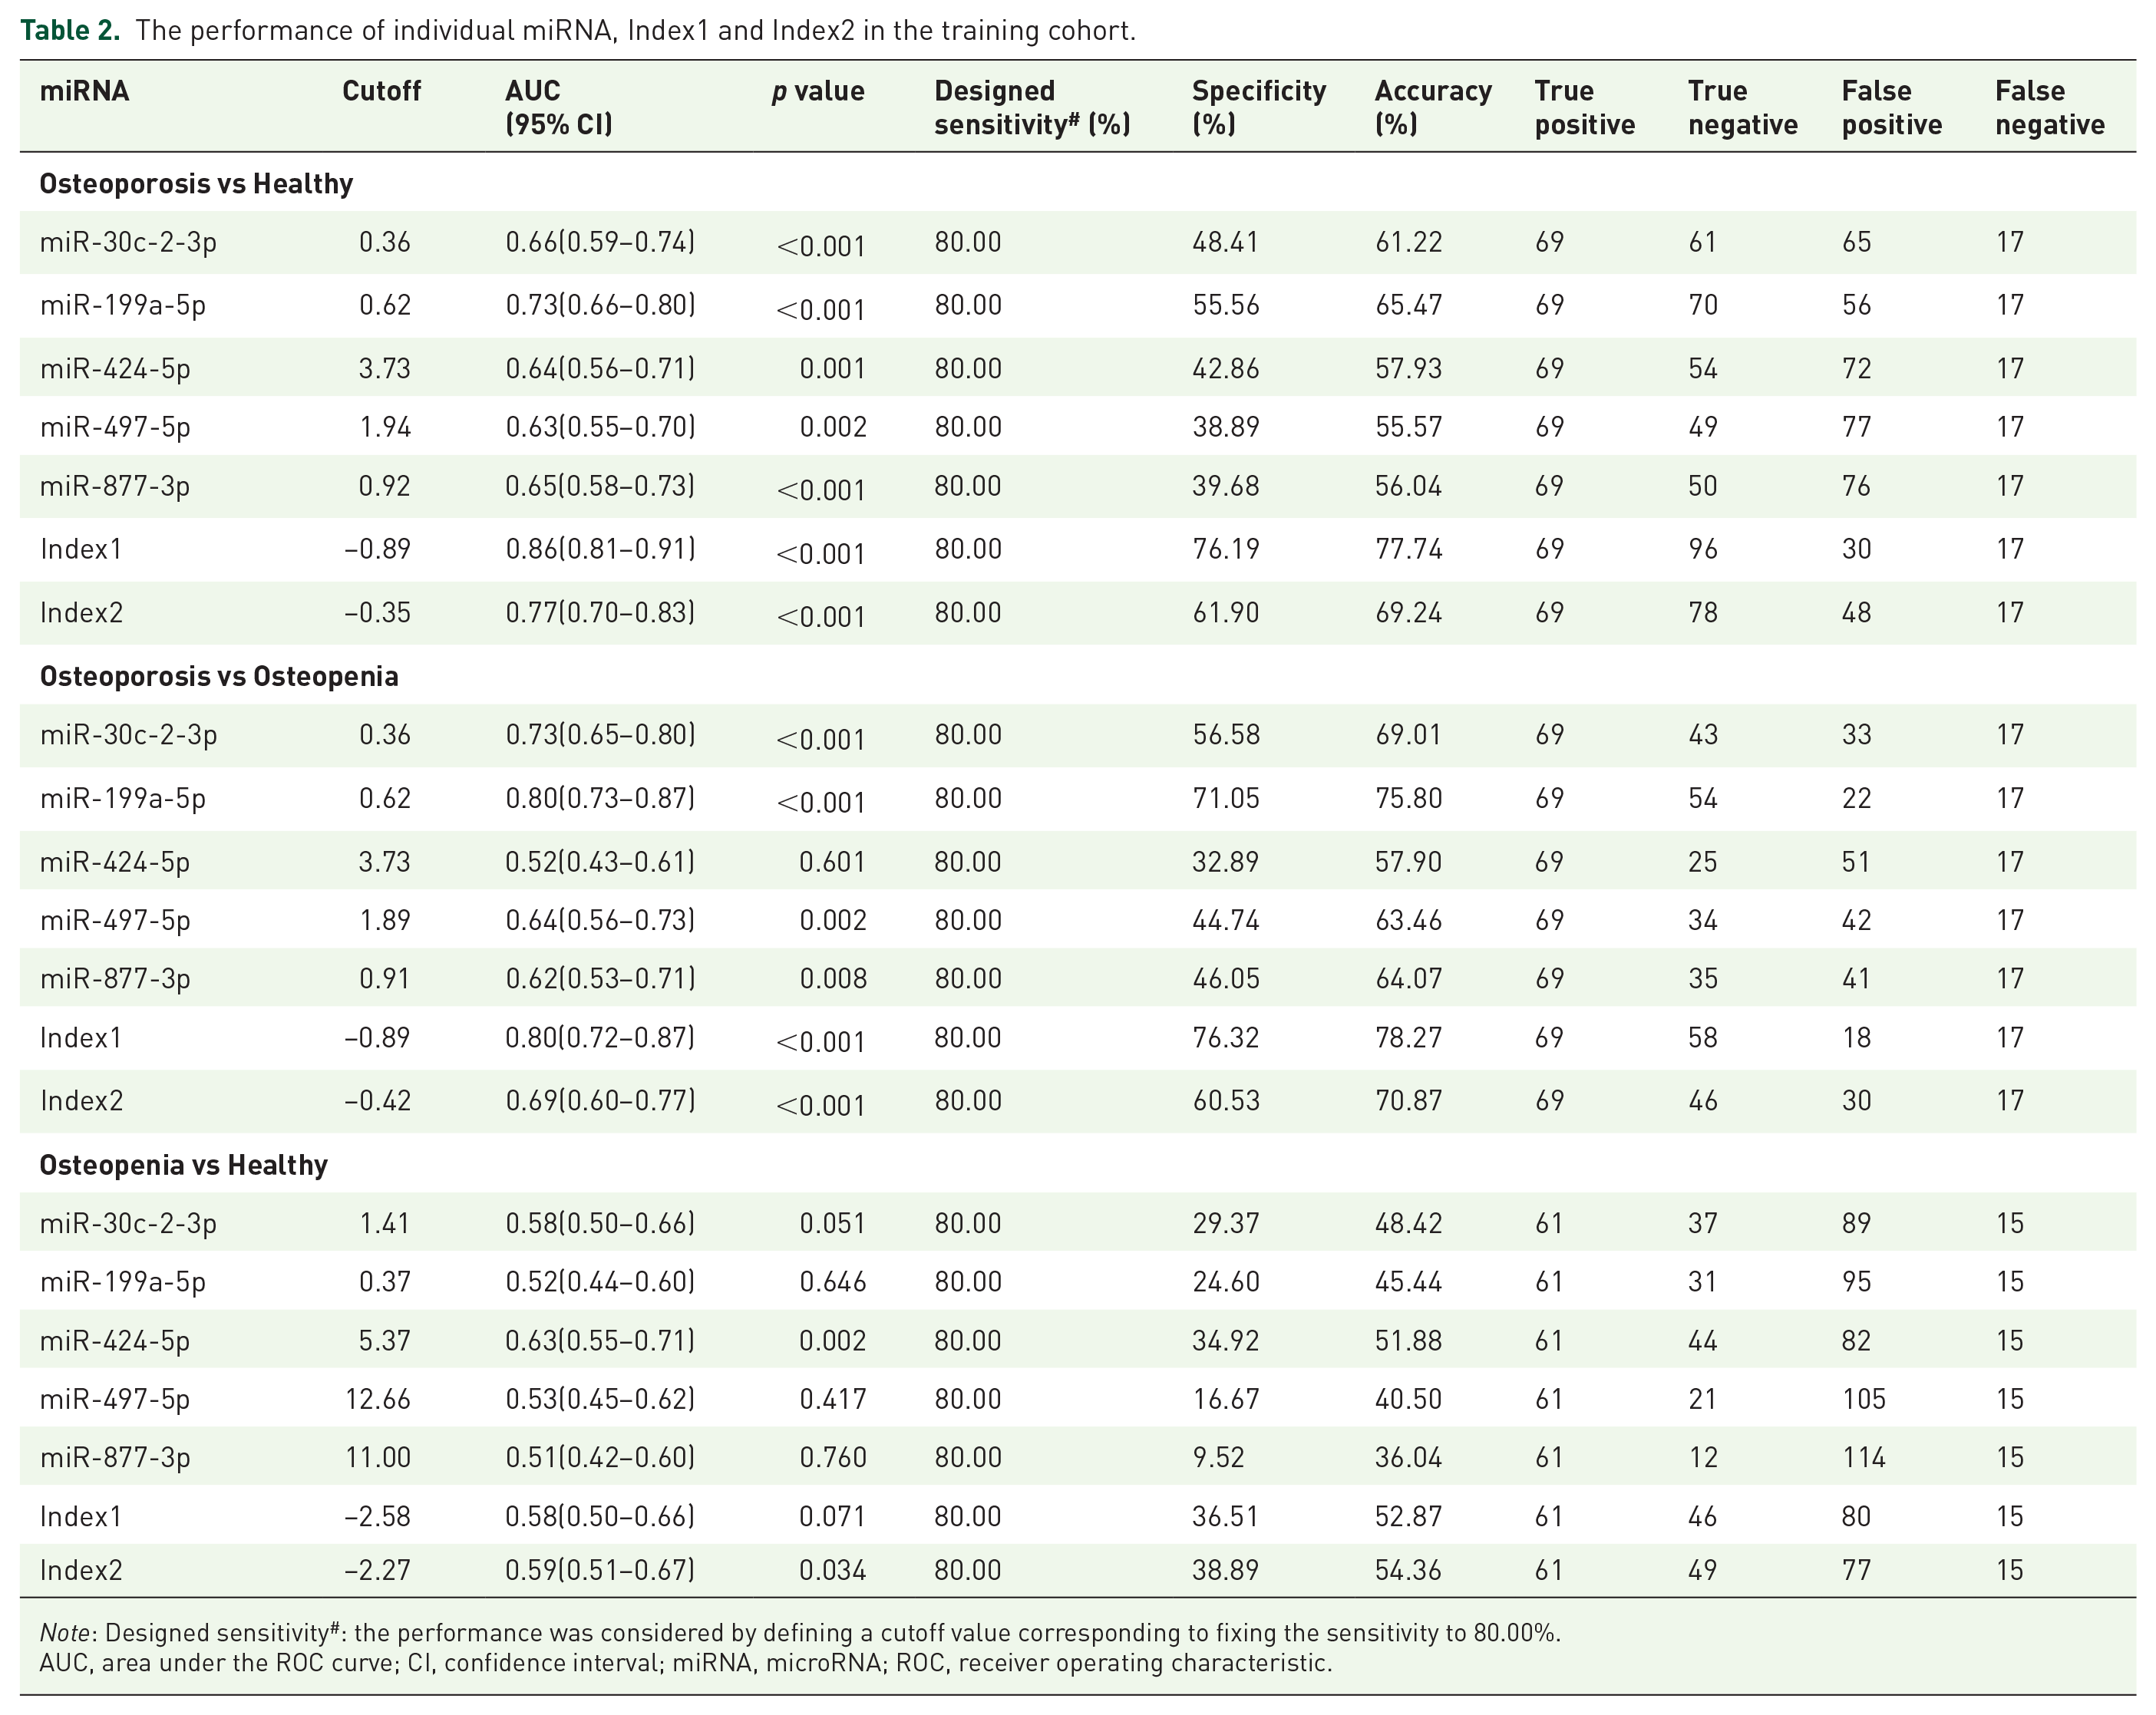
Note: Designed sensitivity#: the performance was considered by defining a cutoff value corresponding to fixing the sensitivity to 80.00%.
AUC, area under the ROC curve; CI, confidence interval; miRNA, microRNA; ROC, receiver operating characteristic.
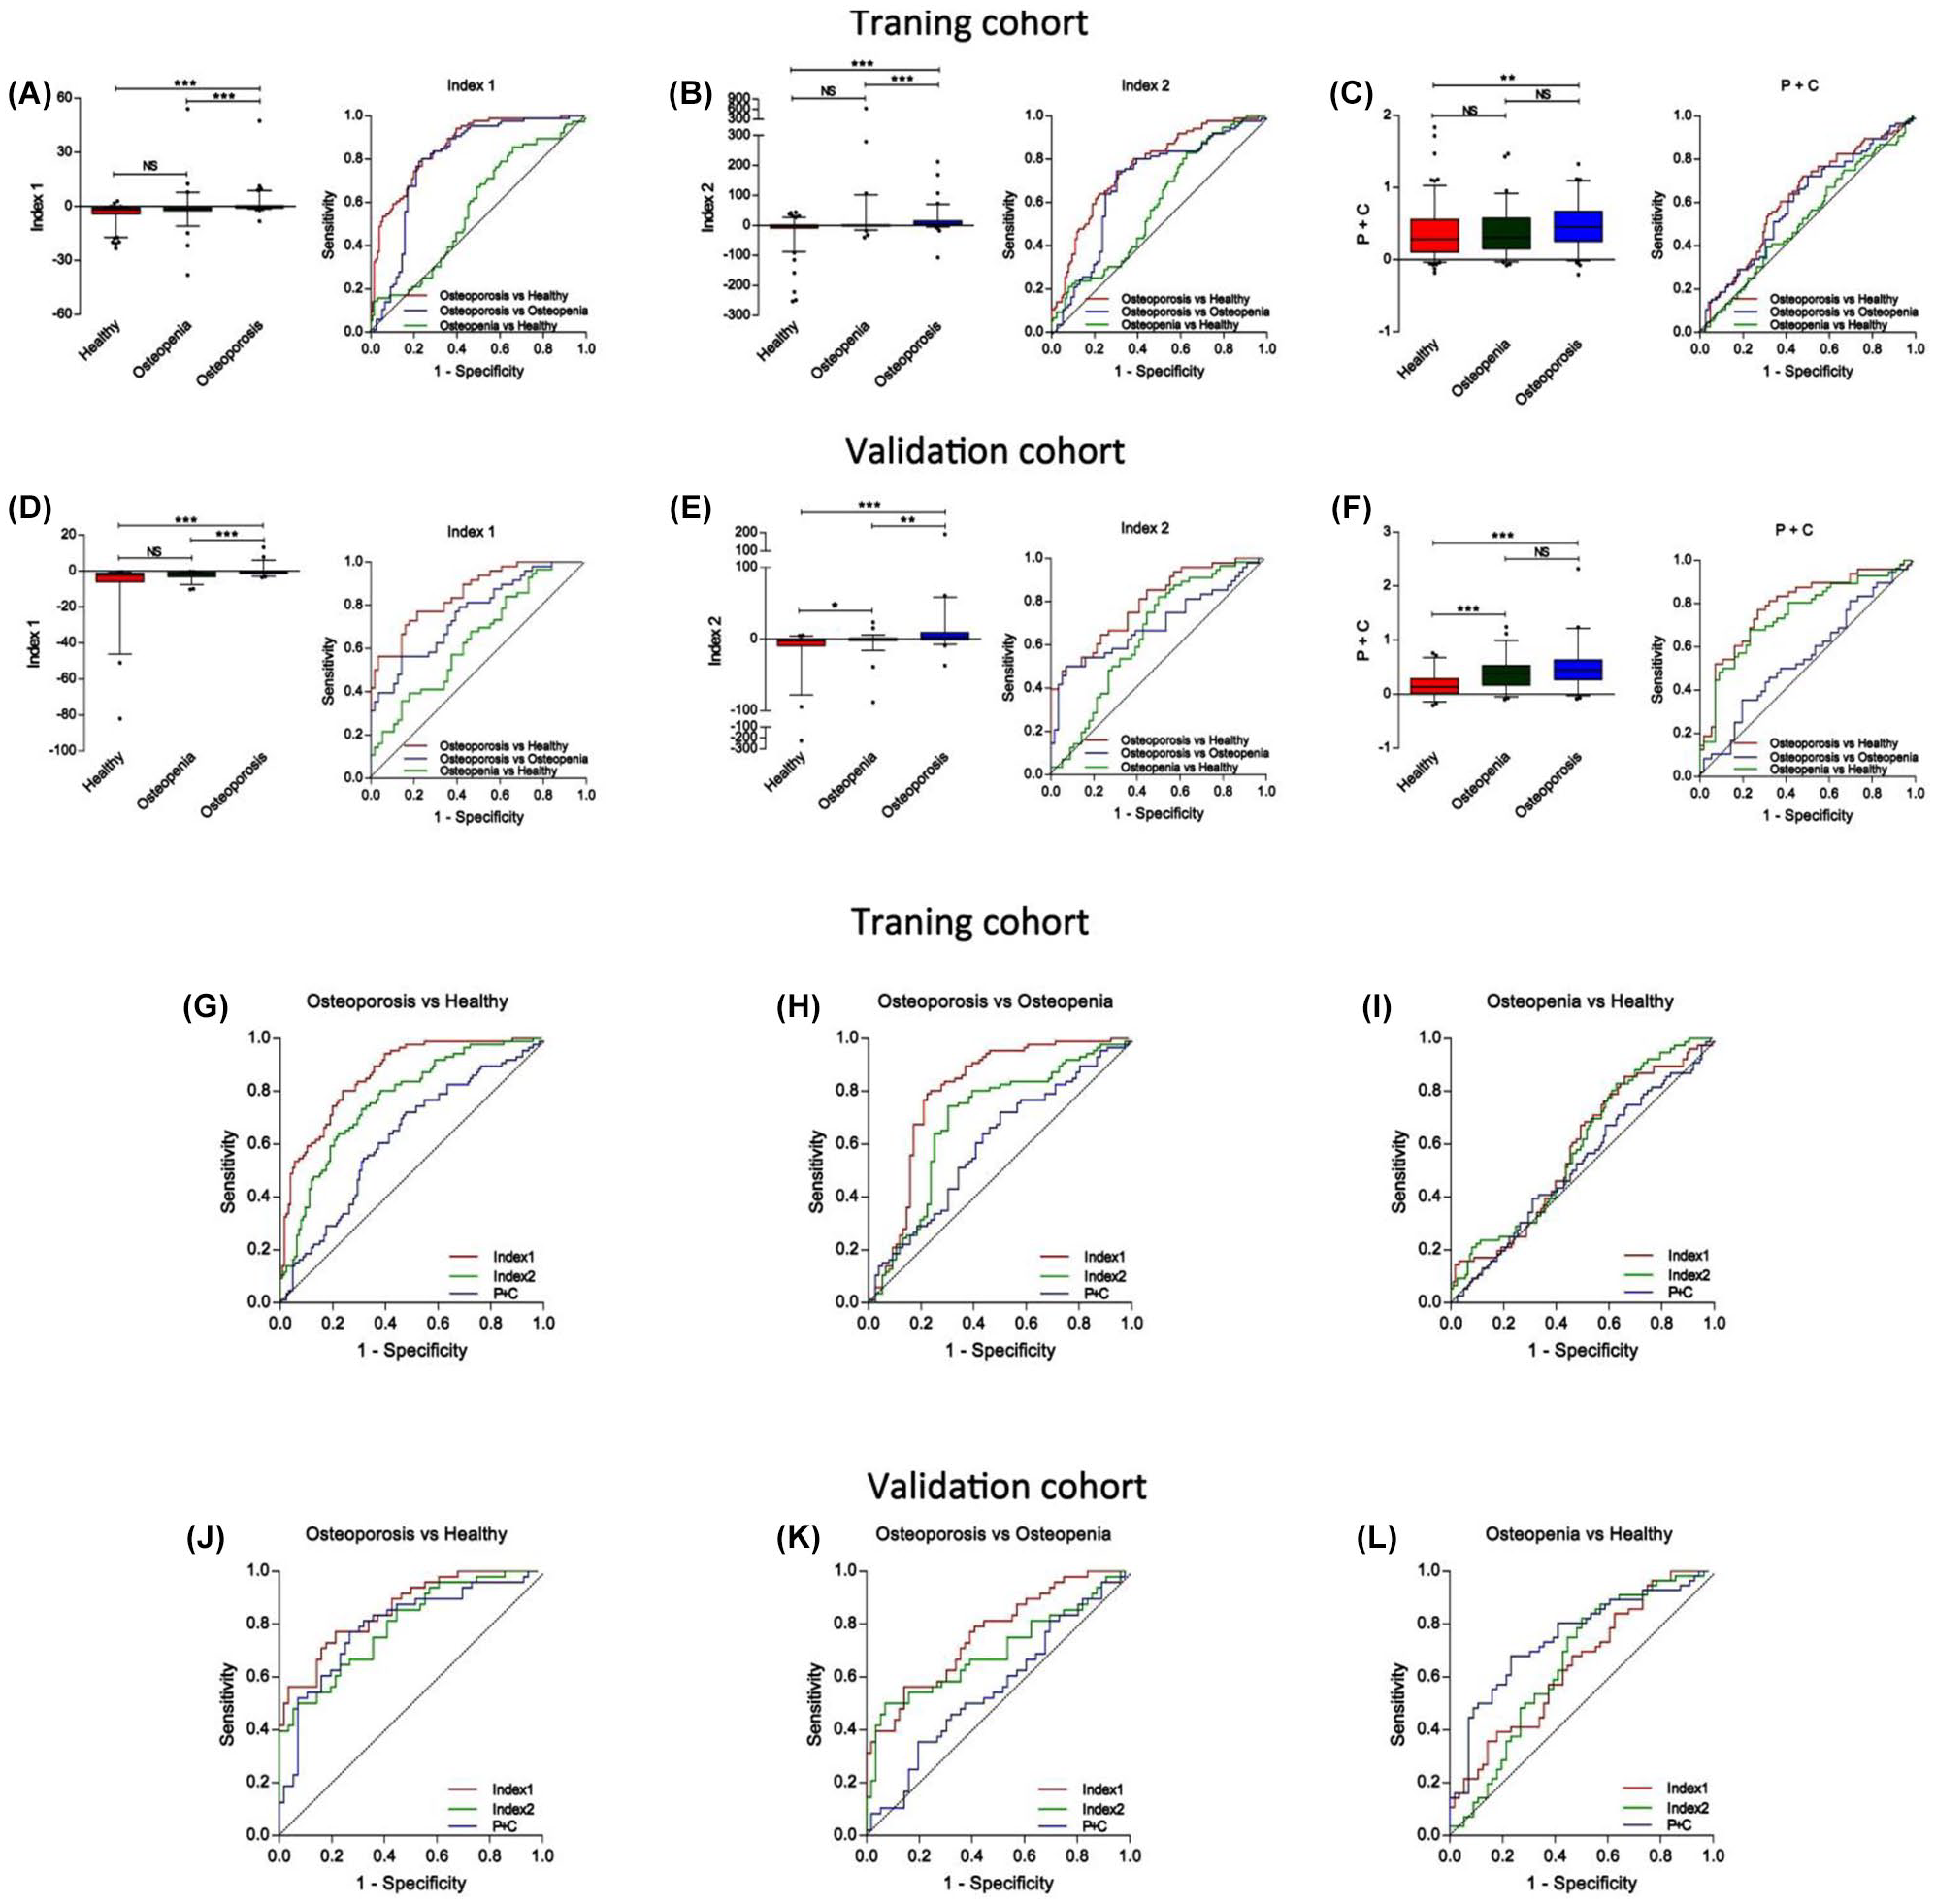
The performances of Index 1, Index 2 and tPINP combined with β-CTx to identify osteoporosis. (A–C) Box-plots and ROC curves of Index1 (A), Index2 (B), and P+C (C) from healthy participants, osteopenia participants, and osteoporosis participants in the training cohort; (D–F) Box-plots and ROC curves of Index1 (D), Index2 (E), and P+C (F) from healthy participants, osteopenia participants, and osteoporosis participants in the validation cohort; (G–I) Comparison of ROC curves of Index1, Index2, and P+C to differentiate osteoporosis patients from healthy participants (G), osteoporosis patients from osteopenia participants (H), and osteopenia participants from healthy participants (I) in the training cohort; (J–L) Comparison of ROC curves of Index1, Index2, and P+C to distinguish osteoporosis patients from healthy participants (J), osteoporosis patients from osteopenia participants (K), and osteopenia participants from healthy participants (L) in the validation cohort.
In the validation cohort, the performances of Index 1 and Index 2 were validated in 160 independent samples. The diagnostic performance of individual miRNA is shown in Supplemental Figure S3 and Table 3. To distinguish osteoporosis patients from healthy participants, the AUC was 0.85 (95% CI, 0.79–0.92) for Index 1 and 0.79 (95% CI, 0.71–0.88) for Index 2. To distinguish osteoporosis patients from osteopenia participants, the AUC was 0.76 (95% CI, 0.67–0.85) for Index 1 and 0.70 (95% CI, 0.59–0.80) for Index 2. To distinguish osteopenia participants from healthy participants, the AUC was 0.65 (95% CI, 0.54–0.75) for Index 1 and 0.65 (95% CI, 0.55–0.76) for Index 2 (Figure 2D, E, J–L, Table 3). Moreover, for Index 1, 80% (38/48) osteoporosis patients, 66.1% (37/56) healthy participants, and 55.3% (31/56) osteopenia participants received a correct diagnosis; For Index 2, 80% (38/48) osteoporosis patients, 58.9% (33/56) healthy participants, and 37.5% (21/56) osteopenia participants got a correct diagnosis (Table 3). In addition, the correlation of Index1 and BMD was stronger than individual miRNA and stable in the training and validation cohort (Supplemental Table S13). These results indicate that Index 1 performed better than Index 2 in osteoporosis diagnosis.
The performance of individual miRNA, Index1 and Index2 in the validation cohort.

Note: Designed sensitivity#: the performance was considered by defining a cutoff value corresponding to fixing the sensitivity to 80.00%.
AUC, area under the ROC curve; CI, confidence interval; miRNA, microRNA; ROC, receiver operating characteristic.
miRNA Index 1 is more powerful to identify osteoporosis than traditional bone turnover biomarkers
To compare the validity of miRNA panels with traditional biomarkers, we analyzed the levels of β isomerized C-terminal cross-linking telopeptides of type I collagen (β-CTx) and total N-terminal propeptides of type I pro-collagen (tPINP) – two bone turnover biomarkers recommended by the International Osteoporosis Foundation (IOF). In the training cohort and validation cohort , the AUCs for tPINP combined with β-CTx (P+C) were 0.62 (95% CI, 0.55–0.70) and 0.79 (95% CI, 0.70–0.88), respectively, for osteoporosis patients versus healthy participants, and 0.60 (95% CI, 0.51–0.69) and 0.56 (95% CI, 0.45–0.67), respectively, for osteoporosis patients versus osteopenia participants (Figure 2C, F, G–L, Supplemental Figure S4, Table 4). The AUCs for P+C to distinguish osteoporosis patients from osteopenia and healthy participants were lower than those of the miRNA Index 1 (Figure 2C, F, G–L, Table 4). For Index of P+C, 67.9% (38/56) healthy participants and 30.4% (17/56) osteopenia participants got a correct diagnosis. The accuracy rate was also lower than that of miRNA Index 1 (Table 4).
The performance of BTMs and miRNA Index1.

Note: Designed sensitivity#: the performance was considered by defining a cutoff value corresponding to fixing the sensitivity to 80.00%. P+C: the logistical model of serum tPINP and β-CTx.
AUC, area under the ROC curve; BTM, bone turnover marker; CI, confidence interval; miRNA, microRNA; ROC, receiver operating characteristic.
In the clinic, only patients with osteoporosis (T score ⩽−2.5) are considered for pharmacotherapy. 5 To establish an evaluative index for treatment decisions, all samples were redistributed as a non-osteoporotic subgroup (comprising of healthy and osteopenic participants) and osteoporotic subgroup (osteoporosis participants). MiRNA Index 1 efficiently separated osteoporotic individuals from non-osteoporotic population in the training cohort [AUC of 0.84 (95% CI, 0.79–0.88)] and validation cohort [AUC of 0.81 (95% CI, 0.74–0.88)]. Compared with miRNA Index 1, Index of tPINP and β-CTx was less powerful to identify osteoporosis (Supplemental Figure S5, Supplemental Table S10).
miRNA Index 1 is not affected by gender and age
To identify whether Index 1 works stably in different genders, all samples were regrouped by gender and reanalyzed. Index 1 efficiently separated healthy participants and osteopenia participants from osteoporosis patients both in male and female populations in the training and validation cohort. The performance of Index 1 was similar between the male and female populations (Supplemental Figure S6, S9, and Supplemental Table S11).
To verify whether the expression of these candidate miRNAs was affected by age, we assessed the value of Index 1 in the different age subgroups of healthy participants, osteopenia participants, and osteoporosis patients. No significant difference was found between the age <60 subgroups and age ⩾60 subgroups in each population (Supplemental Figure S7). We also assessed the performance of Index 1 in age-matched populations. For osteoporosis patients versus healthy participants, the AUC was 0.83 (95% CI, 0.76–0.91) in mid-age population, while it was 0.91 (95% CI, 0.81–1.00) in the old-age population; For osteoporosis patients versus osteopenia participants, the AUC is 0.75 (95% CI, 0.66–0.84) in mid-age population, while 0.76 (95% CI, 0.65–0.86) in the old-age population; for osteopenia participants versus healthy participants, the AUC is 0.61 (95% CI, 0.52–0.69) in mid-age population, while it is 0.75 (95% CI, 0.56–0.93) in the old-age population (Supplemental Figure S8 and Supplemental Table S12). These data indicate that miRNA Index 1 was affected by osteoporosis status, not age.
Discussion
Until now, only a few studies aimed at detecting circulating miRNAs for osteoporosis diagnosis have been reported.26–30,32 However, these studies were limited by one or more defects of experimental design. First, in several studies, the miRNA panel had not been validated by an independent cohort. Second, miRNA screening performed in some studies was not based on the whole miRNA bank, which raised the possibility of missing some key miRNAs in the discovery phase. Third, the sample numbers in some studies were not large enough to present a firm conclusion. Fourth, the performance of the miRNA panel in some studies was not good enough to be a biomarker.
In our study, we included 182 healthy participants, 132 osteopenia participants, and 134 osteoporosis patients, and conducted a case-control study to develop miRNA panels. To our knowledge, this is the first cohort-dependent study aimed at finding biomarkers for osteoporosis by screening the whole miRNA bank.
In this study, we focused on the relationship between circulating miRNA and BMD. This is because BMD is one of the most critical factors determining bone fracture rate. We also noticed a few studies suggesting that circulating miRNAs are also related to fracture,23,26 thus miRNAs could have the potential to solve the discrepancy issue between low BMD and the rate of fragility fracture. Therefore, our next project will focus on investigating whether the miRNAs could be used as biomarkers to predict fracture in a follow-up study of these participants.
miRNAs could be a rich source of osteoporosis biomarkers to provide diagnostic information because of their fundamental roles in bone development, remodeling, and corruption during osteoporosis. By retrieving The Human miRNA Tissue Atlas, miR-30c-2-3p, miR-199a-5p, miR-424-5p, and miR-497-5p are proven to be present in bone tissues (Supplementary Table 14), suggesting bone tissue as a possible source of these miRNAs. According to published documents, all the miRNAs in Index 1 have been confirmed to be related to bone development and remodeling (Supplementary Table 14). Specifically, miR-199a is highly expressed in osteoblasts and chondrocytes compared with mesenchymal stem cells, 33 and could promote osteogenesis of mesenchymal stem cells through the hypoxia-inducible factor-1 alpha (HIF1α) pathway 34 ; whereas miR-199a-5p is also reported to regulate osteoclastogenesis, miR-30c impedes osteogenesis or calcification by targeting osteogenic specific transcriptional factor RUNX235,36; miR-424 is reported to suppress osteogenic differentiation of adipose stem cells (ASCs) 37 ; miR-497 inhibits osteogenic differentiation of MSCs via BMP signaling and angiogenesis-related pathway 38 ; and miR-877-3p regulates MSCs osteogenesis through Smad7 signaling. In this study, the target genes of the 5 miRNAs (miR-30c-2-3p, miR-199a-5p, miR-424-5p, miR-497-5p, miR-877-3p) had been shown to regulate the TGF-β pathway and mesenchymal stem cell differentiation by gene ontology (GO) analysis (data not shown), suggesting that they play a role in bone remodeling. This evidence supports the notion that the candidate circulating miRNAs in our study are important regulators of bone development and remodeling. But it remains elusive where these circulating miRNAs come from and why their expression is dysregulated during osteoporosis. Additional studies are needed to understand the rationale for these circulating miRNAs to be biomarkers of osteoporosis.
Although BTMs are sensitive to bone remodeling, poor diagnostic performance hinders their application in the clinical diagnosis of osteoporosis. According to previous reports,39–44 the performances of serum procollagen Type I N-terminal propeptide (PINP), procollagen type I C-terminal propeptide (PICP), serum carboxy-terminal collagen crosslinks-a (CTX-a), and serum alkaline phosphatase (ALP) to distinguish osteoporosis patients from the non-osteoporotic population are 0.71, 0.75, 0.48–0.70, 0.59, and 0.60–0.70, respectively. Therefore, tPINP and β-CTX are of no value as diagnostic or prognostic markers for osteoporosis. However, the IOF and International Federation of Clinical Chemistry still recommend studies to include these two markers as references at a minimum. Therefore, we might just use these two BTMs as reference markers to evaluate the performance of miRNAs, but not to demonstrate the efficacy of miRNAs in diagnosing osteoporosis. In this study, the performance of miRNA Index 1 was AUC of 0.85 in the validation cohort, which was better than tPINP and β-CTX, indicating that circulating miRNAs have the potential to identify osteoporosis.
In the discovery cohort, there was a discrepancy in the age of healthy participants, osteopenia participants, and osteoporosis patients. This was due mainly to that fact that the incidence and severity of osteoporosis are closely associated with aging.45,46 To exclude the influence of age in our results, we compared the Index values in groups of different ages, and no significant difference was found. We also evaluated the efficacy of the miRNA Index in the age-matched population. Of note, the miRNA Index worked efficiently to differentiate osteoporosis patients from non-osteoporosis individuals in both the mid-age group and the aged group. The results largely excluded the influence of age.
There are a few limitations to our study. First, the participants were collected from a clinical center in China and most of them are of Han nationality. Further multicenter investigations are necessary to determine whether the miRNA panels work in other ethnicities. Second, the positive predictive value of our study is not fully comparable with the gold-standard of osteoporosis diagnosis. A small percentage of osteoporosis patients diagnosed with circulating miRNAs might be healthy. Although the two miRNA diagnostic panels could not replace DXA in osteoporosis diagnosis, they could be useful tools in large-scale osteoporosis screening, routine medical examination, and in community clinics. The information from circulating miRNA in blood assay would be valuable for clinicians to refer more asymptomatic individuals with suspected osteoporosis for further diagnosis. Third, the major limitation is that this study addressed only BMD as endpoint and not osteoporotic fracture. The current study does not develop a predictive tool to evaluate fracture risk of osteoporotic patients, which is significant in managing osteoporosis. Further study will concentrate on this topic to improve the prognostic value of these biomarkers, and facilitate the management of osteoporosis.
Supplemental Material
Supplemental_Data-revised_7-13 – Supplemental material for Circulating microRNAs in serum as novel biomarkers for osteoporosis: a case-control study
Supplemental material, Supplemental_Data-revised_7-13 for Circulating microRNAs in serum as novel biomarkers for osteoporosis: a case-control study by Yi Shuai, Li Liao, Xiaoxia Su, Nanxi Sha, Xiaobo Li, Yutao Wu, Huan Jing, Huijuan Kuang, Zhihong Deng, Yongqi Li and Yan Jin in Therapeutic Advances in Musculoskeletal Disease
Footnotes
Acknowledgements
We thank Rong Tian, Meng Bai, and Pingping Gao for the technical assistance of serum preparation, miRNA detection in the Research and Development Center for Tissue Engineering, Fourth Military Medical University, Xi’an, Shaanxi, China.
Authorship Contributions
Yan Jin, Yongqi Li, Zhihong Deng, Yi Shuai, and Li Liao conceived and designed the study. Yan Jin, Yongqi Li, and Zhihong Deng supervised the project. Yi Shuai and Li Liao performed the experiments, analyzed the data, and wrote the manuscript. Yan Jin, Yongqi Li, and Zhihong Deng reviewed the manuscript. Nanxi Sha, Xiaobo Li, Xiaoxia Su, and Huan Jing participated in the partial work of sample collection, Yutao Wu and Huijuan Kuang participated in data analysis. Yi Shuai and Li Liao contributed equally to the study.
Conflict of interest statement
The authors declare that there is no conflict of interest.
Funding
The authors disclosed receipt of the following financial support for the research, authorship, and/or publication of this article: this project was supported by The National Key R&D Program of China (2017YFA0104900, 2016YFC1101400) and Nature Science Foundation of China (81600912, 31601113, 81470679, 81670915, 31670995), the Fundamental Research Funds for the Central Universities (YJ201878), Key Project of Sichuan province (2019YFS0311, 2020YFS0177), and Natural Science Foundation of Jiangsu Province, China (BK20190250).
Supplemental material
Supplemental material for this article is available online.
References
Supplementary Material
Please find the following supplemental material available below.
For Open Access articles published under a Creative Commons License, all supplemental material carries the same license as the article it is associated with.
For non-Open Access articles published, all supplemental material carries a non-exclusive license, and permission requests for re-use of supplemental material or any part of supplemental material shall be sent directly to the copyright owner as specified in the copyright notice associated with the article.