
Abstract
Frequent tsunamis across the globe have devastated the coasts and led to significant loss of life and property. This calls for a better understanding and estimation of the tsunami characteristics. Considering the scale of the problem, numerical modelling is the most suitable method for tsunami simulation and understanding. Most tsunamis are long-period wave and governed by shallow water equations. Although tsunami is expected to initiate in the deeper waters with very less height, it may have significant amplification while traversing over the slopes. In this study, an attempt is made to understand the effect of continental slope on the transmission, propagation and run-up of tsunami. This study provides better understanding of the physical process through computation of tsunami run-up height and arrival time. To carry out this investigation and to get a preliminary understanding, a one-dimensional numerical model study is carried out using shallow water equations. These equations are solved using Crank–Nicolson finite difference approximation method on a staggered grid. This study is carried out by considering N-wave-type tsunami profile with leading depression (trough). In this study, various continental slope profiles available along the Indian coast were considered. The amplification or attenuation of the tsunami characteristics over these cross-sections was studied. Significant change in the tsunami run-up is observed for different continental slope and water depth on continental shelf.
Introduction
Tsunamis, earthquake-generated sea waves, are generated in the deep ocean and propagate towards the shore (Li and Raichlen, 2001). Frequent tsunamis across the globe have devastated the coasts and led to significant loss of life and property. This calls for a better understanding and estimation of the tsunami characteristics. Tsunami is a shallow water wave, which undergoes deformation due to near-shore bathymetry reducing its speed, resulting in increase in wave height in the process of their propagation (Kowalik et al., 2006; Sriram et al., 2006). After reaching the shore, tsunamis can break and travel over land for large distances causing severe property damage and loss of life (Behera et al., 2008). The tsunami may also split into multiple waves experiencing nonlinear instability depending upon the wave steepness (Zahibo et al., 2008), which is not considered in this study. It is necessary to understand the effect of near-shore bathymetry on tsunami characteristics and prediction of run-up (Behera et al., 2011), which will help in adopting appropriate measures to reduce the property damage and loss of life. In the past, various studies have been carried out to investigate the tsunami run-up on different beach slopes and suggested empirical formulae for computation of the tsunami run-up. Gjevik and Pedersen (1983) developed a numerical model based on a Lagrangian description for studying run-up of long water waves on beach slopes varying from 0° to 45°. Synolakis (1987) studied the run-up of solitary wave on plane beaches by conducting various laboratory experiments over different beach slopes varying from 2° to 45°. The author observed that run-up variation is different for breaking and non-breaking waves. Grilli et al. (1997) had reported that waves will not break on beach with slope steeper than 1:4.7. They have also concluded that shoaling rate decreases for slopes steeper than 1:15. At the same time, waves may break very close to the shoreline for moderately steep slopes. Gedik et al. (2005) had observed that armour units used for beach protection cause 50% reduction in run-up height. If wave steepness is greater than 0.015, the run-up decreases for increasing value of bed friction (Borthwick et al., 2006). Hsiao et al. (2008) conducted laboratory experiments and developed a formula to compute maximum run-up height for beach slopes varying from 1:15 to 1:60. Madsen and Fuhrman (2008) observed that the impact of run-up on flat beaches (with slopes of the order of 1:100) is much higher compared to that on steep beaches (with slopes of the order of 1:15). The reflection coefficient decreases when run-up height and wave steepness increase (Gedik et al., 2011). Lin et al. (2014) had concluded that the maximum run-up velocity increases gradually along the slope before the solitary wave reaches its breaking point. There were numerous experimental, analytical and numerical model studies carried out on behaviour of tsunami along the coast. However, most of the studies were based on the analysis of solitary wave propagation over different beach profiles and the subsequent run-up. However, Tadepalli and Synolakis (1994) represented tsunami using an N-wave profile that closely represents a typical tsunami generated due to underwater earthquake. The study investigated the run-up of N-wave type tsunami on beach slope and reported that all classes of leading depression waves have higher run-up than equivalent leading elevation waves. Madsen and Schäffer (2010) provided an analytical solution for determining run-up of nonlinear long waves like N-waves on a plane beach of slope 1:75 using nonlinear shallow water equations (SWE). The analytical results were compared with numerical results obtained by higher order Boussinesq model and obtained good validation in run-up elevation and velocity. Behera et al. (2011) have studied the coupled tide–tsunami interaction by considering N-wave-type tsunami profile on a flat bed and vertical wall-type shoreline boundary. However, the shoreline profiles can vary from vertical cliffs to inclined near-shore slopes. Liang et al. (2013) had concluded that solitary wave resulted in lower run-up than leading depression N-wave and higher run-up than leading elevation N-wave of the same incident amplitude. Although many studies were focused on the effect of beach and near-shore slope on tsunami run-up, not many investigations were found on the effect of continental slope on tsunami characteristics. The literatures suggest that there is a need to study the effect of continental slope on tsunami run-up, which plays a significant role in tsunami run-up characteristics in the near shore and over land region. This study is mainly focused on investigating the effect of continental slope on incoming tsunami, and thus, the nonlinear splitting was not considered in the study which should be accounted for in case of an actual tsunami simulation. Thus, a preliminary one-dimensional (1D) numerical study is carried out to investigate the effect of continental slope on tsunami run-up.
Numerical model
Tsunami that propagates thousands of kilometres from average water depths of around 3000 m to shore is a three-dimensional (3D) process. However, considering the large horizontal spanning in comparison to its vertical scale, it can be considered in two dimensions. The preliminary investigation to understand the effect of continental slope on the tsunami characteristics can be carried out using a 1D numerical model. Tsunami being a shallow water wave can be simulated using SWE.
Governing equations and boundary conditions
In this study, a numerical model is developed using 1D SWE that are given by

where η is sea surface elevation, H is total water depth (still water depth from mean sea level (d) + sea surface elevation (η)), u is average velocity of the water particle, q is the flow discharge in the x direction (uH), g is acceleration due to gravity, ρ is density of sea water, τb is bottom stress and kb is dimensionless bottom friction coefficient. The value of friction coefficient (kb) varies from 1.0 × 10⁻³ to 3.0 × 10⁻³ (Dotsenko, 1998) and kb = 2.0 × 10⁻³ is considered in this study. Here, Pa is the atmospheric pressure, that is, equal to 0. Thus, the modified momentum equation can be written as
In this study, the shoreline boundary is assumed as an abrupt end of the coast with finite water depth, and no flow condition is applied. The open boundary is imposed with radiation boundary condition given by Flather (1976). Velocity of tsunami at the open boundary is given by
Solution of SWE
The two equations (1) and (4) can be solved using Crank–Nicolson finite difference method on a staggered grid (Figure 1) with first-order difference in time and space. The staggered grid arrangement is shown in Figure 1, where the sea surface elevations (η) are defined by filled circles and discharges (q) are defined by empty circles. The staggered grid requires either sea level or velocity as boundary condition input (Kowalik and Murty, 1993).
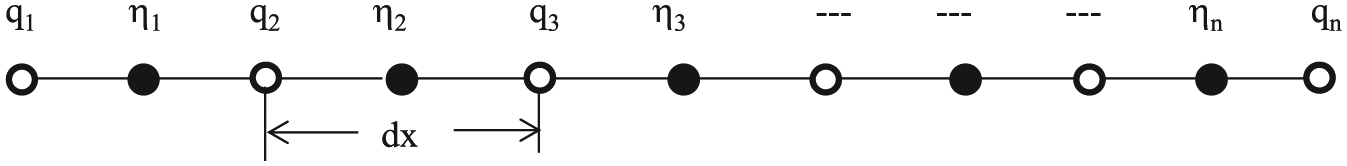
Staggered grid pattern used to define the variables in the computation.
The continuity and momentum equations in central difference form are given as
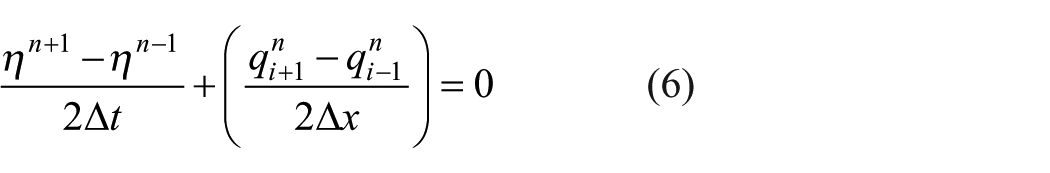
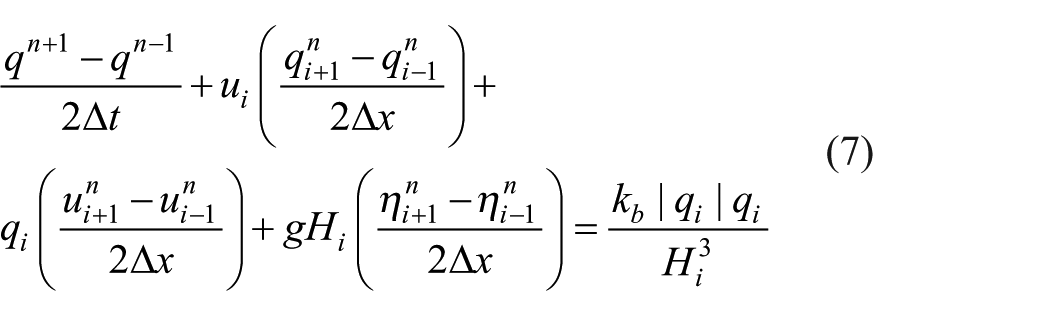
Here, n is time level, Δt is time step, i is spatial node number and Δx (dx) is the grid size, shown in (Figure 1). The unknown η and q at all the nodes except at the boundary are obtained by solving the above equations.
Validation of the numerical model
In general, a numerical model is validated with standard numerical model or physical model results. In this study, the 1D numerical model, developed using the SWE, is validated with Kowalik et al. (2006) who have studied the tide–tsunami interaction for Gulf of Alaska region. A numerical model domain, same as of Kowalik et al. (2006), is considered for the study. The model domain consists of 1000-km-long channel with constant water depth up to 875 km from the open boundary (0 km) and varying depth for a stretch of 125 km towards the shore (Figure 2). The water depth is 3000 m starting from the open boundary to 875 km along the domain and then reduces from 3000 to 5 m at the truncated shoreline boundary. In the present model, the shoreline boundary is assigned with finite water depth of 5 m for numerical stability, unlike the wet–dry boundary condition used in the study of Kowalik et al. (2006).
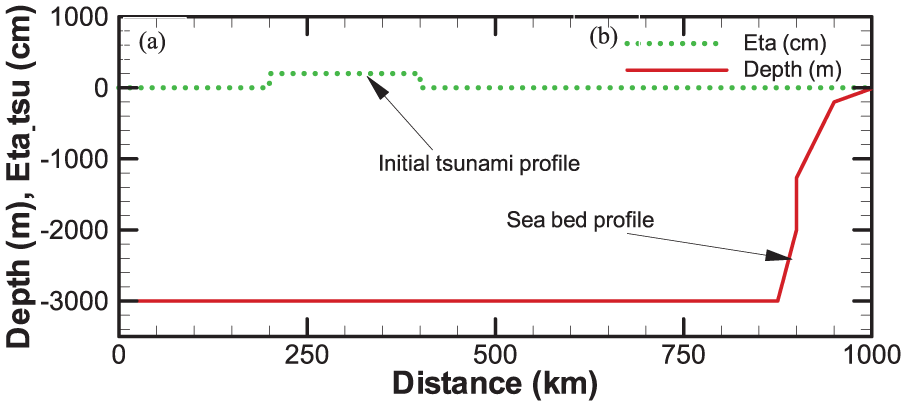
Bathymetry and initial tsunami profiles of the model domain.
Simulation of tsunami was carried out by generating a perturbation with uniform bottom uplift of height 2 m and length 200 km located between 200 and 400 km (Kowalik et al., 2006) (Figure 2). The model was initialized with zero elevation and zero velocity all through the domain, except the tsunami perturbation given in Figure 2. The simulation was carried out, and tsunami elevation profiles were recorded. The extracted tsunami profiles were compared with the results of Kowalik et al. (2006). The tsunami elevation and velocity at open and shoreline boundary were obtained from the present model and compared with that of Kowalik et al. (2006) (Figures 3 and 4). It was observed that present model results are in good agreement with Kowalik et al. (2006) up to the arrival of initial tsunami, whereas a difference is noticed for the reflected tsunami record. This difference is expected as the shoreline boundary is imposed with no flow condition unlike the wet–dry boundary condition in Kowalik et al. (2006).
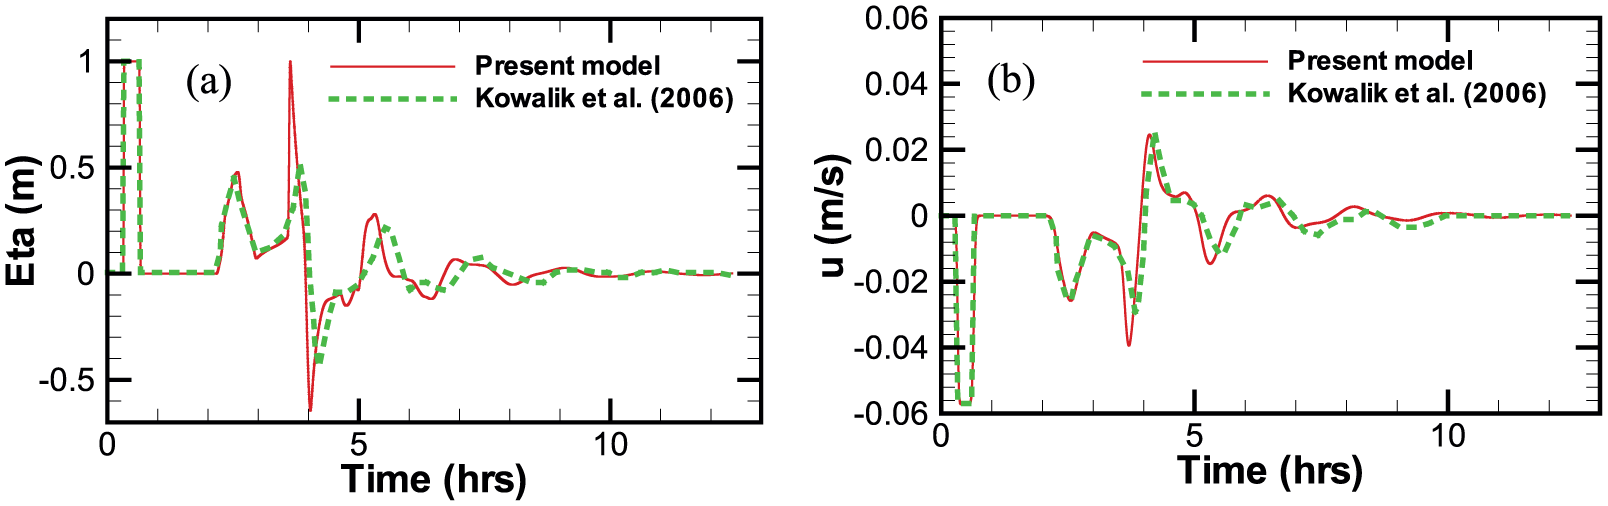
Comparison of tsunami characteristics at the open boundary from present model with Kowalik et al. (2006): (a) sea surface elevation and (b) velocity.
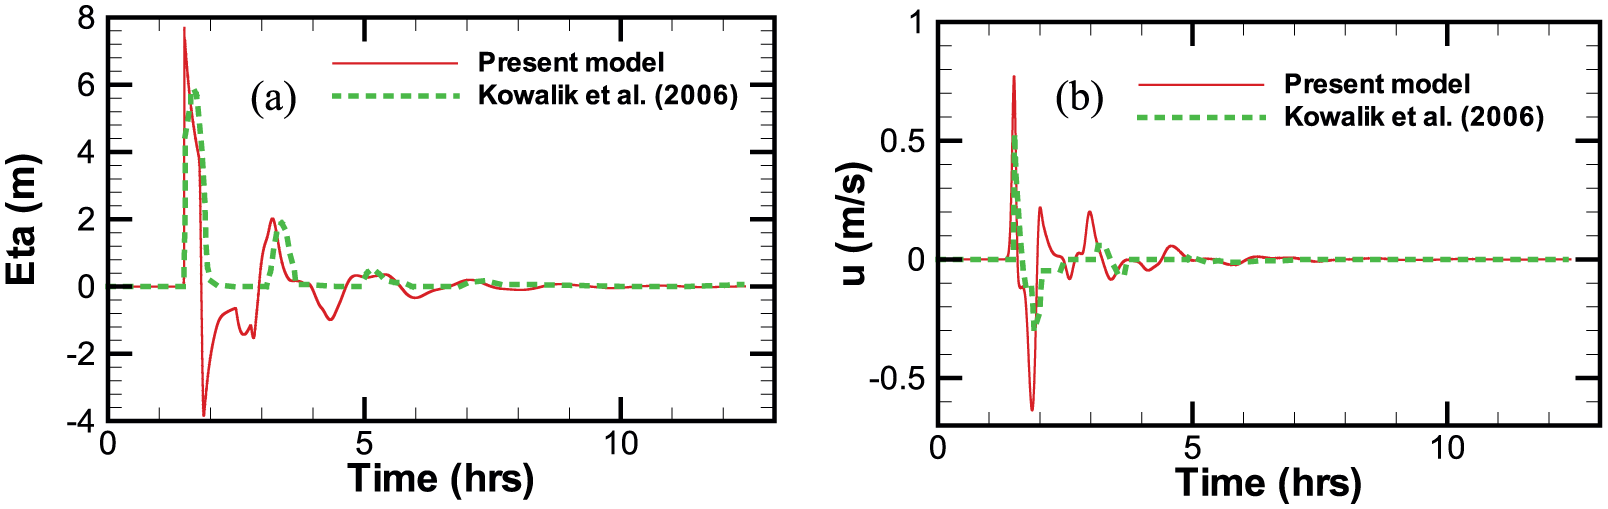
Comparison of tsunami characteristics at the shoreline boundary from present model with Kowalik et al. (2006): (a) sea surface elevation and (b) velocity.
Numerical model domain
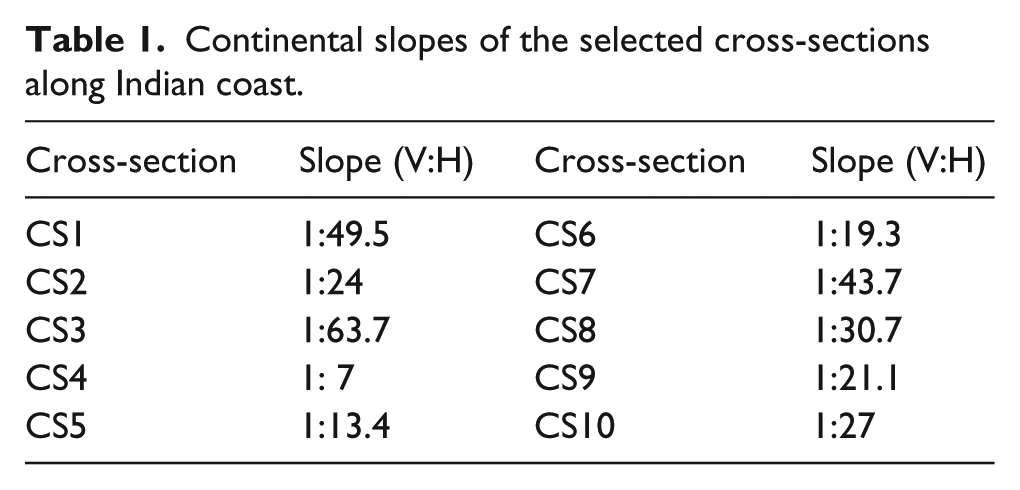
The model was used to investigate the effect of different continental slopes on tsunami propagation, amplification and its profiles. Although the study has been undertaken for preliminary understanding, the slopes present in the actual continental shelves are considered in the simulation. The continental slopes are obtained from the General Bathymetric Chart of the Oceans (GEBCO) bathymetry data (30 arc-seconds resolution). The depth profiles of 10 salient cross-sections along the Indian coast are obtained (Figure 5). The selected cross-section tracks are mostly perpendicular to the continental shelf profile that represents the actual slope. The continental slopes available along the Indian coast are given in Table 1, and typical continental shelf profiles for cross-sections 3 and 4 are shown in Figure 6(a) and (b), respectively.
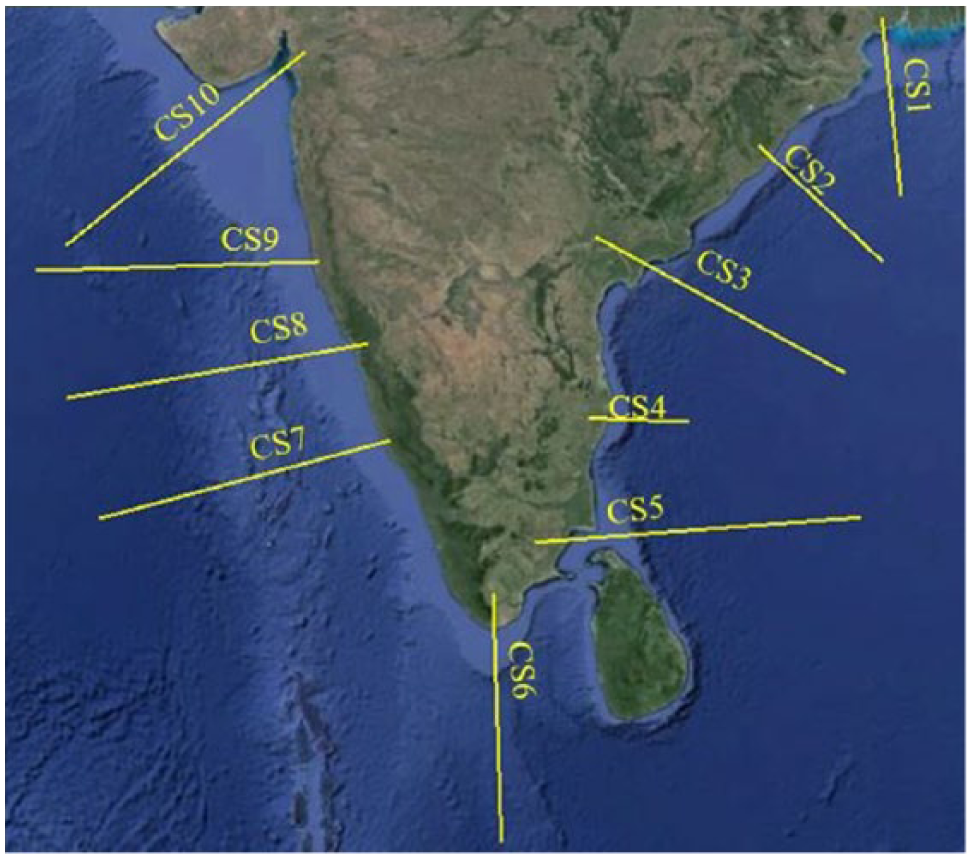
Selected cross-sections along Indian coast considered in this study (image: earth.google.com).
Continental slopes of the selected cross-sections along Indian coast.
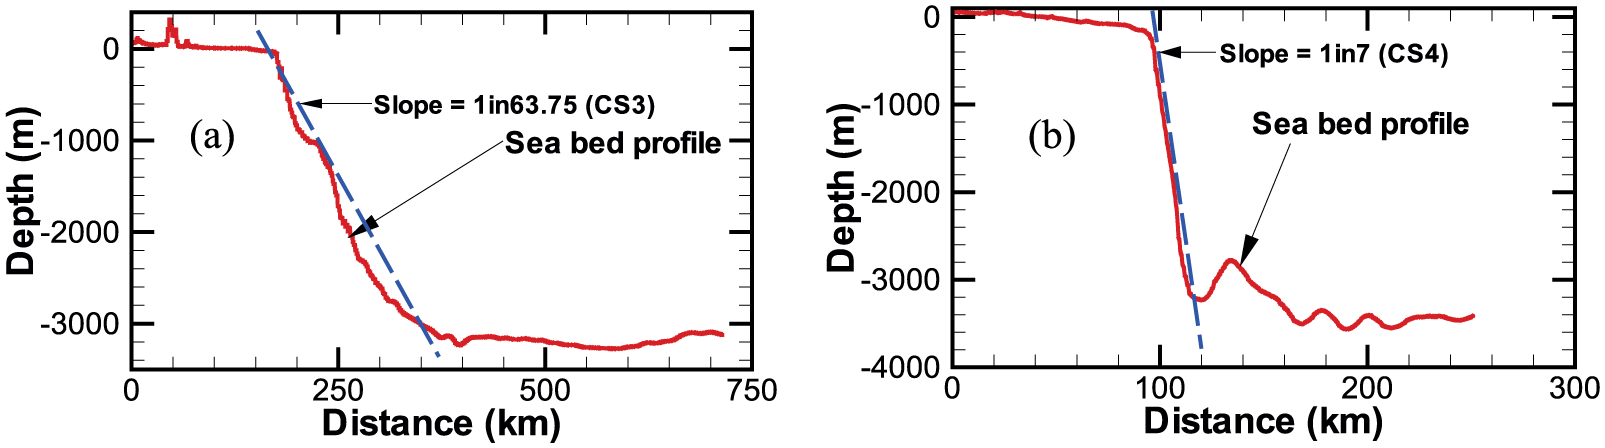
Typical profiles of cross-section: (a) CS3 and (b) CS4 along the Indian coast showing continental slope.
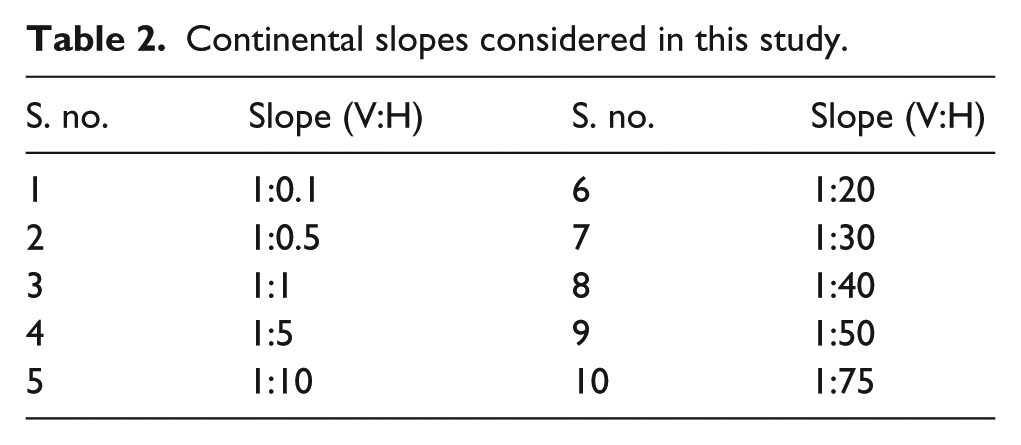
Table 1 shows that the continental slopes available along the Indian coast are varying from 1:63.7 to 1:7. There are also steeper slopes present at locations along the coast of Andaman Islands. For the overall understanding, the slopes varying from 1:75 to 1:0.1 are considered in this study (given in Table 2). A near-shore slope of 1:1110, 1:714, 1:526 and 1:256 has been adopted for continental shelf depths of 50, 75, 100 and 200 m, respectively.
Continental slopes considered in this study.
This study is carried out by considering a domain of 1200 km long having constant water depth of 3 km up to a distance of 875 km from the open boundary. The bathymetry profile used for this study is shown in Figure 8. Previous studies (Behera et al., 2011; Tadepalli and Synolakis, 1994) had concluded that leading depression N-waves lead to higher run-up than that of leading elevation N-waves. The N-wave with trough ahead of crest in the direction of its propagation is called leading depression N-wave. The N-wave profile was generated using two Gaussian distribution functions (Behera et al., 2011), where one profile was reversed to generate the depression. The Gaussian distribution function can be given as
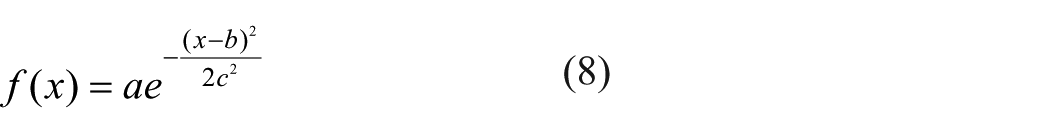
where a is the crest or trough height, b is the position of the centre of the peak and c controls the width at the base of the profile. In this study, an initial leading depression N-wave tsunami profile of height 4 m (crest height of 2 m and trough height of 2 m) and length 200 km spanning between 200 and 400 km was considered as shown in Figure 7. The base width of N-wave was considered as 200 km, centred at 650 km. It was positioned in such a way that the tsunami is initiated before the amphidrome A.
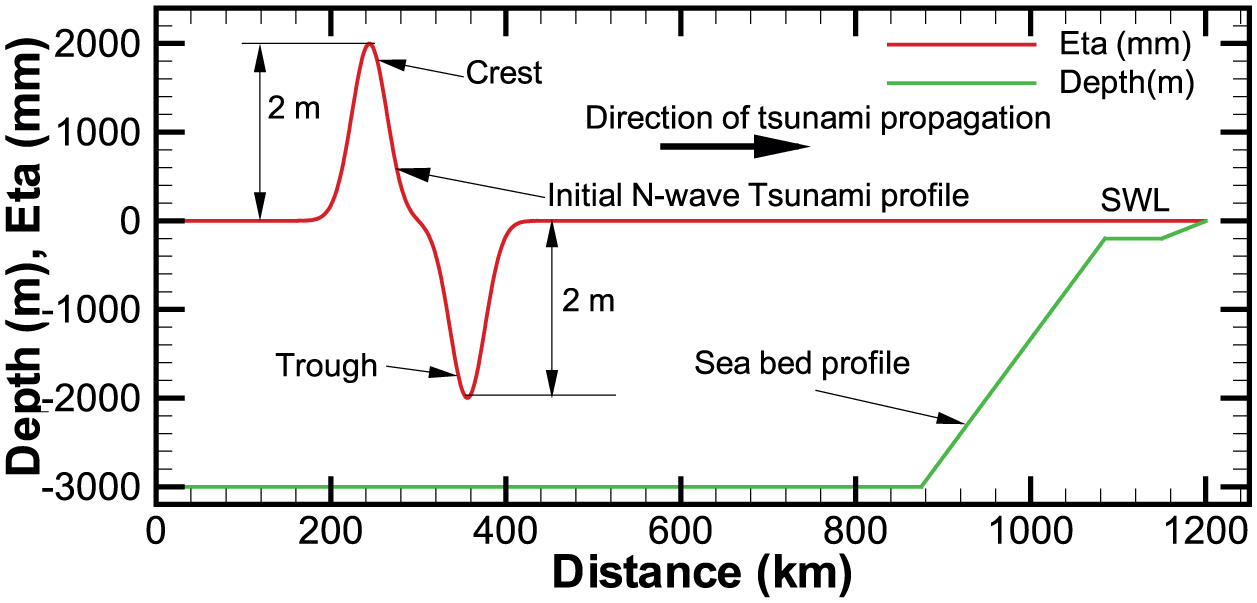
Initial N-wave tsunami and bathymetry profiles considered in this study.
Tsunami elevations are observed at three locations P1, P2 and P3 as shown in Figure 8. The first probe is placed in deep ocean (3 km depth) at P1 (800 km from the open boundary) to observe the incident tsunami profile. The second is placed at P2 (1100 km from the open boundary) which is on the continental shelf to observe the transformations in the tsunami profile due to continental slope. The third probe is placed at shore (P3) to observe the tsunami run-up characteristics at the shore.
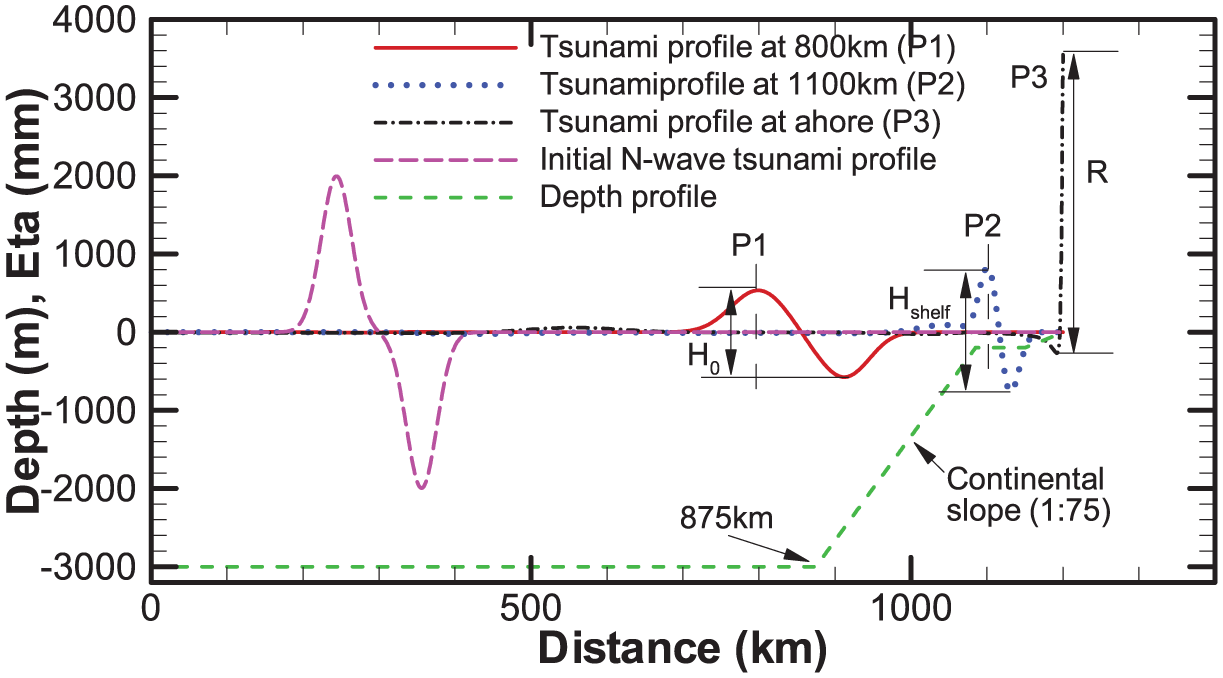
Typical tsunami profiles at three probe locations and bathymetry profile considered in this study.
Results and discussion
The simulation was initiated by releasing the initial tsunami perturbation that splits into two waves, each propagating in the opposite direction. The wave that propagates towards the open (radiation) boundary moves out of the domain without any reflection. The tsunami that propagates towards the shore undergoes various transformations in its wave height and wave length along the domain. The transformation of the tsunami characteristics occurs mainly due to continental slope and near-shore slope. The effect of slopes on the tsunami can be analysed by observing its profile at the three probe locations as specified in Figure 8. The tsunami height is considered as the distance between tsunami crest and tsunami trough for all the three probe locations. Typical time series of N-wave tsunami measured the probe locations P1, P2 and P3 are shown in Figure 9(a) to (c), respectively. It can be observed that the tsunami height increases as it propagates from deep ocean to continental shelf and reaches the shore. The tsunami profile after initial splitting is found to be undisturbed till it reaches the continental shelf. However, the tsunami profile at the shore shows higher crest and lower trough as seen in Figure 9(c).
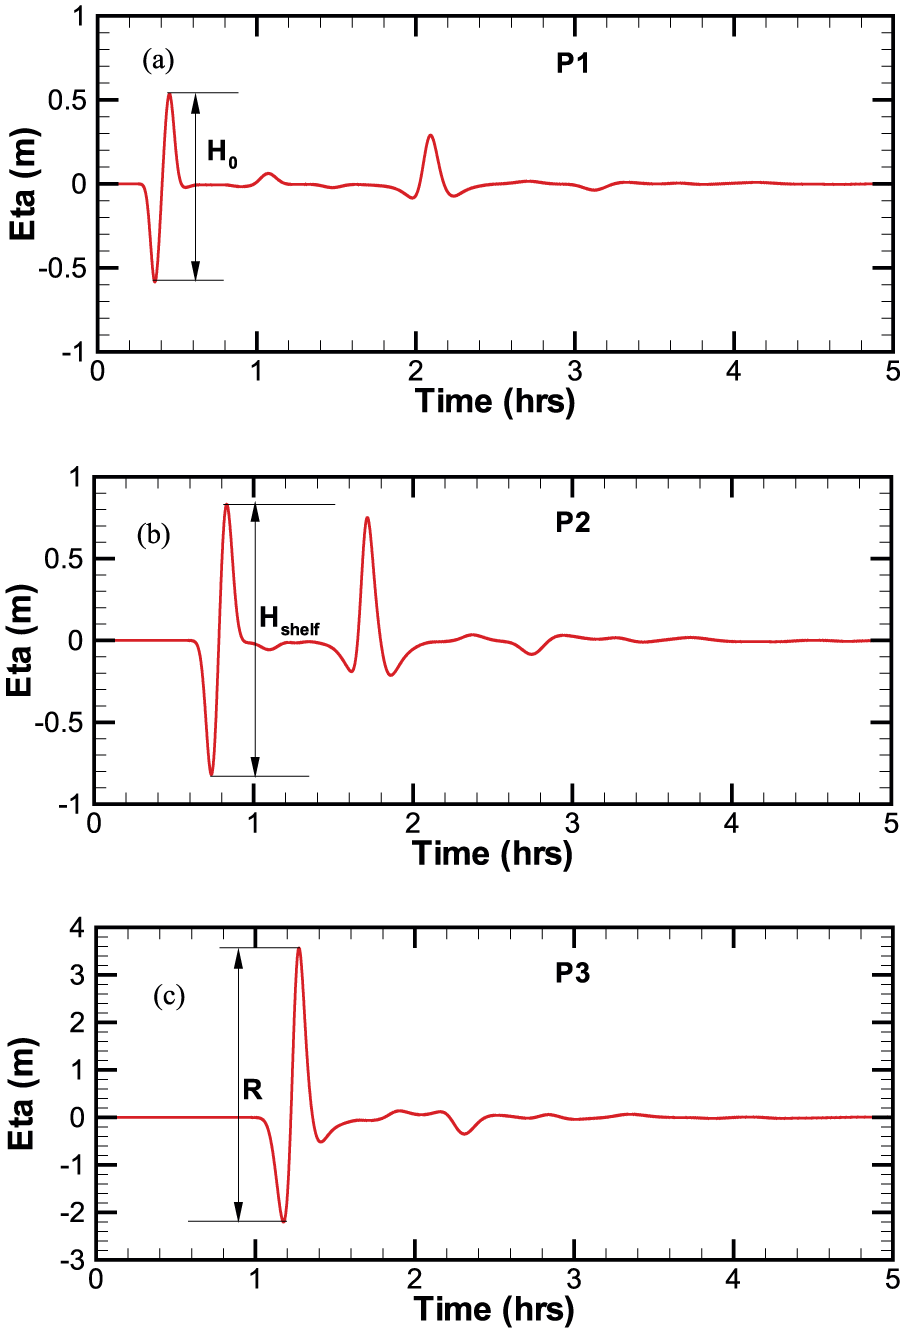
Typical time series of N-wave tsunami: (a) at the probe P1, (b) at the probe P2 and (c) at the probe P3.
The effect of continental slope is observed by the probe at location P2 with a specified continental shelf depth. The continental shelf depth varies from coast to coast. Thus, the simulations were carried out for four different continental shelf depths (50, 75, 100 and 200 m). The simulations were carried out for different slope and continental shelf depth combinations. The tsunami height (H0) is measured at probe P1 and is considered as incident wave height to ride over the continental slope. The tsunami height (Hshelf) is measured at probe location P2 after shoaling over the continental slope. The measured values of Hshelf on the continental shelf are plotted with respect to continental slope in terms of normalized tsunami height (ratio of tsunami height on the continental shelf (Hshelf) and incident tsunami height (H0)) as shown in Figure 10. The results show that the tsunami height on continental shelf is lower for steeper slope in comparison to flatter slope. This shows that, as the continental slope becomes flatter, more energy is transmitted to the shelf and higher tsunami height is observed. It was observed that, as continental slope varies from steep to flat, Hshelf/H0 decreases up to a continental slope of 1:5 and then increases (Figure 10). Thus, the shelves facing nearly 1:5 continental slopes will encounter minimum tsunami height.
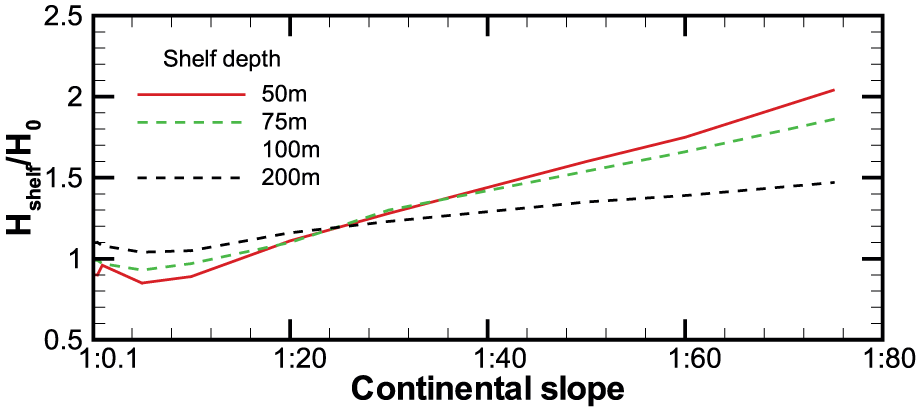
Normalized tsunami heights on continental shelf for different continental shelf depths.
It is also observed in Figure 10 that with decrease in continental slope from steep (1:0.1) to flat (1:75), for 50-m shelf depth, Hshelf/H0 value varies from minimum (0.85) at 1:5 slope to maximum (2.04) at 1:75 slope. The difference between the minimum and maximum value is 1.19 with approximate difference of 144%. At the same time, for 200-m shelf depth, Hshelf/H0 varies from minimum (1.04) at 1:5 slope to maximum (1.47) at 1:75 slope. The difference between the minimum and maximum value is 0.43 with difference of approximately 43%. It shows that, even though Hshelf/H0 is high for higher shelf depths for steeper slopes, the percentage increase in Hshelf/H0 reduces with decrease in continental slope from steep to flat.
Although the tsunami height in the continental shelf has been obtained, the resulting near-shore tsunami run-up (RN) is more important to the coastal community. The run-up is defined as the maximum vertical height of tsunami measured from crest to trough at the shore. The recorded values of near-shore tsunami run-up (RN) are plotted with respect to slope in terms of normalized maximum run-up (ratio of tsunami run-up at the shore (RN) and incident tsunami height (H0)) as shown in Figure 11. The RN values are recorded at probe location P3 and analysed for 50-, 75-, 100- and 200-m-depth continental shelves, and the results are shown in Figure 11. It is observed that for a particular water depth on the shelf, if the continental slope is steep, higher amount of energy will be reflected back, which results in smaller tsunami height on the shelf. On the contrary, for a flatter slope, the reduced reflection and effect of shoaling will lead to increase in tsunami height. But, as the tsunami moves towards the shore, its height is amplified. This is due to the shoaling effect while the tsunami rides on near-shore slope. It was observed that for 50-m shelf depth, as the continental slope varies from steep (1:0.1) to flat (1:75), RN/H0 decreases to a minimum (2.08) up to a continental slope of 1:5 and then reaches to maximum (4.2) at 1:75 slope. The difference between minimum and maximum value is found to be 2.12 with around 102% increase. Whereas, for 200-m shelf depth, RN/H0 decreases to a minimum value of 3.86 up to a continental slope of 1:5 and then increases to a maximum value of 5.18, the difference between minimum and maximum value is found to be 1.32 with around 34% increase, which is three times less than that for 50-m shelf depth. However, a higher continental shelf depth leads to overall higher RN/H0 (Figure 11). In this study, higher continental shelf depth has steeper near-shore slope. Thus, for a higher continental shelf depth, the momentum transmitted to the shelf is higher. At the same time, the transmitted energy will have higher dissipation while tsunami rides over steep slope. Similarly, for shallow continental shelf, less energy is transmitted and less energy is dissipated on the near-shore slope.
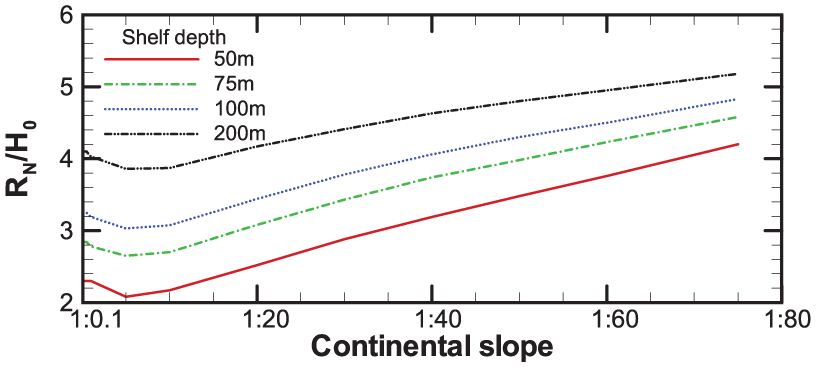
Normalized maximum run-up at the shore for various continental slope over different continental shelf depths.
Conclusion
This study was carried out by developing a 1D numerical model using SWE to study the effect of continental slope on tsunami characteristics. The model was validated with Kowalik et al. (2006) with good agreement. This model was applied to study the effect of typical continental slopes present along the Indian coast on tsunami run-up. A total of 10 cross-sections along the Indian coast were considered by covering all possible types of slopes (steepest as well as flattest). The continental slopes vary from 1:7 to 1:63.7 along these cross-sections. A systematic study was carried out for better understanding of the effect of continental slopes on tsunami with slopes varying from 1:0.1 to 1:75.
The results show that the tsunami height on continental shelf is lower for steeper continental slope in comparison to flatter slope. This shows that as the continental slope becomes flatter, more energy is transmitted to the shelf and higher tsunami height is observed. It was observed that as continental slope varies from steep to flat, Hshelf/H0 decreases up to a continental slope of 1:5 and then increases. However, this rate of increase in Hshelf/H0 value decreases for higher continental shelf depths as continental slope becomes flatter. As continental slope becomes flatter, the percentage increase in Hshelf/H0 is high (144%) for 50-m shelf depth and low (43%) for 200-m shelf depth. It was observed that for 50-m shelf depth, as the continental slope varies from steep (1:0.1) to flat (1:75), R/H0 increased around 102%, whereas for 200-m shelf depth, R/H0 increased around 34%, which is 1/3 times that for 50-m shelf depth. However, a higher continental shelf depth leads to higher R/H0. However, a two-dimensional (2D) model with inclusion of nonlinearity to consider splitting of tsunami during its propagation is needed for actual tsunami simulations.
Footnotes
Funding
The author(s) received no financial support for the research, authorship and/or publication of this article.