
Abstract
When considering deployment of wave energy converters at a given site, it is of prime importance from both a technical and an economical point of view to accurately assess the total yearly energy that can be extracted by the given device. Especially, to be considered is the assessment of the efficiency of the device over the widest span of the sea-states spectral bandwidth. Hence, the aim of this study is to assess the biases and errors introduced on extracted power classically computed using spectral data derived from analytical functions such as a JONSWAP spectrum, compared to the power derived using actual wave spectra obtained from a spectral hindcast database.
Introduction
When considering deployment of wave energy converters (WECs) at a given site, it is of prime importance from both a technical and economical point of view to accurately assess the total yearly energy that can be extracted by the given device.
An efficient way of optimizing the power extraction is to design the system and, if necessary, the associated control procedure (Falnes, 2007) so that its response is efficient and optimal over the widest span of the sea-states spectral bandwidth (Babarit et al., 2011; Saulnier et al., 2011). Hence, in order to correctly design and optimize such a device, a proper description of the actual spectral wave energy distribution within sea states should be taken into account, especially in areas with wave climates dominated by complex sea states.
Assessment of the extractable power
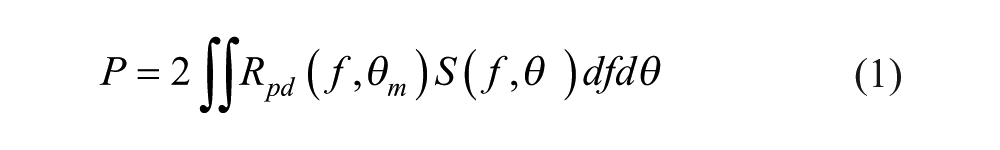
Typically, the power harvesting capacity of a WEC is characterized by its power transfer function Rpd(f,θ), which can be reduced to Rp(f) when considering an omnidirectional device. The available wave power for a given sea state and its spectral content is described by the wave energy spectral density S(f,θ), or the omnidirectional spectrum S(f), so that the extracted power can be computed as
for a unidirectional device, or as

for an omnidirectional device.
For the purpose of this study, rather than using the transfer function of a specific WEC, we built a transfer function based on the modeling of a generic heaving device having a vertical axis of symmetry and corresponding to an omnidirectional point absorber (Falcão, 2010).
The transfer function depicted in Figure 1 shows a spectral range between 0.05 and 0.33 Hz with a peak centered around (0.085–0.1 Hz).
WEC power transfer function Rp(f).
Sea-states hindcast database
According to equation (2), for estimation of extractable power by an omnidirectional WEC, a complete description of the site wave climate is necessary, which should allow an accurate characterization of the spectral energy distribution within the sea states at each time step.
We consider here the HOMERE wave hindcast database (Boudière et al., 2013), which was built with the aim of providing relevant parameters and data sets for the purpose of design studies and development of marine energy converters and more specifically of WECs. A major feature of this database built running the wave model WaveWatch III® is, in addition to the extensive set of available global parameters such as significant wave height, periods, and directions, a set of over 100,000 omnidirectional spectra Ef(f) saved at each point of the computational grid covering the Channel and the Bay of Biscay, over the period 1994–2012 (19 years) and with a 1-hour time step.
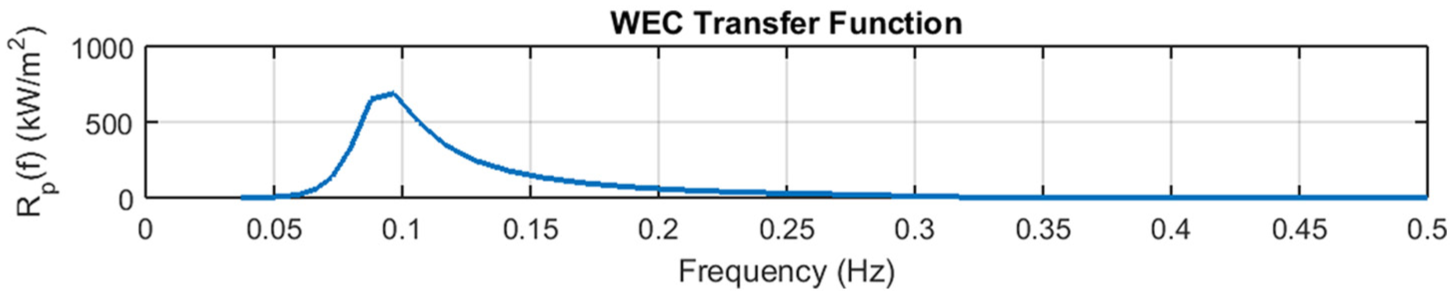
For the purpose of this study, we extracted from this database the significant wave height Hs, peak period Tp, and omnidirectional spectra Ef(f) over a period of 10 years of data at a given location in the north of the Bay of Biscay (H1 on Figure 2; 47.93°N, 5.36°W) potentially suitable for WEC deployment.
Mapping of the HOMERE high-resolution output grid.
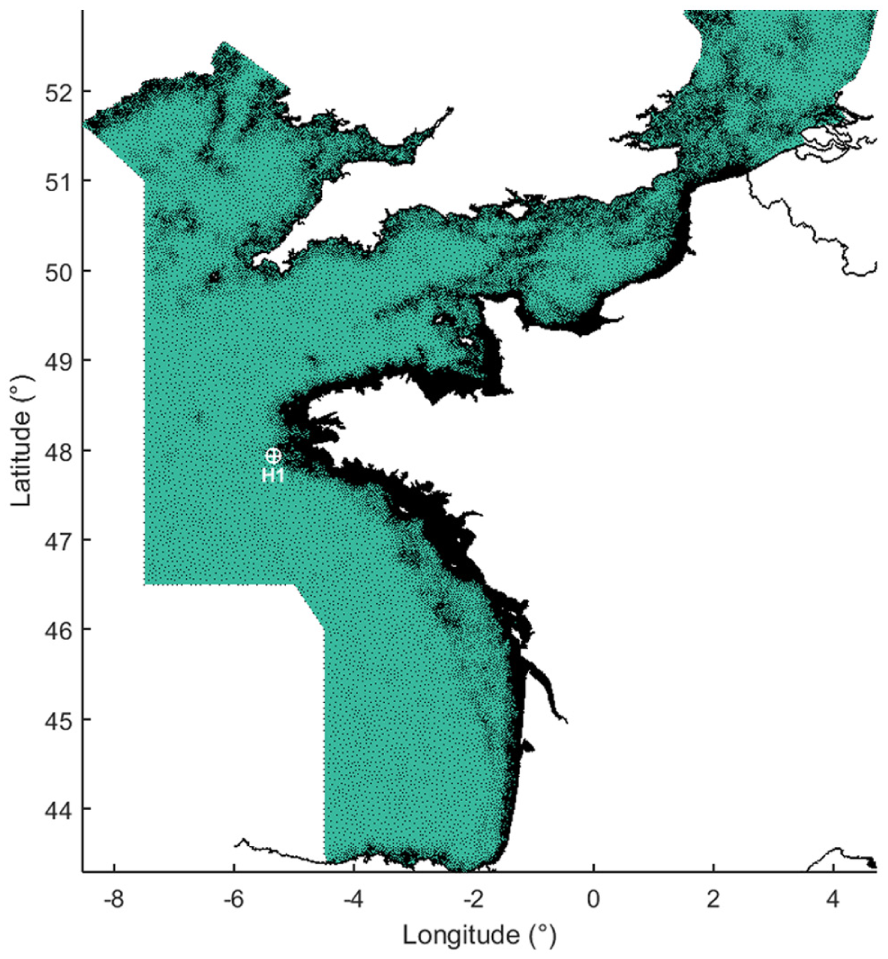
Time evolution of the significant wave height over the entire period is plotted in Figure 3, showing its variability at that location.
10-year time series of the significant wave height Hs(m) at the control point H1.
Extractable power assessment
Most available databases usually used for resource assessment only provide global parameters, from which wave spectra can be reconstructed by means of an analytical function such as the JONSWAP spectrum (Hasselmann et al., 1973). However, such formulations are suitable for the characterization of unimodal sea states, hence, cannot provide a fair description of the wave spectral energy distribution of complex sea states, superimposition of wind sea and swells, which, in areas such as the Bay of Biscay account for about two-third of the total sea states (Kerbiriou et al., 2007). Various analytical formulations have been proposed for the description of bimodal spectra (Torsethaugen, 1993; Ochi and Hubble, 1976). However, those require the knowledge of the parameters associated with each wave system constituting the sea state and databases including such partitioning parameters (Kpogo-Nuwoklo et al., 2014; Hanson and Phillips, 2001) are relatively seldom.
Hence, the aim of this study is to assess the biases and errors introduced when evaluating WEC-extracted power classically computed by means of equation (2) using spectra derived from the JONSWAP formula, compared to the power derived using actual wave spectra Ef(f) from the HOMERE hindcast database.
JONSWAP spectrum formulation requires three parameters, namely, Hs, Tp, and the enhancement factor γ. Hs and Tp were taken from the database. The last parameter γ was not available in the database and was set to the constant value of γ = 1, typically corresponding to a fully developed wind sea, with a broader frequency range.
Extractable power was computed over 10 years using the two different sets of spectra. Figure 4 provides a comparison of time series of the extractable power over a shorter period of 1 month and points out some discrepancies, the JONSWAP formulation inducing most of the time a higher level of extractable power.
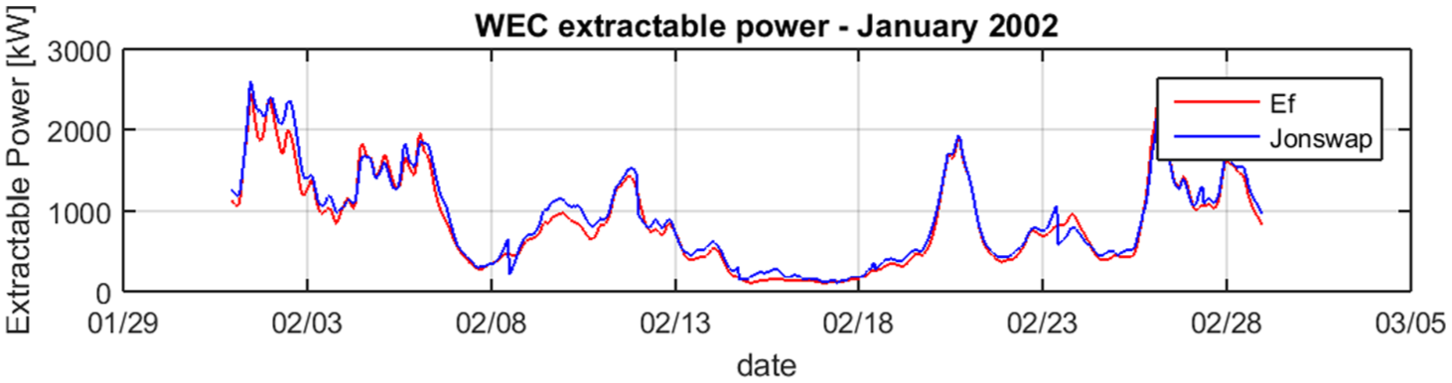
Comparison of extractable power assessed using hindcast Ef spectrum and JONSWAP spectrum for the month of January 2002.
Ratio of the extractable power estimated using hindcast frequency spectrum Ef on power estimated using JONSWAP equivalent spectrum, over 10 years, is presented in Figure 5. On average, this ratio is of 96.8% confirming the overestimation induced by the JONSWAP spectrum. This global error on the estimate of about 3% could somehow be considered negligible (except, maybe, from an economical point of view). However, this ratio shows a large variability, indicating large instant discrepancies between the two methods and indicating that the use of a simple JONSWAP spectrum as input for the computation of the extractable power can be a significant source of error.
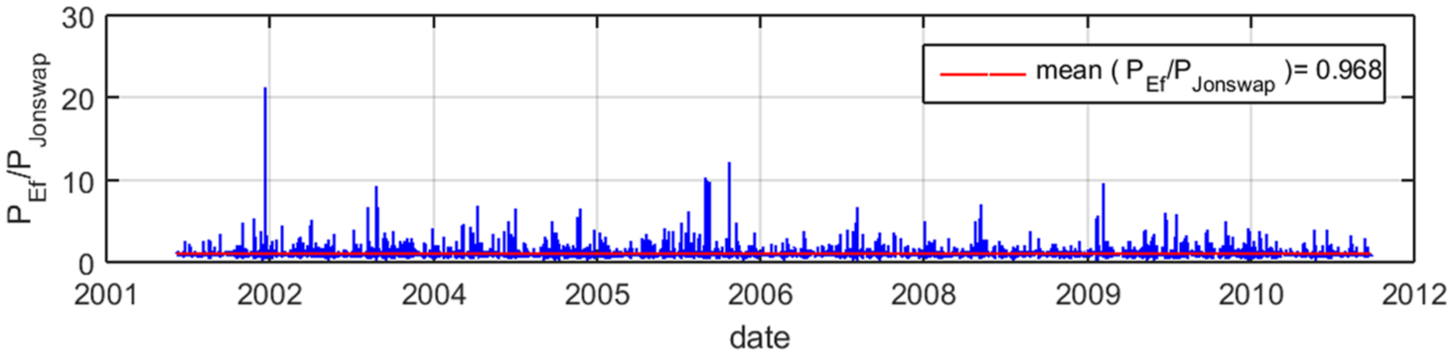
Ratio of the extractable power estimated using hindcast frequency spectrum Ef on power estimated using JONSWAP equivalent spectrum, over 10 years.
Scatter plot of extracted power assessed using JONSWAP spectrum PJONSWAP as a function of the extracted power computed using the exact spectrum Ef,
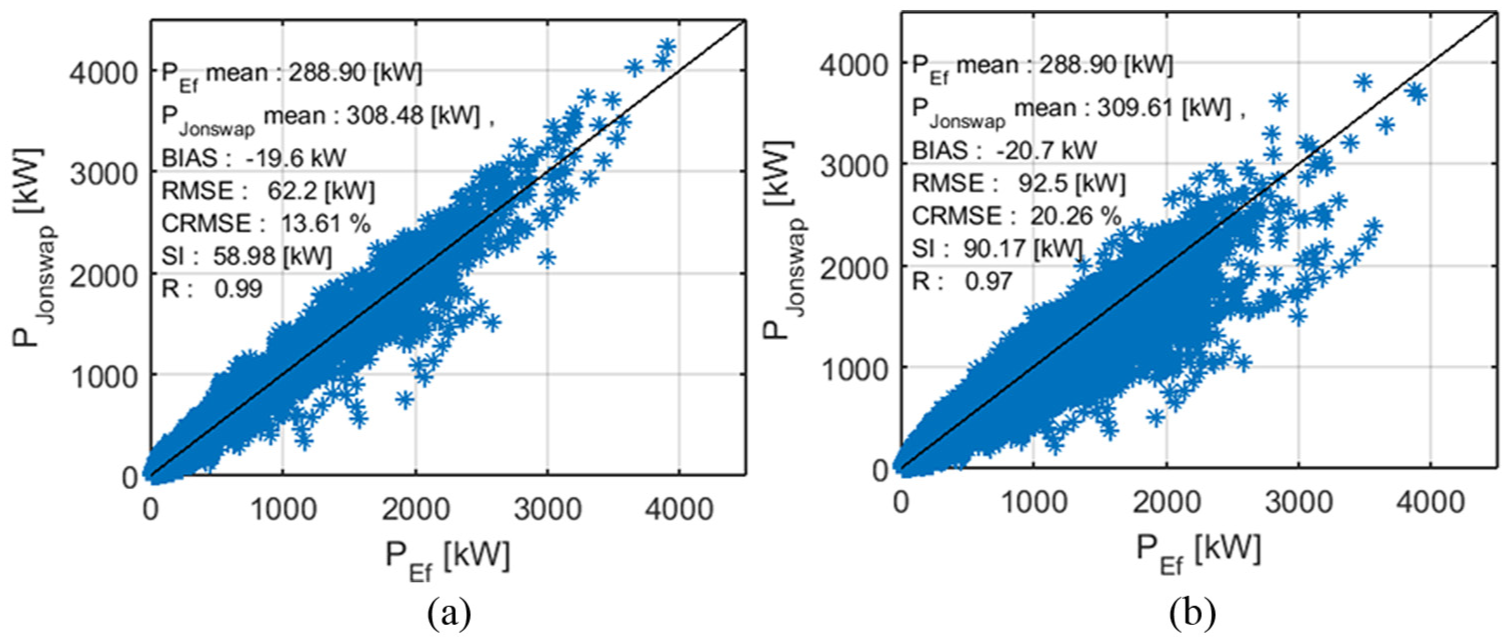
Scatter diagram of extractable power PJONSWAP as a function of
Indeed, as underlying in equation (2), the level of power to be extracted by a WEC characterized by its transfer function Rp is highly dependent on the spectral distribution of the wave energy within a sea state. Hence, the ability to accurately characterize and model this distribution at each time step is of prime importance here.
In order to analyze the observed discrepancies and the influence of the spectral shape on the power assessment, the exact and analytical spectra at three time steps are plotted in Figure 7 on which the WEC transfer function is also superimposed (after scaling for a better visibility).
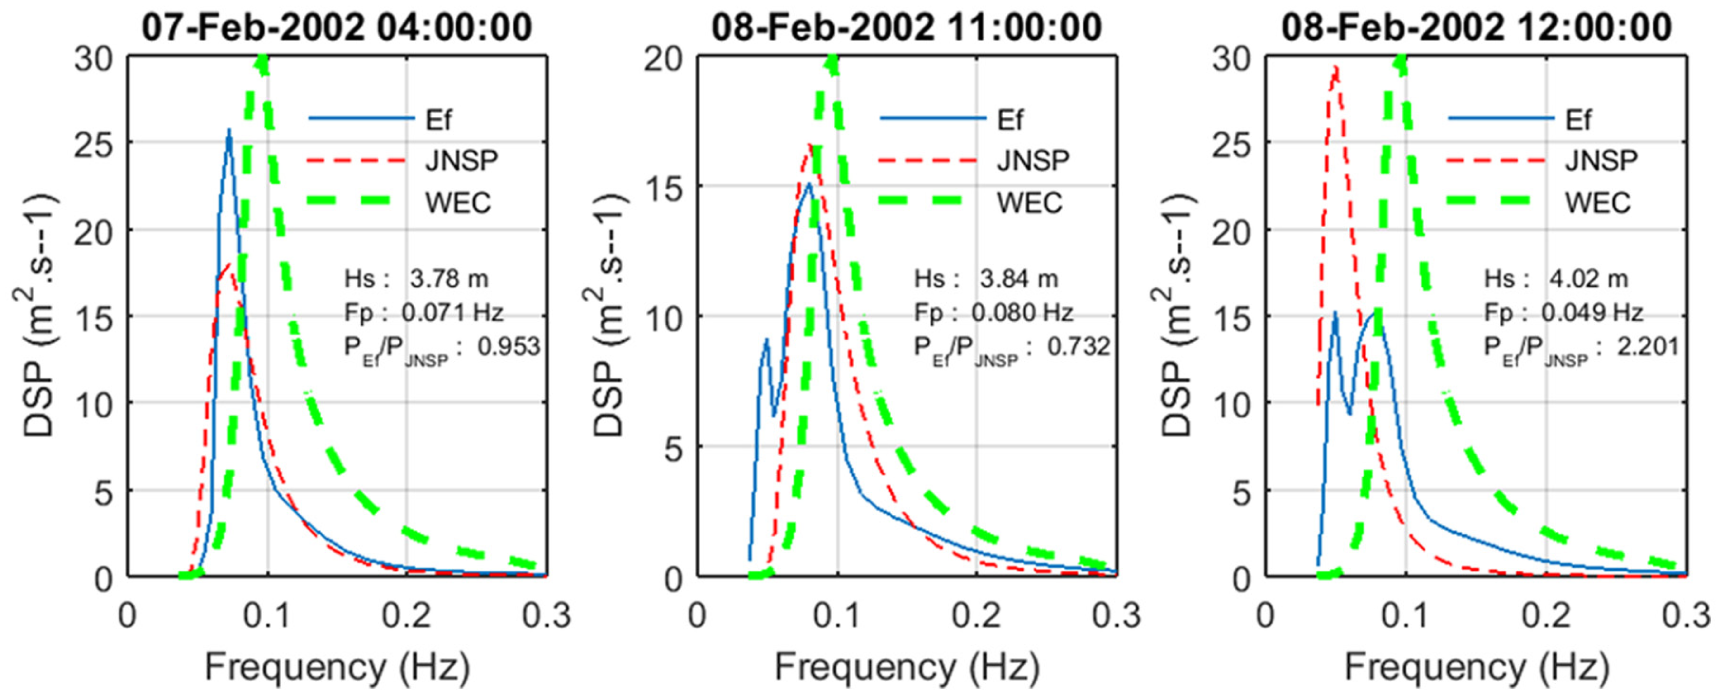
Original and JONSWAP equivalent wave spectra at various time steps.
Case corresponding to 7 February 2002 at 04:00 a.m. (left plot) corresponds to a unimodal sea state consisting of one single swell, relatively properly modeled by the JONSWAP spectrum. In that case, the error is relatively limited, less than 5%.
The second case (center plot), on 8 February 2002 at 11:00 a.m. corresponds to a bimodal sea state dominated by a primary swell with 0.08-Hz peak frequency with a low-frequency secondary swell at about 0.05 Hz. Hence, the JONSWAP spectrum is fitted to the main swell, and all the energy associated with the secondary swell is erroneously attributed to this theoretical main swell, in the range of the WEC spectral response, and hence a strong overestimation of the extracted power
The last case (right plot) takes place just 1 hour later on 8 February 2002 at 12:00. The sea state has evolved so that the low-frequency swell is now the one with the highest peak, and the JONSWAP spectrum is evaluated attributing all the energy to this peak, in the low-frequency band globally out of the range of response of the WEC. Hence, the extracted power is in that case less than half of the one computed using the exact energy distribution
As specified earlier, we have considered, for this case study, a constant value for the JONSWAP enhancement factor γ = 1 corresponding to a broad spectral energy distribution. Optimization could be conducted in the case of unimodal sea states, from which an adjusted value of γ could be identified for each sea state. However, such adjustments would not be possible or relevant in the case of multi-modal sea states. In order to assess the sensitivity of the power assessment to this parameter, equation (2) was applied using JONSWAP spectra with γ = 3.3, a value often recommended as a standard in design studies. Statistics associated with this case are given in Figure 6(b) and show a larger error, with an RMSE of about 92.5 kW and an average ratio
Conclusion
We have investigated in this study the sensitivity of WEC extractable power evaluation to the quality and accuracy of the description of the spectral energy distribution within a sea state. An omnidirectional point absorber–type WEC was considered. Comparison of extractable power estimated using an exact frequency spectrum, obtained from a hindcast database and an analytical JONSWAP spectrum show that even though the average power estimated using the latter is only slightly overestimated, large instant errors are identified. These errors are mainly due to the inability of the JONSWAP spectrum, characterized by a single set of three global parameters, to correctly account for the spectral distribution of the energy in the case of complex sea states.
Footnotes
Funding
The author(s) received no financial support for the research, authorship, and/or publication of this article.