
Abstract
The effect of water depth on the power absorption by a single heaving point absorber wave energy converter, attached to a hydraulic power take-off system, is simulated and analysed. The wave energy flux for changing water depths is presented and the study is carried out at a location in the north-west Portuguese coast, favourable for wave power generation. This analysis is based on a procedure to modify the wave spectrum as the water depth reduces, namely, the TMA spectrum (Transformation spectrum). The present study deals with the effect of water depth on the spectral shape and significant wave heights. The reactive control strategy, which includes an external damping coefficient and a negative spring term, is used to maximize power absorption by the wave energy converter. The presented work can be used for making decisions regarding the best water depth for the installation of point absorber wave energy converters in the Portuguese nearshore.
Introduction
The offshore floating devices have attracted interest due to the higher levels of annual average incident wave power that occur in deep water and the minimal topographical constraints for their deployment. An area that has not received much focus is the seabed mounted nearshore devices, where nearshore is defined as having a water depth between 10 and 20 m and is typically located at a distance of 0.5–2.0 km from the coastline. This may be due to fact that the nearshore has a lower annual average incident wave power as compared to offshore, even though the exploitable resource is often only 5%–10% less. Even though a nearshore site has a lower average incident wave power, it possesses a number of attractive characteristics. A nearshore location will reduce both the costs and power losses in the cable, which brings power back to the shore. A nearshore location will reduce the costs of installation and maintenance and also increase the plant availability by utilizing smaller weather windows for repair and maintenance. The operations and maintenance costs account for perhaps 40% of the net present cost of a wave energy converter (WEC) (Henry et al., 2010). Hence, this is a significant issue. Moreover, shallow water filters out the largest waves, potentially reducing the maximum loads required for survival, although placement within the wave breaking zone may negate this advantage and can even cause the maximum loads to increase. Balancing the costs, benefits and the available resource, it is possible to determine the ideal water depth for the installation of a wave energy device at a specific location.
In order to assess the finite depth effects, one needs to consider two aspects. First, the limited water depth wave spectrum has to be represented correctly. The existing parametric wave spectra have been derived for deep water; however, the wave characteristics are modified as they approach shallow water. Second, wave climatology database exists for many coastal areas, but typically they are obtained from measurements with floaters located at depths greater than 70 m. Therefore, it is necessary to transform the wave climatology scatter diagram from deep to shallow water depths as shown in Bouws et al. (1985).
The preliminary objective of the present work is to obtain a general overview of the wave power resource (wave power flux) reduction as the water depth reduces and then to determine the reduction in wave power extracted by a single floater WEC. The latter aspect is interesting since, on one hand, it is expected that the largest reduction of the resource occurs for the higher sea states, but on the other hand, the power production of WECs is usually limited, which means that above a specific value of the wave height, the converted power does not increase. For this reason, it might happen that the reduction of wave power flux is not so important for the annual energy production. This procedure gives the possibility to understand what might be the best operational location for a WEC at an early design stage.
With the above-mentioned objectives in mind, it makes sense to use a robust, simple and general method to represent the modification of the wave spectrum as the water depth reduces. The method has been proposed by Bouws et al. (1985) and has an additional advantage of representing average bottom topography conditions. In Guedes Soares and Caires (1995), the transformation of the offshore wave spectra to a finite depth site, using a model for spectral wave energy transfer, has been presented. This spectrum shape, named TMA, is a transformation of the Joint North Sea Wave Project (JONSWAP) offshore spectra and is considered in the present study as the most realistic spectrum to point out the loss of energy resource and power production when moving from deep water to shallow waters.
In the present study, a single floater WEC having a cone-cylinder shape as in Sinha et al. (2015b) is used as an example to quantify the loss in extracted wave power with reduction in water depth. The floater is coupled with a hydraulic power take-off (PTO) system to extract wave power. A second-order approximation model is used to represent the PTO system, with a limitation on the PTO bandwidth and the control forces. For point absorbers, it is well known that the appropriate control of the applied PTO forces can potentially increase the amount of energy extracted from sea waves. Hence, reactive control strategy has been used to maximize the power extraction, which is represented by an external damping coefficient and a negative spring term.
Finite depth spectral model
There are many wave spectra used for offshore waves in deep water, that is, when the wavelength is larger than twice the water depth. A fundamental spectrum is the Pierson–Moskowitz spectrum, which describes the wave spectra for fully developed sea or fully arisen sea (FAS), when a constant wind blowing infinitely long cannot increase the energy in the waves, but the energy transfer is balanced by dissipation. This spectrum is a one parameter spectrum completely described by the wind speed given by
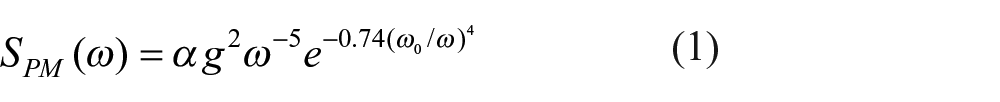
where
The two-parameter spectrum still gives too little freedom to reproduce realistic spectra of the developing sea. In 1973, Hasselmann published the five-parameter JONSWAP spectrum, which was one of the results from the JONSWAP

where
The JONSWAP spectrum is in common use for design of drilling platforms in the offshore industry because it offers more flexibility with its five parameters, and can produce realistic spectra. The parameters are then chosen from wave statistics combined with systematic parameter fitting. While the JONSWAP spectrum was originally developed for developing sea in deep water. However, the waves in shallow areas are often waves coming in from deeper areas into an area where they are affected by the limited water depth. For such cases, the modified JONSWAP spectrum in shallow water called the TMA spectrum (Transformation spectrum) is used as in Hughes (1977). It is based on the fact that low-frequency or equivalently long-period waves must have a limited height in shallow water. Therefore, the expression for the TMA spectrum is obtained by multiplying the expression for the JONSWAP spectrum with a limited depth function
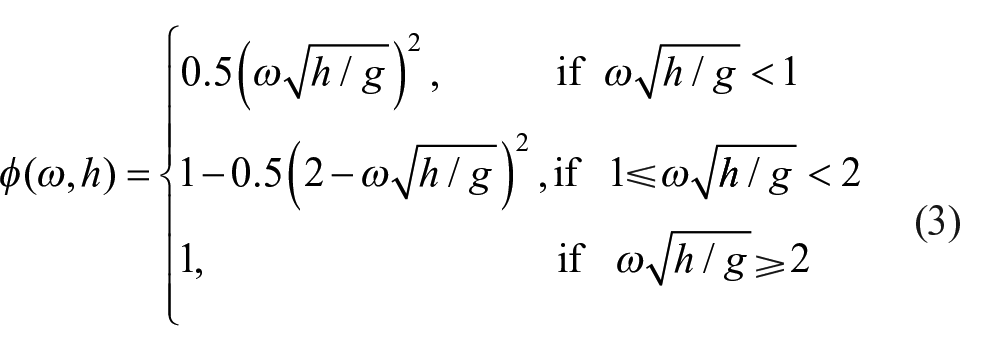
where
In Figure 1, the limited depth function is varied with respect to frequency and a similar observation follows as described above in Equation (3). Hence, the expression for the TMA spectrum is of the form
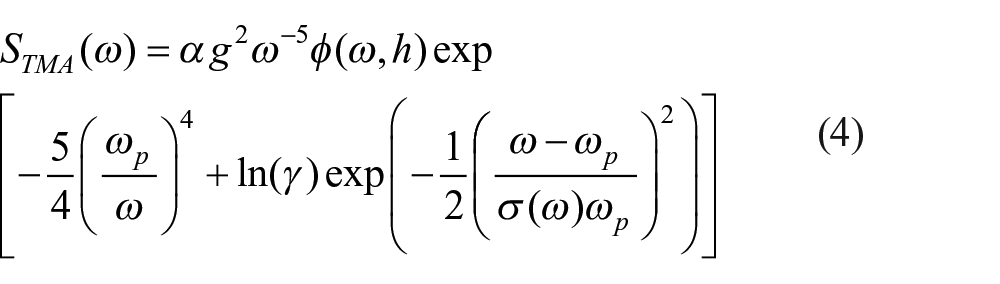
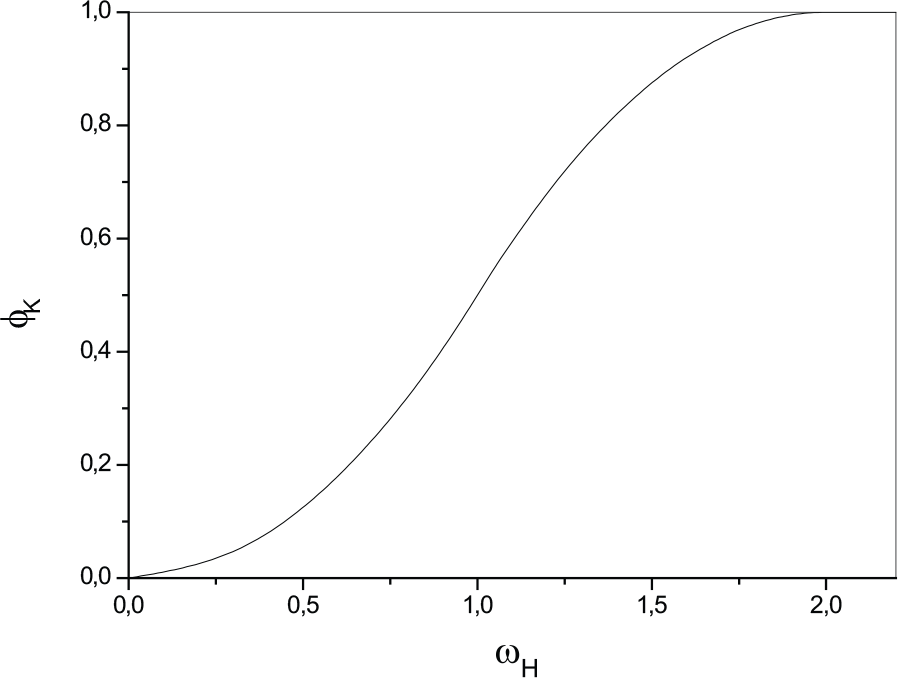
The limited depth function in the TMA spectrum.
Numerical modelling
The equation of motion of an oscillating point absorber in heave can be described by Newton’s second law as

where

The hydrostatic restoring force

where

where

The coefficients
Taking into account all the considerations, the equation of motion of a heaving point absorber, coupled with a PTO mechanism able to perform reactive control, can be re-written as
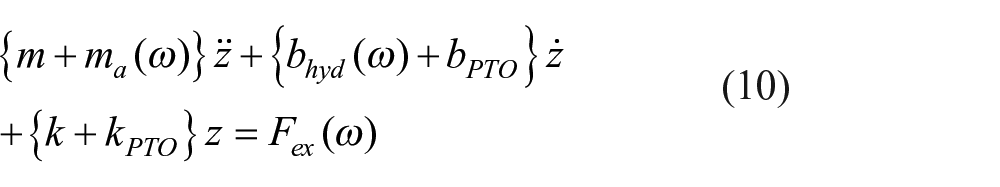
The steady solution of Equation (10) is given by
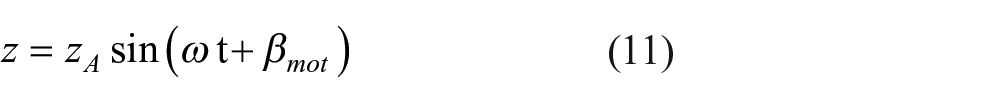
where
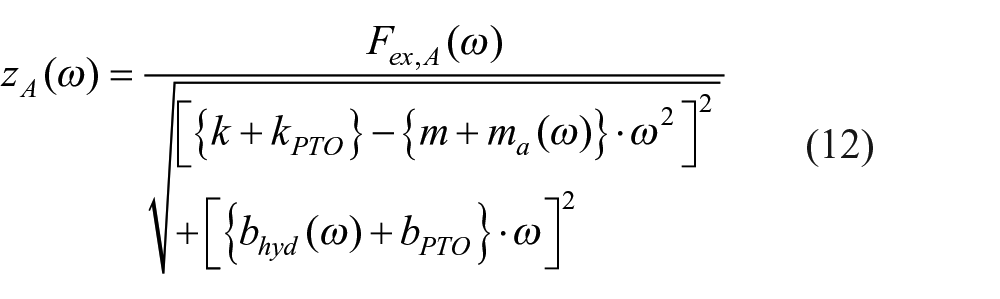
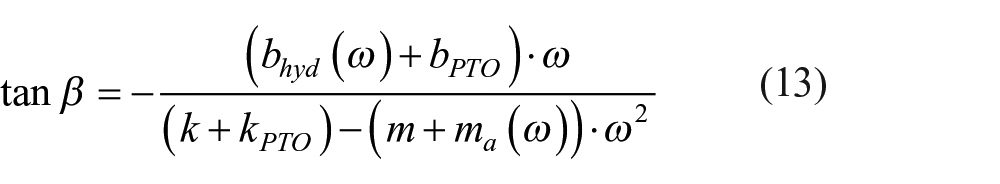
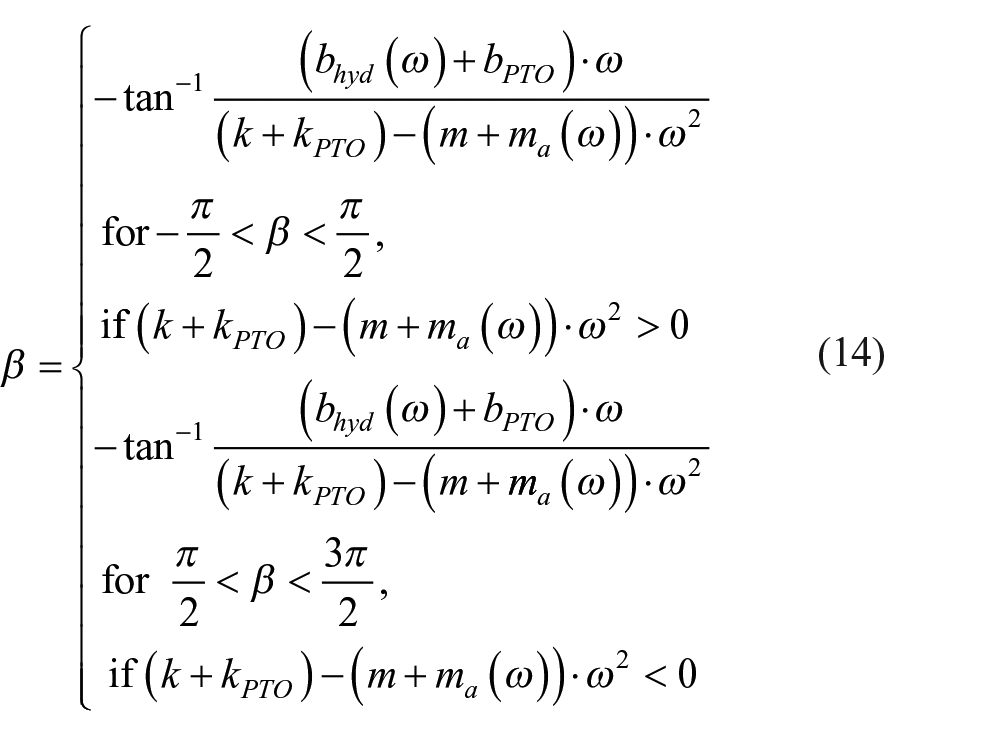

where
The average power absorbed in a regular wave is given by

By applying linear superposition of the floater responses, the total power absorption in irregular waves is obtained.
Hydraulic PTO
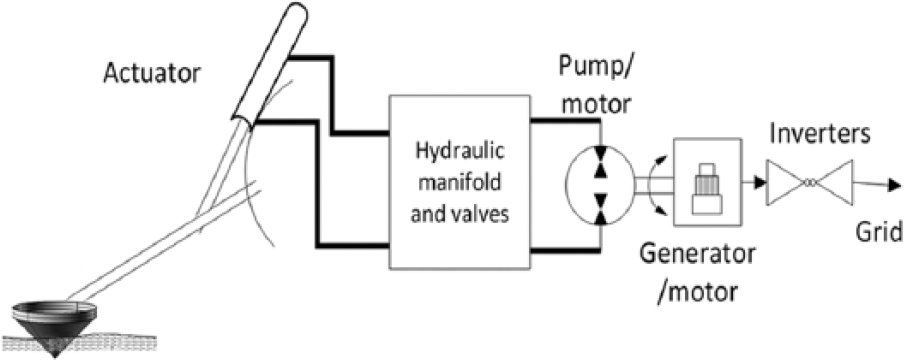
The hydraulic PTO system used in the present study is based on a hydrostatic transmission principle, which is quite analogous to the system suggested for Salter’s Duck as in Salter (1974). An illustration of the PTO is presented in Figure 2. This system consists of a symmetric cylinder operated in closed-circuit with a swash-plate variable displacement axial-piston pump/motor powering a generator. The bi-directional flow is converted to a uni-directional rotation by the closed-circuit pump/motor capable of both positive and negative swash-plate angles. This study does not cover the dynamic modelling and design of the internal control loops of the PTO. Instead, a second-order approximation of the closed loop behaviour of the cylinder-force is used as in Sinha et al. (2015a), with a PTO bandwidth of 6π rad/s and a damping factor of 0.6. The cylinder is limited to give a maximum significant force of 200 kN.
Hydraulic PTO model.
Case study
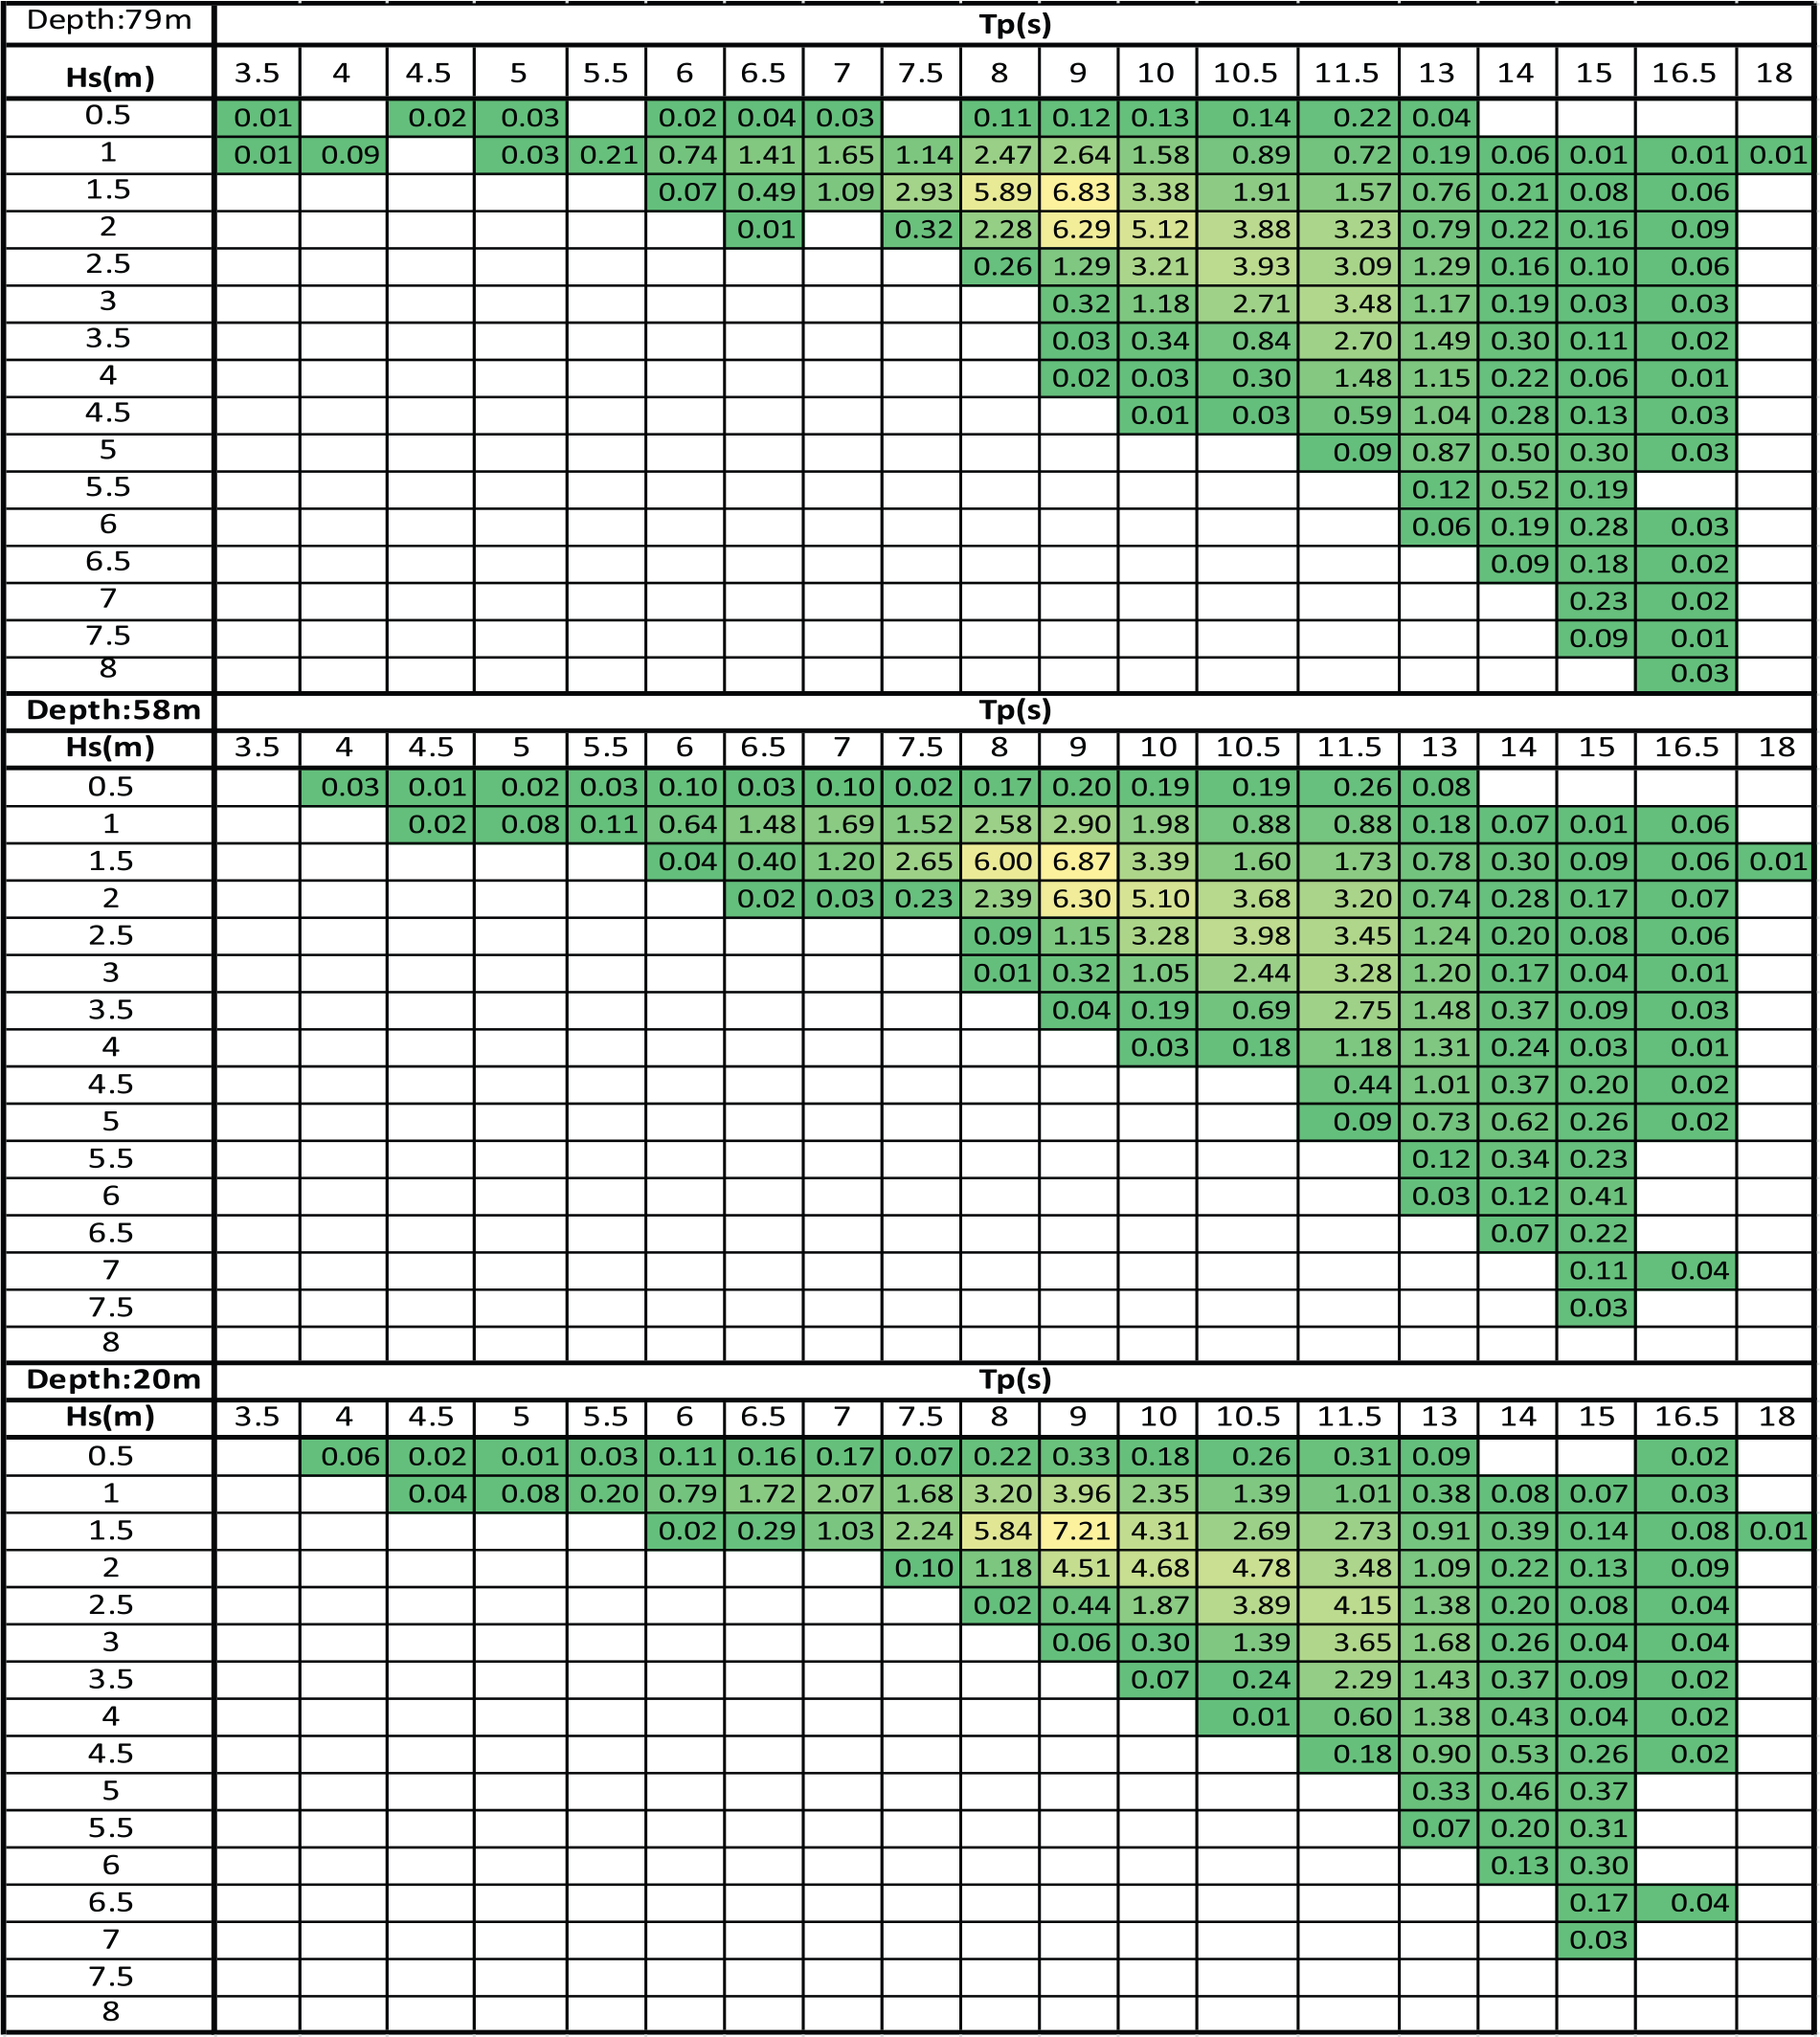
Aguçadoura wave climate scatter diagram is chosen to analyse the finite depth effects on the energy resource and capture. Aguçadoura located near Póvoa de Varzim north of Porto in Portugal is an important testing and demonstrating area for WECs. The Aguçadoura wave farm was the world’s first wave farm designed to use the three Pelamis WECs to convert the motion of the ocean surface waves into electricity. It is located 5 km offshore.
The plotted scatter diagram shown in Figure 3 is a result of statistical analysis and was generated using 3-hour consecutive significant wave height and wave period time sequences, resulting from simulations with the Simulating Waves Nearshore (SWAN) model for the entire time interval (2009–2011) as in Silva et al. (2013). The scatter diagrams shown in Figure 3 have been obtained for three different water depths of 79, 58 and 20 m, respectively. In the scatter diagram, for
Scatter diagram for Aguçadoura.
Results and discussion
Effect of water depth on the spectrum
The transformation effect on the spectral shape is plotted in Figure 4 for peak period of 13 s. It can be seen that the peak of the spectrum reduces with decrease in water depth. The graph shows a significant reduction of sea state variance as the water depth reduces to 58 and 20 m.
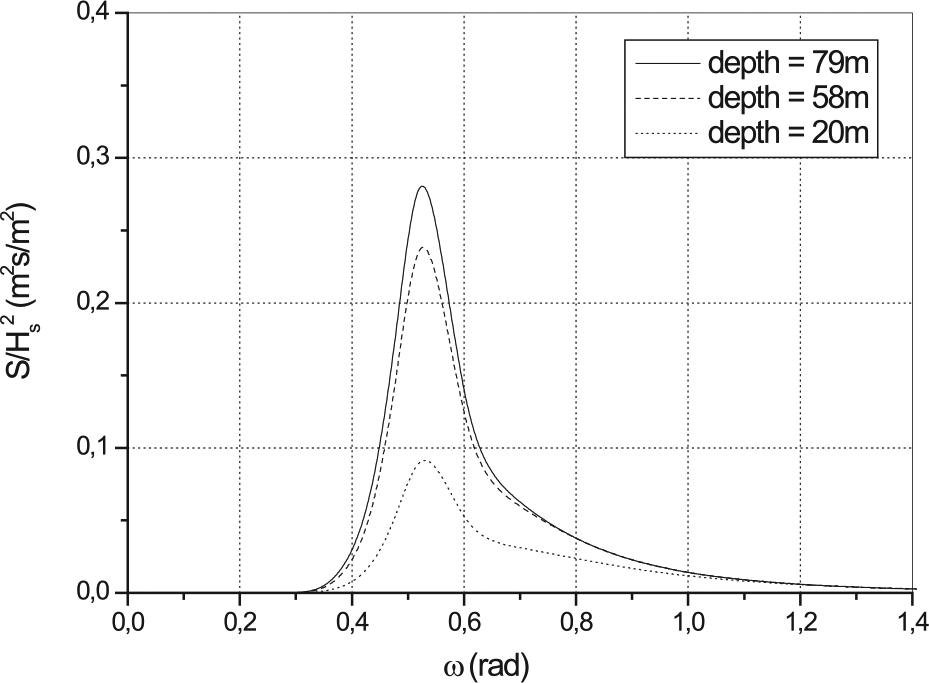
TMA spectral shape for different water depths.
Effect of water depth on significant wave height
Figure 5 illustrates the effect of water depth on the significant wave height for different peak periods of the scatter diagram. The study shows that the significant wave height reduces as the water depth decreases and the result is normalized by the deep water value
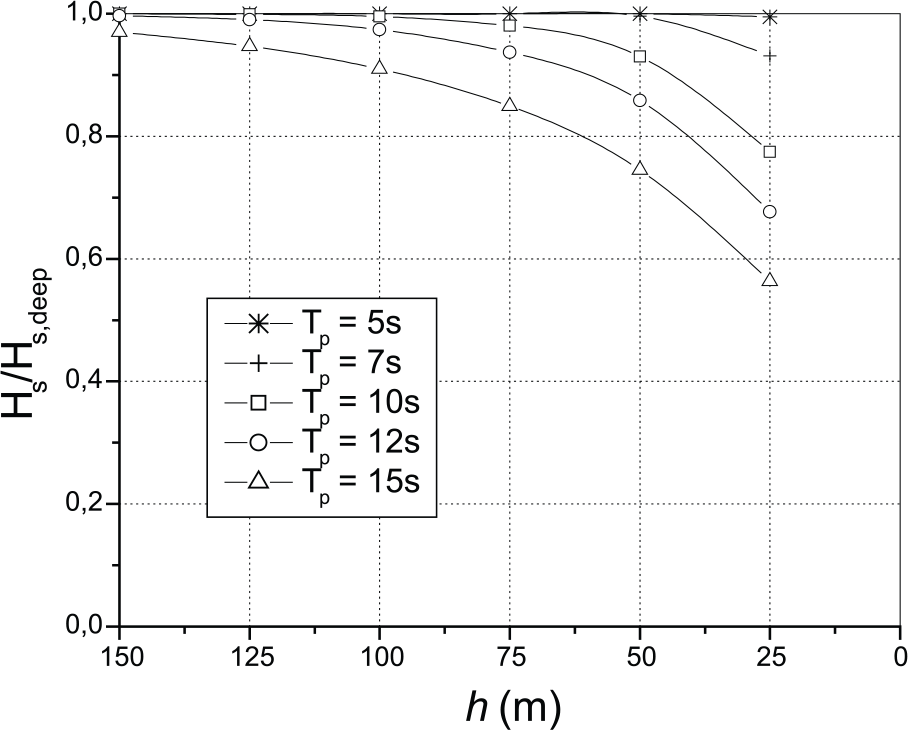
Effect of TMA transformation on significant wave height.
Effect of water depth on the scatter diagram
Due to water depth decrement, the sea states having the highest significant wave height are less probable, and on the other hand, the probability of occurrence of the sea states having lower heights is increased with limited water depth. This is the main characteristic that stands out from the three scatter diagrams as shown in Figure 3 – the classes of higher significant wave height
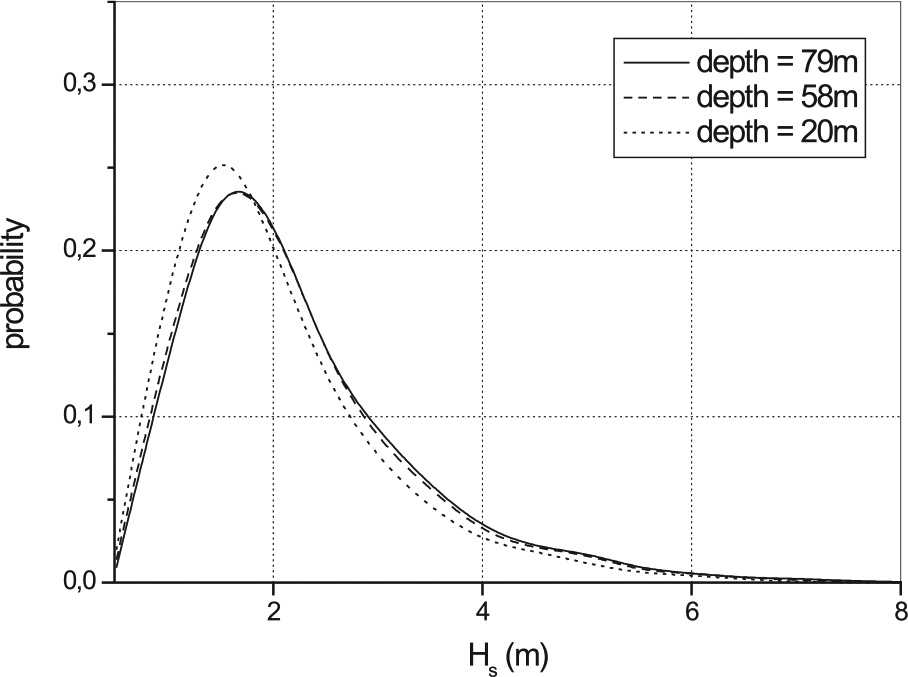
Probability distribution versus
Effect of water depth on the wave power resource
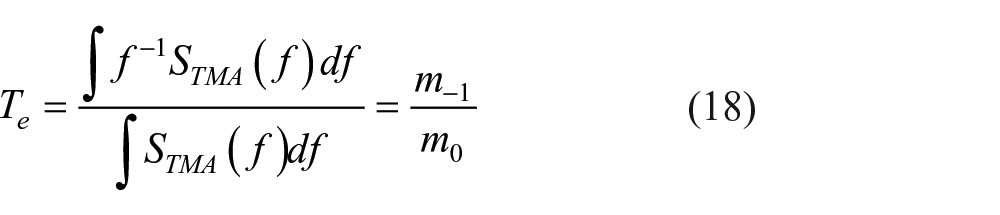
Once the new spectral shapes are calculated, it is possible to compute the effect of change in water depth on the available power resource. The available wave power resource is calculated using the expression for energy flux in deep water which is given by
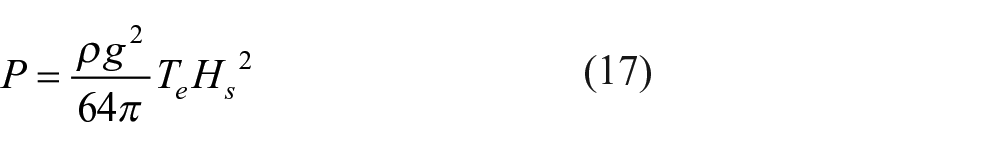
where
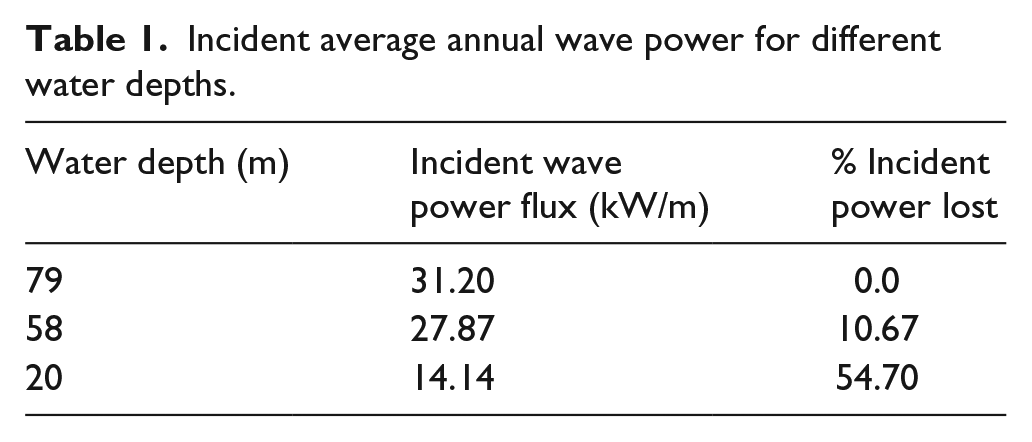
It can be seen from Table 1 that more than 50% of the available wave power is lost as the water depth changes from 79 to 20 m and around 10% is lost at 59 m depth. Hence, there is a significant reduction in the wave power resource when water depth reduces. The result is quite similar to the one obtained in Folley et al. (2006).
Incident average annual wave power for different water depths.
Effect of water depth on power absorption
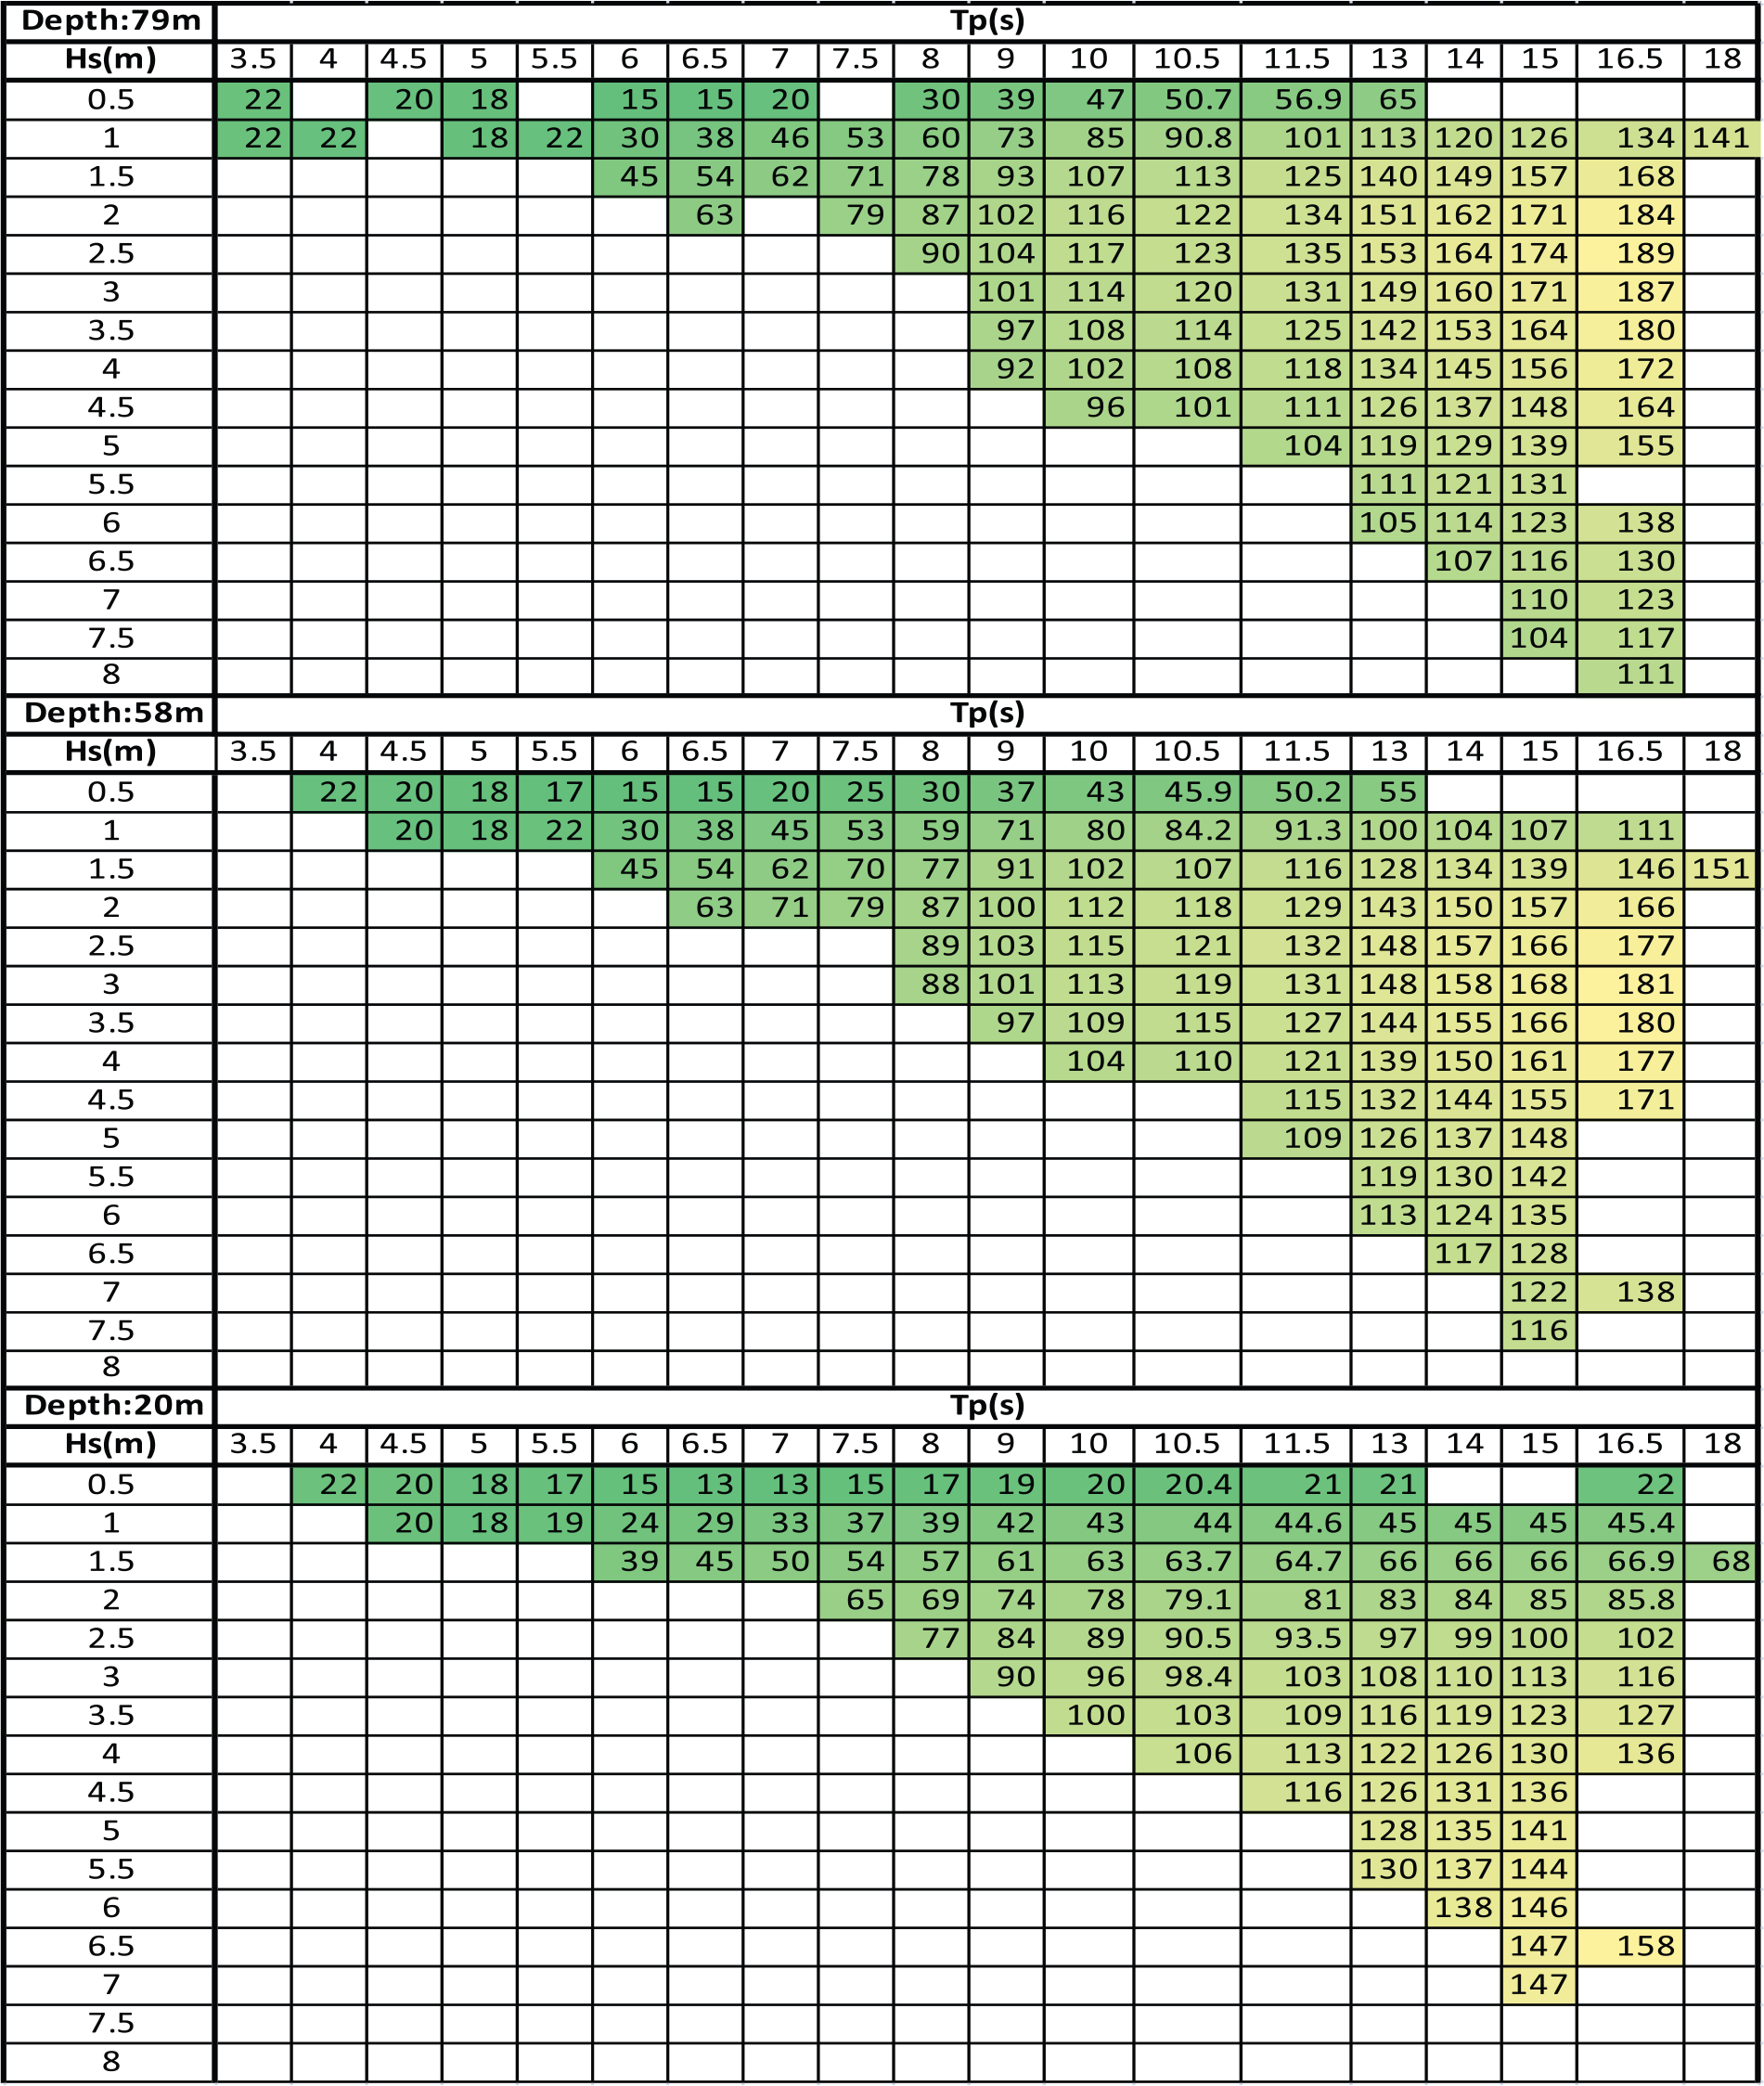
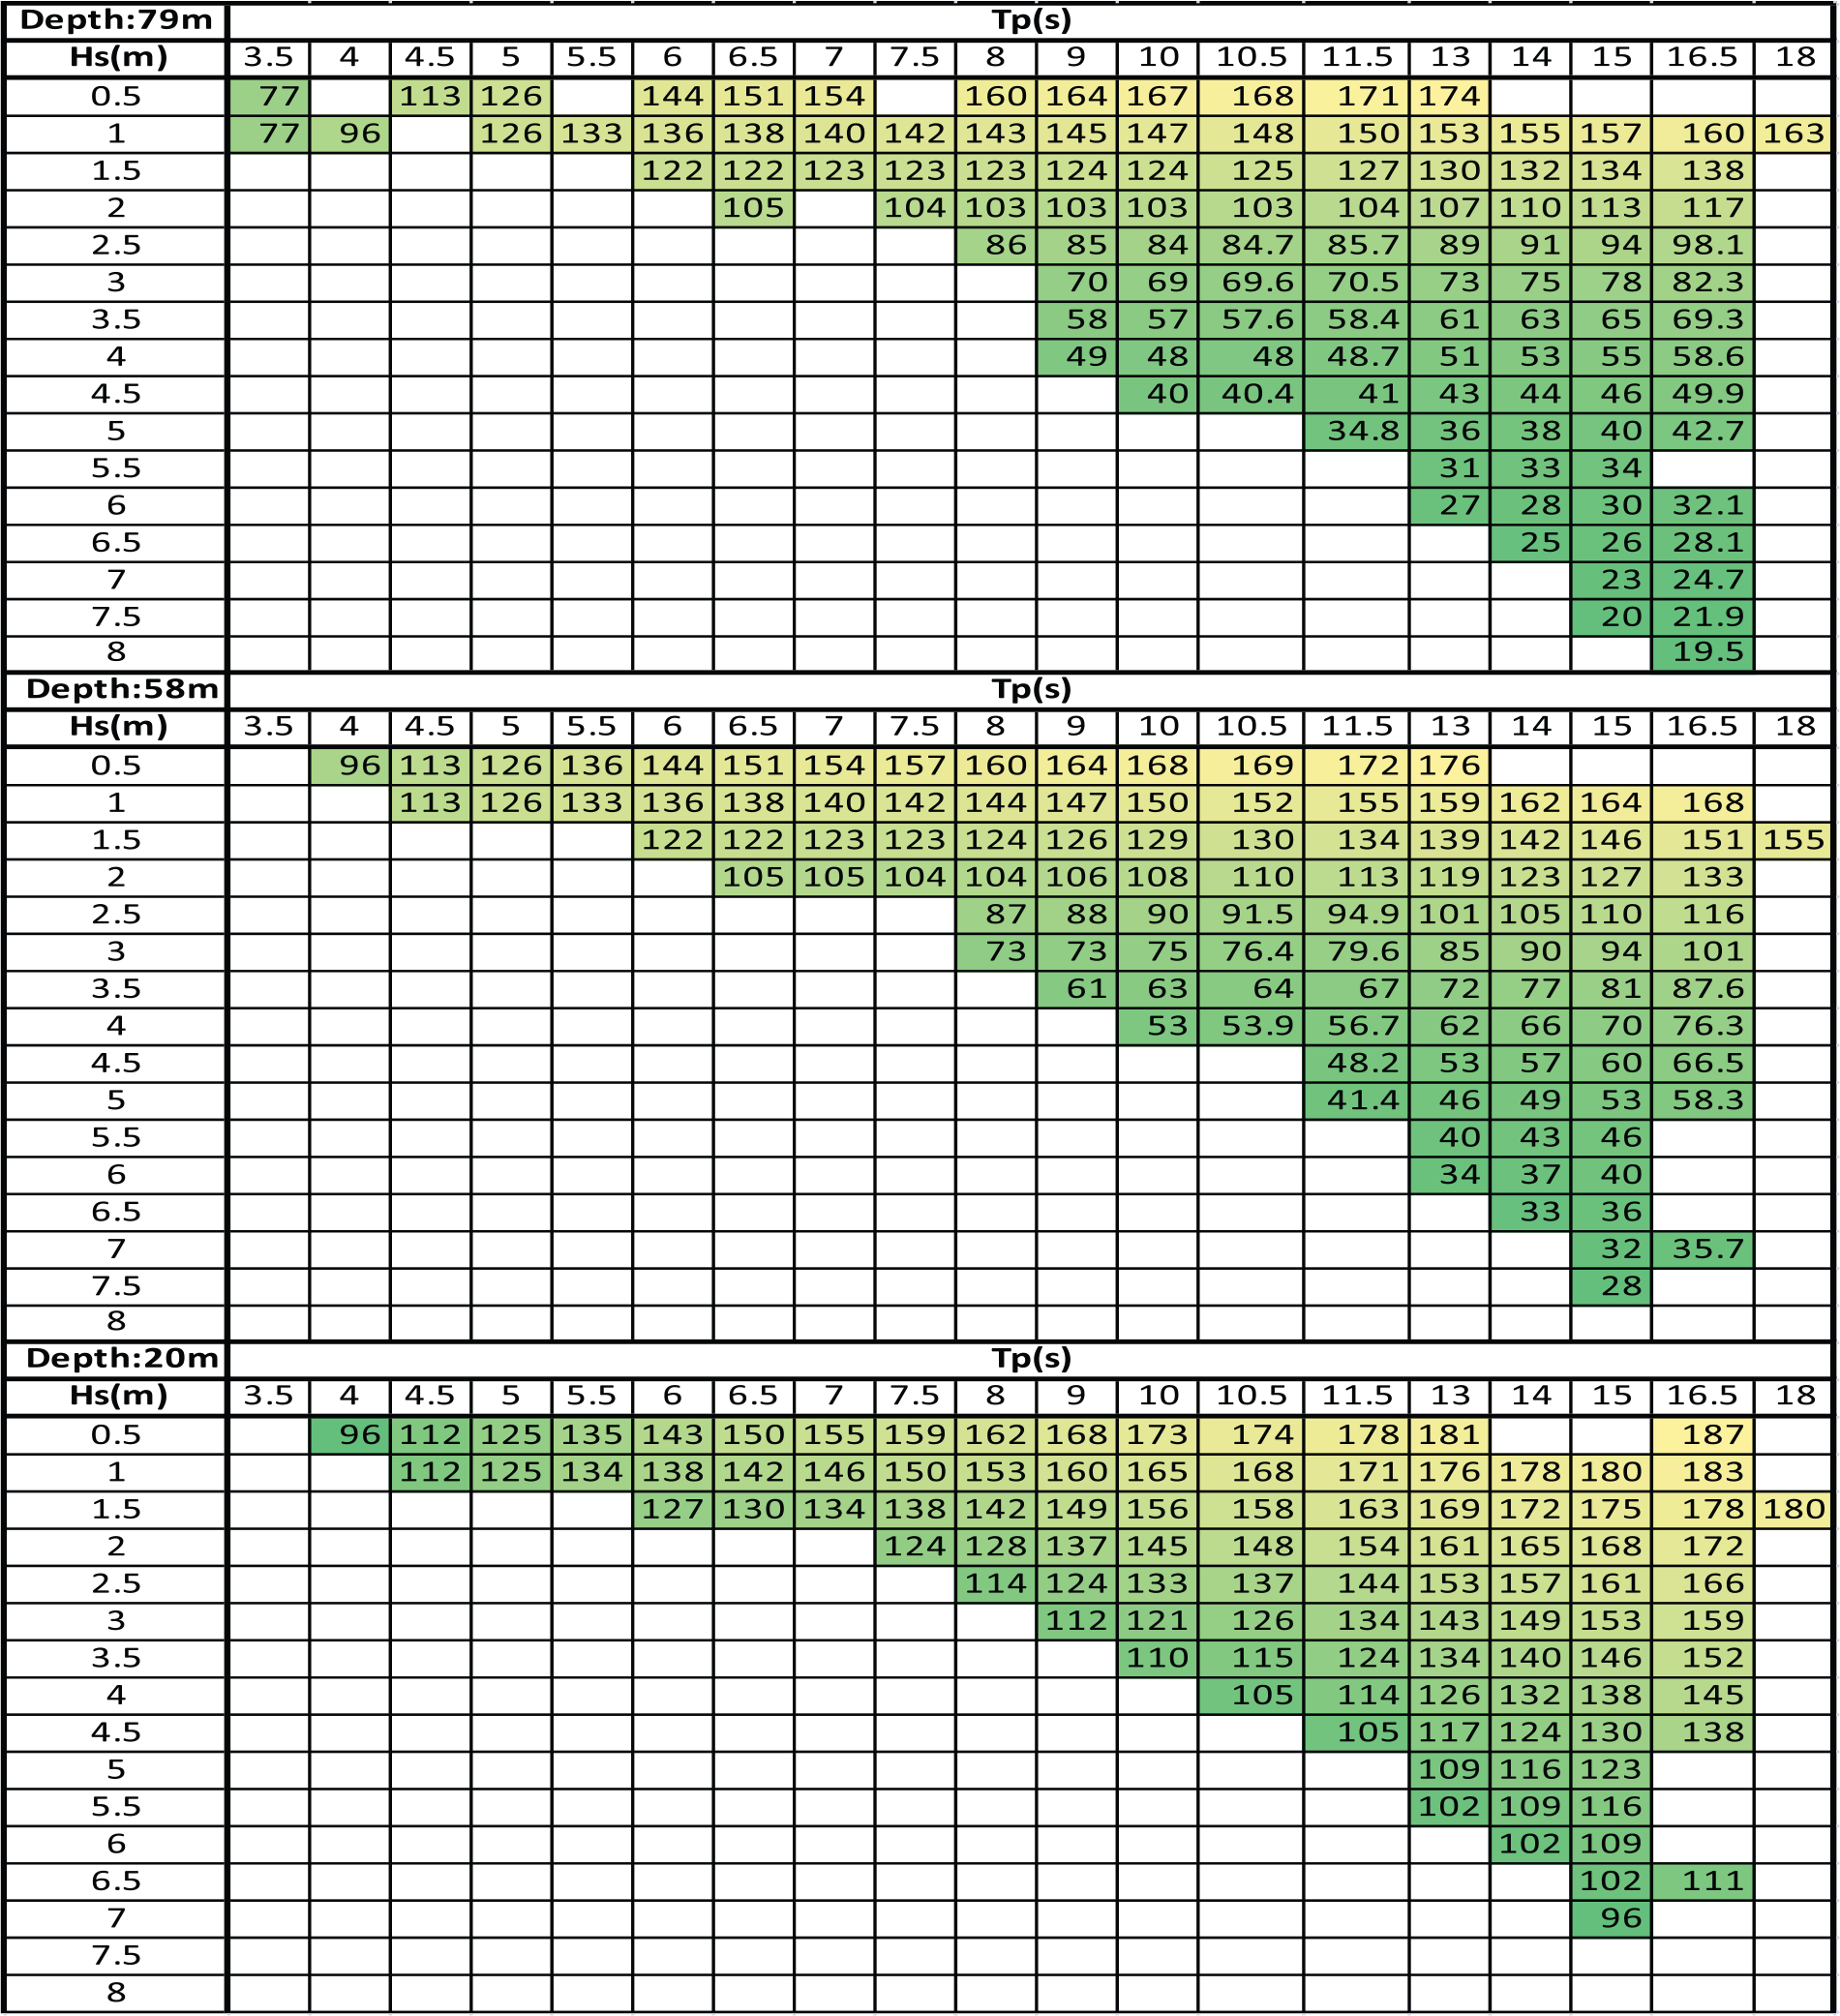
The final step is to study the effect of water depth on the wave power extracted by a heaving point absorber WEC coupled with a hydraulic PTO. The power matrices for different water depths are presented in Figure 7. The control parameters
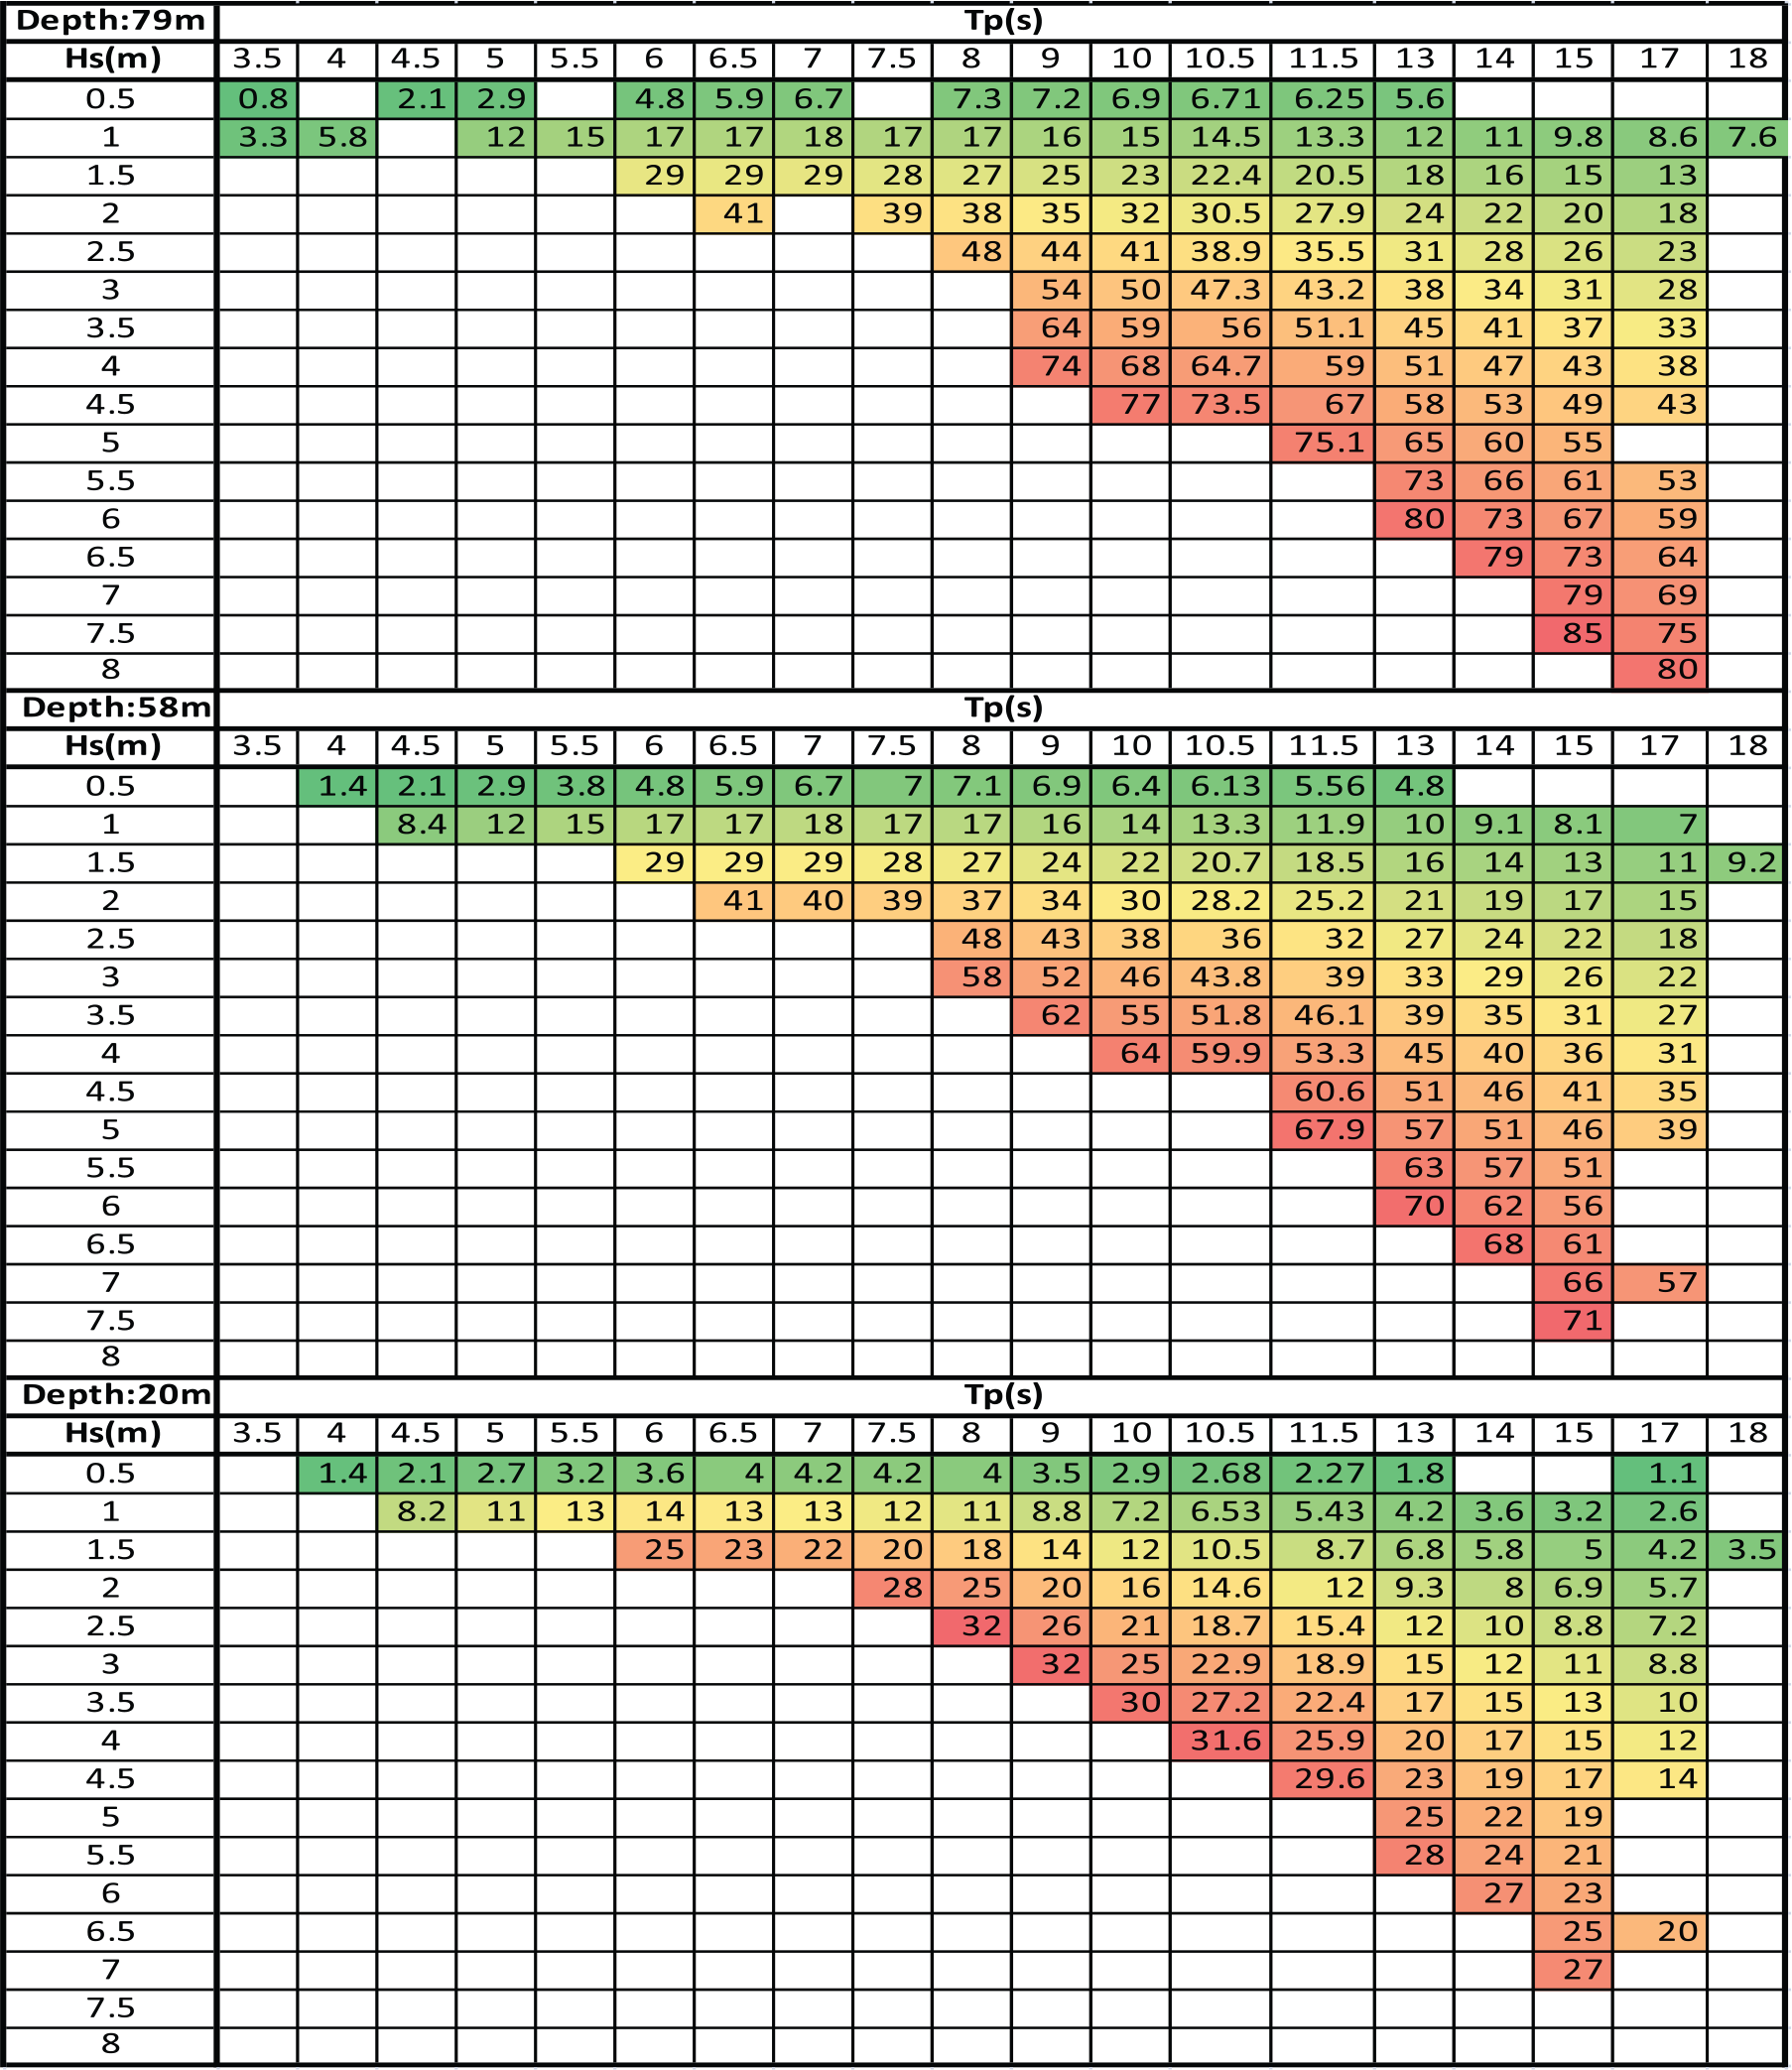
Power matrix for different water depths.
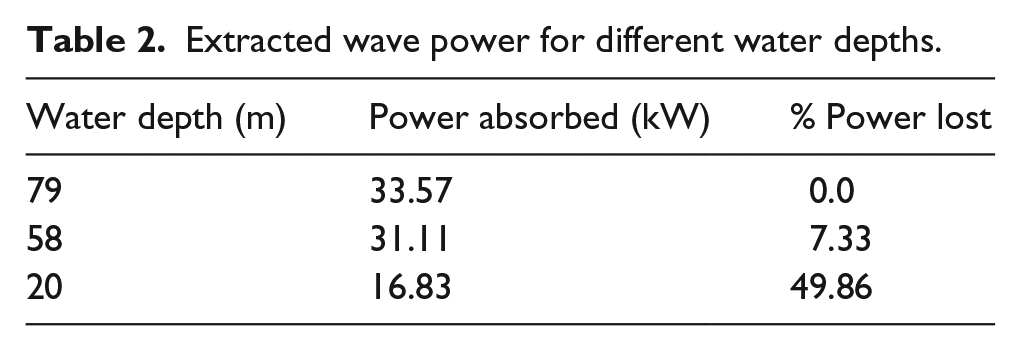
From the power matrix in Figure 7, it can be seen that there is a considerable reduction in absorbed power as we move from deep to shallow water, especially for the sea states with longer periods. The values in Figure 7 move from smaller green to moderate yellow and to larger red values. Also, it can be observed that the maximum absorbed power is distributed around different peak periods for different water depths. This affirms the importance of considering the scatter diagram for the correct water depth when designing and fine tuning the WEC. It is seen from Table 2 that around 50% less wave power is extracted at a water depth of 20 m than at 79 m. This is a significant reduction in extracted power. The power absorption reduces by around 7% on moving to a depth of 58 m.
Extracted wave power for different water depths.
The optimized values in the
Conclusion
The present study uses a simplified method to represent the wave spectrum modification as the water depth reduces, namely, the TMA method. Moreover, the effect on wave power resource as well as on the power absorbed by a heaving point absorber WEC is presented. Most of the recently proposed WECs are planned to be installed in relatively shallow water depths where the wave energy resource is reduced compared to deep water. This case study uses the annual wave statistics from Aguçadoura, located at north-west coast of Portugal. The scatter diagram representing the annual wave statistics modifies significantly as the water depth reduces from 79 to 58 m and to 20 m. Moreover, the significant wave height reduces with decrease in water depth. The consequence is that the annual wave power resource reduces by about 11% at 58 m and 55% at 20 m, on moving from a water depth of 79 m. The reactive control strategy is implemented, with optimal control parameters
Footnotes
Declaration of Conflicting Interests
The author(s) declared no potential conflicts of interest with respect to the research, authorship, and/or publication of this article.
Funding
The author(s) disclosed receipt of the following financial support for the research, authorship, and/or publication of this article: This study has been supported by the Portuguese Foundation for Science and Technology (FCT) through its annual funding to the Centre for Marine Technology and Ocean Engineering (CENTEC).