
Abstract
Background:
Relapsed ovarian cancer (ROC) presents significant therapeutic challenges, and complete resection during secondary cytoreductive surgery (SCR) has been associated with improved survival. However, the contribution of the tumor microenvironment (TME), particularly cancer-associated fibroblasts (CAFs), to surgical outcomes remains unclear.
Objectives:
This study aimed to characterize CAFs heterogeneity in ROC and identify specific CAF subsets associated with immune modulation and surgical prognosis.
Design:
A multi-platform integrative study combining spatial, single-cell, and transcriptomic analyses to investigate CAF phenotypes and their clinical relevance in ROC.
Methods:
Multiplex immunohistochemistry and spatial digital phenotyping were performed on 31 ROC samples. Single-cell RNA sequencing (scRNA-seq) was conducted on 11 tumors to define CAF clusters. Transcriptomic meta-analysis across multiple external datasets was used to evaluate prognostic significance. Spatial relationships between CAF subsets and immune cells were analyzed, and antigen-presenting CAF signatures were assessed based on marker co-expression patterns.
Results:
We identified a predominant S100A4+ CAFs population enriched in the tumor-adjacent stroma, characterized by extracellular matrix remodeling and immune-regulatory gene expression. S100A4+ CAFs displayed closer spatial proximity to T cells and were significantly associated with complete tumor resection (R0) outcomes. Furthermore, a distinct antigen-presenting subset co-expressing CD74 (S100A4+apCAFs) exhibited enhanced interaction with CD4+ T cells and was significantly enriched in R0 patients. Meta-analysis across multiple transcriptomic datasets revealed that high expression of S100A4+apCAFs-related genes correlated with improved overall survival (hazard ratio = 0.81, 95% confidence interval: 0.69–0.95).
Conclusion:
This study identifies S100A4+ CAFs—particularly the antigen-presenting S100A4+apCAF subset—as key components of the ROC microenvironment linked to favorable immune contexture and surgical outcomes. These findings highlight S100A4+apCAFs as potential prognostic biomarkers and immunomodulatory targets, offering new perspectives for personalized therapeutic strategies in ROC.
Plain language summary
Ovarian cancer is one of the most deadly cancers in women, and many patients experience relapse after initial treatment. For some of these patients, a second surgery called secondary cytoreductive surgery (SCR) can help remove remaining cancer tissue and improve survival. However, not all patients benefit equally from this surgery, and predicting who will respond best remains a major challenge. In this study, we looked closely at the tumor microenvironment, the community of non-cancerous cells that surround and interact with cancer cells. Our focus was on cancer-associated fibroblasts (CAFs), a type of support cell that can either help or hinder tumor growth. By combining advanced laboratory techniques, including multiplex immunohistochemistry, single-cell RNA sequencing, and computer-based spatial analysis, we analyzed tumor samples from patients with relapsed ovarian cancer to understand how different CAF types behave. We discovered a specific group of CAFs that express a protein called S100A4, which are found mainly around the edges of tumors. These S100A4 positive CAFs were more common in patients who achieved complete tumor removal (R0 resection) during surgery. They also showed signs of helping regulate the immune system rather than promoting cancer growth. Importantly, we identified a smaller subgroup named S100A4 positive antigen-presenting CAFs (apCAFs) that also carry a molecule called CD74, enabling them to interact with immune cells known as CD4 positive T cells. Patients with higher levels of these cells tended to have better overall survival. Our findings suggest that S100A4 and CD74 double positive fibroblasts may play a beneficial role in controlling cancer progression and could serve as promising biomarkers for predicting surgical outcomes and developing personalized therapies for relapsed ovarian cancer.
Introduction
Ovarian cancer remains the most lethal gynecological malignancy, characterized by frequent relapse. 1 Relapsed ovarian cancer (ROC) typically classified as platinum-sensitive or platinum-resistant based on the platinum-free interval (PFI), presents substantial therapeutic challenges due to tumor heterogeneity and variable biological behaviors. 2 For platinum-sensitive ROC, secondary cytoreductive surgery (SCR) significantly improves patient survival, especially when R0 is achievable.3–5 Despite predictive clinical models and advanced imaging approaches, approximately one-quarter of patients selected for SCR still fail to achieve R0.5,6 Thus, identifying robust biomarkers to improve patient selection and to better predict surgical outcomes remains a critical, unmet clinical need.
The tumor microenvironment (TME), comprising tumor cells, stromal cells, immune populations, extracellular matrix (ECM), and various secreted factors, significantly influences ovarian cancer progression and recurrence.7,8 Within this complex milieu, cancer-associated fibroblasts (CAFs) have emerged as key modulators of cancer progression, angiogenesis, metastasis, and immune regulation.9–14 Recent studies underscore the profound heterogeneity within CAF populations, as revealed by multiplex immunophenotyping and single-cell transcriptomics, indicating diverse subpopulations with distinct functional roles.15,16 Classic CAF markers, including α-smooth muscle actin (αSMA), fibroblast activation protein (FAP), podoplanin (PDPN), and S100 calcium-binding protein A4 (S100A4) highlight complex and sometimes contradictory associations with patient outcomes.17,18 For example, αSMA+ myofibroblasts are enriched in breast cancer patients with poor prognosis and can serve as a predictor of recurrence, 19 while in pancreatic ductal adenocarcinoma, αSMA+ CAFs exhibit tumor-restraining functions, and depletion of IL6 specifically from this subset can improve chemotherapy efficacy. 20 FAP+ CAFs have been linked to immunosuppression and resistance to anti-PD-L1 therapy in immunodeficient mice21,22 and can promote metastasis in pancreatic cancer. 23 However, in breast cancer, high stromal FAP shows no association with malignant features in some studies, 24 and may even correlate with longer survival in others, 25 indicating a context-dependent role. The relationship between stromal S100A4 expression and patient prognosis in breast cancer remains inconclusive.26–28 PDPN+ fibroblasts have been reported to potentially promote immunosuppression via tumor-associated macrophages in lung squamous cell carcinoma, 29 and high PDPN expression reflects poorer prognosis in gastric cancer. 30 To more accurately capture CAF heterogeneity, recent studies employ combinatorial marker profiling. A seminal study defined four CAF subsets (S1–S4) in breast cancer and high-grade serous ovarian cancer (HGSOC) based on co-expression patterns of αSMA, FAP, S100A4, PDGFRβ, CD29, and CAV1. The CAF-S1 subset, enriched in aggressive triple-negative breast cancer and mesenchymal HGSOC, was found to foster an immunosuppressive microenvironment by recruiting, retaining, and differentiating CD4+CD25+ T cells into regulatory T cells (Tregs). In contrast, CAF-S4, prevalent in non-mesenchymal HGSOC, exhibited lower immunomodulatory capacity.31,32 At the single-cell transcriptomic level, conserved subsets such as myCAFs, iCAFs, and antigen-presenting CAFs (apCAFs) have been identified, with apCAFs characterized by high expression of MHC class II-related genes like CD74. 16 Thus, dissecting CAF heterogeneity is crucial for better understanding tumor biology and identifying clinically relevant subsets that could serve as prognostic biomarkers or therapeutic targets.
To address these critical gaps, we performed a comprehensive investigation of CAF heterogeneity in the microenvironment of ROC, emphasizing the characterization of S100A4+CAFs subtype at phenotypic, transcriptional, and functional levels. By integrating multiplex immunohistochemistry (mIHC), spatial digital phenotyping, scRNA-seq, and clinical outcome data, our study underscores the unique spatial enrichment, immunomodulatory functions, and clinical relevance of S100A4+apCAFs, suggesting their critical role as potential prognostic biomarkers and therapeutic targets for personalized management of ROC.
Methods
Study design and patient samples
The reporting of this study conforms to the STROBE (Strengthening the Reporting of Observational Studies in Epidemiology) statement 33 (completed checklist provided as Table S1). Tissue samples were obtained from patients diagnosed with ROC undergoing SCR at the Department of Gynecological Oncology, Zhongshan Hospital, Fudan University. Two independent patient cohorts were analyzed: a cohort for multiplex immunohistochemistry and spatial analysis (Table S2, n = 31), and a cohort for single-cell RNA sequencing (scRNS-seq; Table S3, n = 11). Formalin-fixed, paraffin-embedded (FFPE) specimens and fresh tumor tissues were collected with written informed consent. The study protocol was approved by the Ethics Committee of Zhongshan Hospital (Approval Number B2023-048).
Inclusion and exclusion criteria for patient recruitment
Female patients aged ⩾18 years;
First platinum-sensitive recurrence of high-grade serous carcinoma;
PFI ⩾6 months;
iMODEL score ⩽4.7, indicating high likelihood of achieving complete surgical resection.
Patients with multiple prior chemotherapy regimens, second or multiple recurrences, or platinum-resistant tumors were excluded.
Hematoxylin and eosin staining
Tissues were fixed, embedded in paraffin, and sectioned (4 µm). After dewaxing and rehydration, sections were stained with hematoxylin and eosin (H&E; Seville Biotechnology, Wuhan, China), dehydrated, cleared, and mounted in neutral resin. Slides were scanned using a NanoZoomer pathology scanner (Hamamatsu, Japan).
IHC staining
Sections underwent antigen retrieval in citrate or EDTA buffer, followed by endogenous peroxidase blocking with 3% H2O2, serum blocking, and overnight incubation at 4°C with primary antibodies: αSMA (#19245, Cell Signaling Technology, Danvers, MA, USA), FAP (#ab207178, Abcam, Cambridge, UK), S100A4 (#13018, Cell Signaling Technology, Danvers, MA, USA), PDPN (#26981, Cell Signaling Technology, Danvers, MA, USA), PAX8 (#1F8-3A8, Thermo Fisher Scientific, Waltham, MA, USA), and CD74 (#77274, Cell Signaling Technology, Danvers, MA, USA). After incubation with HRP-conjugated secondary antibodies, DAB chromogenic staining was performed. Slides were counterstained with hematoxylin, dehydrated, and mounted before digital scanning (Hamamatsu, Japan).
mIHC and digital spatial analysis
mIHC was performed on FFPE tissue sections using Opal Multiplex staining kits (Akoya Biosciences, Menlo Park, CA, USA). The following primary antibodies were sequentially applied in designated panels: αSMA, FAP, S100A4, PDPN, CD74, PAX8, CD3, and CD4. Opal fluorophores were conjugated according to the manufacturer’s protocol. Nuclear staining was performed with DAPI, and slides were mounted with anti-fade medium (Beyotime Biotechnology, Shanghai, China).
Whole-slide imaging was conducted using the Vectra Polaris multispectral microscope (Akoya Biosciences). Tissue compartments—tumor nests (TN), tumor-adjacent stroma (TAS), and adjacent normal stroma (ANS)—were manually annotated. Automated cell segmentation and phenotyping were performed with the InForm software (Akoya Biosciences) using machine-learning algorithms.
Cell phenotyping and classification
Each cell was segmented and assigned a multi-marker profile. To ensure accurate identification of CAFs and account for marker non-specificity, stringent classification criteria were applied. A cell was classified as a CAF if it satisfied all of the following: (1) positivity for at least one canonical CAF marker; (2) spindle-shaped morphology consistent with stromal fibroblasts; (3) location within the annotated stromal compartments (TAS or ANS); (4) negativity for the tumor marker PAX8 and the T cell marker CD3. The analysis pipeline also enabled detection of CAFs co-expressing multiple markers (e.g., S100A4+αSMA+, S100A4+ FAP+). Quantitative outputs included cell proportions, cell density (cells/mm2).
Spatial proximity analysis
Spatial relationships between cell phenotypes were quantified using standardized spatial statistics. From the cell segmentation data, the (x, y) coordinates of each cell’s centroid were extracted to define spatial point patterns for each phenotype. A distance matrix was constructed to encode pairwise distances between cells of different types. To control for variations in cell density and to determine if observed spatial associations occurred more frequently than expected by chance, empirically derived spatial point patterns were analyzed using cross-type spatial summary functions, primarily the K-function and related metrics. These functions normalize the count of neighboring cells by the overall intensity (density) of the target cell population within the region of interest. This analytical framework, implemented using the PhenoptrReports package in R (Akoya Biosciences) and consistent with established spatial analysis methodologies for multiplex immunofluorescence data,34,35 yielded quantitative outputs including density-normalized metrics of spatial proximity (e.g., significance testing of K-function deviations) and average cell counts within defined radii (e.g., 20, 300, 500 µm).
scRNA-seq and data analysis
Fresh tumor tissues were enzymatically digested using collagenase IV (Sigma-Aldrich, St. Louis, MO, USA) and DNase I (Roche, Basel, Switzerland) to obtain single-cell suspensions. Viability and cell counts were assessed using Trypan blue exclusion. Single cells were isolated by flow cytometry (BD Biosciences), loaded onto a 10× Genomics microfluidic chip, and processed using the Chromium platform for cDNA library preparation. Libraries were sequenced using Illumina high-throughput sequencing.
Sequencing reads underwent quality assessment (FastQC), alignment to the human reference genome (GRCh38) using Cell Ranger, and generation of expression matrices (UMI counts). Data normalization, batch correction, and dimensionality reduction (UMAP) were performed using Seurat (v4.0, Satija Lab, New York, NY, USA). Cell clusters were identified based on expression signatures, and differential gene expression analyses were conducted using established statistical methods (Seurat).
Statistical analysis
Statistical analyses were performed using GraphPad Prism (v9.0, San Diego, CA, USA). Differences between two groups were compared using two-tailed Student’s t tests, while one-way ANOVA was used for multiple-group comparisons. Statistical significance was defined as p < 0.05. Data are presented as mean ± standard deviation unless otherwise specified.
Results
Spatial heterogeneity and distinct distribution of CAF subtypes in ROC microenvironment
Firstly, we assessed the expression and spatial localization of four CAF markers—αSMA, FAP, S100A4, and PDPN—in ROC specimens. Immunohistochemical staining indicated clear and robust expression of αSMA, FAP, and S100A4, predominantly localized within stromal regions adjacent to TN, whereas PDPN expression appeared more limited and exhibited a patchy or heterogeneous pattern within the stroma (Figure S1(A)).
Furthermore, H&E staining combined with mIHC clearly distinguished TN, TAS, and ANS. While mIHC revealed sparse CAFs and CD3+T cells within TN, a high density of αSMA+, FAP+, and S100A4+CAFs was predominantly enriched in TAS, suggesting spatial specificity in CAFs localization (Figure 1(a)). Quantitative analyses confirmed that the expression densities of the four CAF subtypes significantly varied across distinct tissue regions. Digital cell phenotyping identified markedly higher densities of αSMA+, FAP+, S100A4+, and PDPN+ CAFs in the TAS compared to TN (p-values: αSMA, p < 0.000001; FAP, p = 0.0014; S100A4, p = 0.0104; PDPN, p = 0.0275; Figure 1(b) and (c)). Additionally, CAF densities in TAS were also significantly higher compared to those observed in ANS, reinforcing spatially gradient expression patterns centered around tumor tissues (Figure 1(d) and (e)).
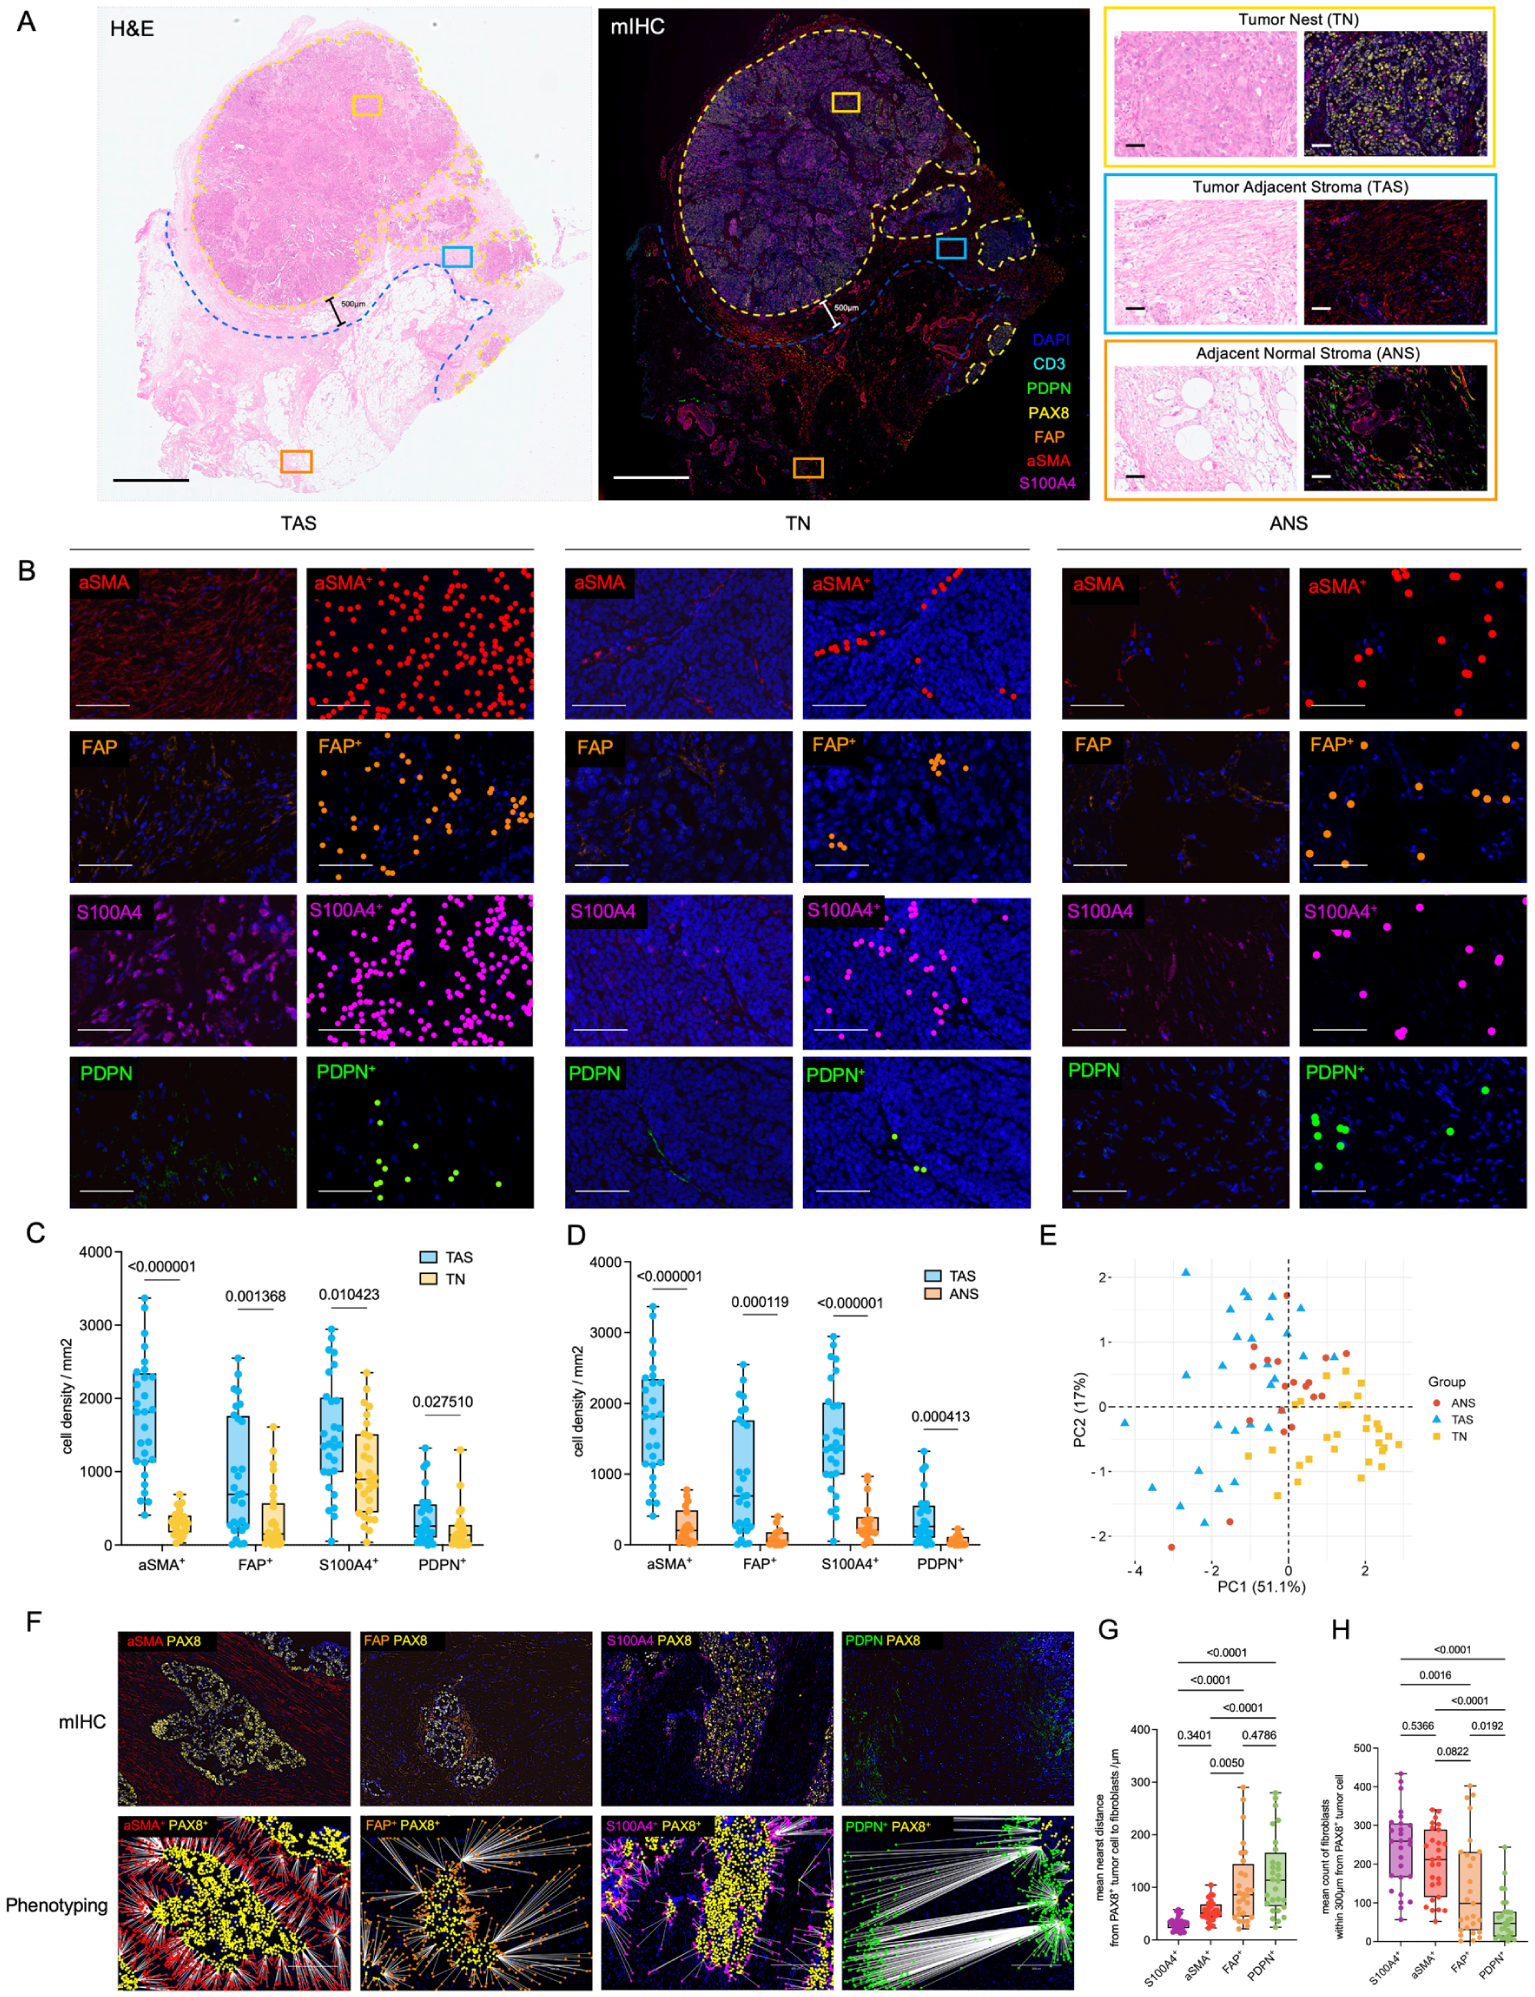
Spatial distribution and expression of CAFs in ROC tissues. (a) Representative H&E and mIHC staining in TN, TAS, and ANS. Left: Entire section overview with distinct regions indicated by dashed lines (yellow: TN boundary, blue: TAS boundary, orange: ANS; scale bars: 2 mm). Right panels show zoom-in views of the indicated regions for H&E and mIHC (scale bars: 50 μm). mIHC images indicate the distribution of cell types marked by αSMA (red), FAP (orange), S100A4 (purple), PDPN (green), CD3 (cyan), PAX8 (yellow), and nuclear staining by DAPI (blue). (b–e) CAF subtypes marker expression quantified across distinct tissue compartments. (b) Representative mIHC staining and digital cell phenotype segmentation within TAS, TN, and ANS. Left columns represent raw immunofluorescence images, and right columns indicate digitally identified positive cells for each marker (scale bars: 100 μm). Quantitative comparison of CAF subtypes (αSMA+, FAP+, S100A4+, PDPN+) densities between TN versus TAS (c) and TAS versus ANS (d) as shown in representative image (b) (n = 29 samples per group; statistical significance indicated by p-values). (e) PCA scatter plot demonstrating distinct clustering of samples based on CAF markers expression densities across regions (TN, TAS, ANS). (f) Digital spatial phenotyping of nearest-neighbor relationships between CAF subtypes (αSMA+, FAP+, S100A4+, PDPN+) and tumor cells (PAX8+). The upper row shows multiplex immunofluorescence images, and the lower row visualizes digitally identified spatial interactions, indicated by connecting lines to their nearest tumor cells (scale bars: 200 μm). (g) Boxplots show quantified average distances between CAF subtypes and nearest PAX8+ tumor cells, (h) and local densities within 300 μm of tumor cells as shown in representative image (f). Data are mean ± SEM; by one-way ANOVA.
To quantify the spatial interactions between different CAF subtypes and tumor cells, we applied digital spatial phenotyping and nearest-neighbor analysis. Specifically, S100A4+ and αSMA+ CAFs exhibited significantly closer proximities and higher local densities surrounding tumor cells (PAX8+), suggesting stronger direct interactions with the tumor compartment (mean nearest distances significantly shorter for S100A4+, p < 0.0001). In contrast, FAP+ and PDPN+ CAFs displayed greater distances and lower local densities around TN (Figure 1(f)–(h)). These results indicated significant heterogeneity among CAF subtypes regarding their spatial relationships with tumor cells.
To summarize, these observations illustrate marked CAF subtype heterogeneity in ROC microenvironment. The significant enrichment and proximity of S100A4+ and αSMA+CAFs to tumor cells within the TAS highlight their potential functional roles in modulating tumor interactions and influencing surgical outcomes.
Enrichment of S100A4+CAFs correlates with optimal surgical outcomes and enhanced immune cell proximity
The mIHC and digital phenotyping analysis revealed that ROC patients with R0 resection exhibit significantly higher proportions (p = 0.0341) and density (p = 0.0020) of S100A4+CAFs within TAS than those with incomplete tumor resection (non-R0; Figure 2(a)–(c)). Conventional immunohistochemistry validation further supported these findings, showing increased S100A4+ CAFs enrichment in R0 group (p = 0.0392; Figure S1(B)).

Enrichment and spatial distribution of S100A4+CAFs correlate with R0 resection in ROC. (a) Representative H&E staining, mIHC staining, and phenotyping analysis showing spatial distribution of S100A4+CAFs (magenta) in TAS from patients with ROC undergoing SCR. Scale bar, 200 μm. Upper panels represent patients with R0 (n = 19), and lower panels represent those with non-R0 (n = 12). (b, c) Quantitative comparison of S100A4+CAFs between R0 and Non-R0 groups. Dot plots illustrate the percentage of S100A4+CAFs among total TAS cells (b, p = 0.0341) and absolute cell density per mm2 (c, p = 0.0020) as shown in representative image (a). Blue dots indicate the R0 group, and orange dots indicate the Non-R0 group. Data are presented as mean ± SEM. (d, e) Multiplex immunohistochemical and digital phenotyping analyses of other CAF subpopulations within the manually annotated TAS. Representative images (d) demonstrate CAF subpopulations defined by marker co-expression in R0 (top row) and Non-R0 groups (bottom row). Scale bars, 200 μm. (e) Quantitative analysis compares cell densities of CAF subpopulations between R0 and Non-R0 groups as shown in representative image (d). (f–h) Spatial relationship between S100A4+CAFs and CD3+T cells in ROC samples. Representative images (f) show H&E staining, corresponding mIHC staining (S100A4+CAFs in magenta, CD3+ T cells in cyan), and digital phenotyping illustrating nearest neighbor interactions between S100A4+CAFs and CD3+T cells (white lines indicate nearest neighbor connections). Quantitative comparisons of mean nearest neighbor distance (g) and median nearest neighbor distances (h) between R0 (blue dots) and Non-R0 groups (orange dots).
To further explore the relationship between specific CAF subsets and surgical outcomes, we analyzed the co-expression patterns of key markers within the TAS of patients with complete (R0, n = 19) versus incomplete (Non-R0, n = 12) resection. This quantitative analysis revealed a significant enrichment of the S100A4+αSMA+ CAF subpopulation in the R0 group (p = 0.0481), while other co-expressing subsets (e.g., S100A4+FAP+, S100A4+PDPN+) showed no significant difference between groups (Figure 2(d) and (e)). This finding suggests that the specific enrichment of S100A4+αSMA+ CAFs may be linked to tumor confinement and resectability in ROC.
Given established roles of CAFs in modulating T cell infiltration and spatial organization to influence the tumor immune microenvironment and prognosis,36–38 we specifically investigated the spatial relationship between S100A4+ CAFs and T cells. Spatial interaction analysis demonstrated that in the R0 group, S100A4+ CAFs were located at significantly shorter mean and median nearest-neighbor distances to CD3+ T cells (p = 0.0125 and p = 0.0202, respectively), and were present at higher densities in proximity to T cells (Figure 2(f)–(h)). This closer spatial association in R0 samples suggests a potential for direct interaction between S100A4+ CAFs and T cells, which may contribute to shaping a local immune contexture favorable for complete surgical resection. Collectively, these data indicate that S100A4+ CAFs are closely associated with favorable surgical outcomes and immune cell proximity in ROC. Furthermore, the S100A4+αSMA+ subset is specifically enriched in R0 samples.
Single-cell transcriptomics identifies ECM remodeling and immunoregulatory signatures in S100A4+ CAFs
The scRNA-seq was performed on tumor tissues obtained from 11 patients with ROC to characterize the cellular and transcriptional CAF heterogeneity. Unsupervised clustering identified 24 clusters across 115,487 cells, categorized into major cell populations including T cells, B cells, myeloid cells, epithelial cells, endothelial cells, and fibroblasts (stromal cells; Figure S2(A)–(C)).
Further detailed clustering of 10,060 stromal cells revealed 11 transcriptionally distinct clusters (Figure 3(a) and (b)), including pericytes (RGS5+, Cluster 2), smooth muscle cells (SMC, MYH11+, Cluster 4), and mesothelial cells (MC, UPK3B+, Cluster 7). After excluding these non-CAF lineages (clusters 2, 4, and 7), we focused subsequent analysis on the remaining 8 transcriptionally distinct CAF clusters. Prominent CAF clusters were characterized by high expression of specific ECM remodeling and regulatory genes, such as MMP11 (Cluster 0), COL11A1 (Cluster 1), VEGFA (Cluster 6), and CXCL1 (Cluster 8; Figure 3(c)).

scRNA-seq reveals transcriptional heterogeneity of CAF subtypes and highlights unique ECM remodeling and immune regulatory features of S100A4+ CAFs in ROC. (a–c) Single-cell transcriptome analysis of CAFs highlights distinct CAF subpopulations. UMAP visualization of stromal cells colored by sample origin (a) and unsupervised clustering identifying 11 distinct stromal clusters (0–10) (b). Dot plot illustrating key marker gene expression across stromal clusters; dot size indicates the proportion of cells expressing each gene, while color intensity reflects scaled expression (c). (d, e) Expression distribution and differential gene analysis of S100A4+ CAFs. UMAP plot showing gradient distribution of S100A4 expression levels and distribution of S100A4+ versus S100A4– cells (d). Volcano plot showing significantly upregulated genes in S100A4+CAFs compared to S100A4– CAFs; significantly upregulated genes are labeled in red (e). (f, g) Functional enrichment analysis of S100A4+CAFs-specific differentially expressed genes. GO enrichment analysis categorized into BP, CC, and MF (f). KEGG pathway enrichment analysis highlighting pathways related to antigen presentation as significantly enriched (g). (h, i) Spatial proximity analysis of CAF subtypes and CD3+T cells by multiplex immunofluorescence. Representative images of multiplex immunofluorescence staining demonstrate spatial relationships between CD3+T cells (cyan) and different CAF subpopulations (S100A4+, purple; αSMA+, red; FAP+, orange; PDPN+, green) (h). Quantitative analysis showing significantly higher densities of S100A4+CAFs around CD3+T cells within 20 μm compared to other CAF subtypes (i). Scale bar: 50 μm.
Analysis of S100A4 expression across these clusters confirmed its broad distribution among CAFs, with notably higher expression observed in clusters 0, 8, and 9 (Figure 3(c)). Given the observed clinical relevance of S100A4+ CAFs, we performed differential expression analysis on S100A4+ versus S100A4– CAFs across the CAF compartments (Figure 3(d)). S100A4+ CAFs significantly upregulated genes associated with ECM remodeling and fibrosis (e.g., MMP1, COL12A1, WNT5A), as well as immune-regulatory molecules (e.g., IL7R, ADM, IL32; Figure 3(e)).
Gene Ontology (GO) enrichment further confirmed that S100A4+CAFs were enriched in processes related to ECM organization, response to hypoxia, actin cytoskeleton organization, and integrin binding, consistent with their potential roles in matrix remodeling and stromal activation (Figure 3(f)). Kyoto Encyclopedia of Genes and Genomes (KEGG) pathway analysis additionally highlighted antigen processing and presentation as the most significantly enriched pathway, suggesting a potential immunoregulatory function (Figure 3(g)).
To validate the predicted immunoregulatory potential of S100A4+CAFs, mIHC staining and digital spatial proximity analyses were performed. Compared to other CAF subtypes, S100A4+ CAFs displayed significantly higher spatial proximity to CD3+T cells (p < 0.0001), indicating a stronger tendency for direct spatial interaction with immune effector cells (Figure 3(h) and (i)). This spatial enrichment further supports a functional role of S100A4+CAFs in modulating local immunity within the TME.
Clinical relevance and immune implications of S100A4+ apCAFs
The scRNA-seq analysis identified a subset characterized by high expression of CD74 and canonical MHC class II genes (e.g., HLA-DRA, HLA-DPA1; Figure S2(D)). This subset, which we term S100A4+ apCAFs (S100A4+apCAFs), displayed notably higher S100A4 expression compared to other CAF clusters (Figure S3(A)). Validation by mIHC confirmed the predominant co-expression of CD74 and S100A4 at the protein level within the TAS, thereby defining this distinct CAF population (Figure S3(B)–(E)).
Given its role as an invariant chain of the MHC class II complex, CD74 is critically involved in presenting antigens to CD4+ T helper cells. 39 We therefore hypothesized that if CD74+S100A4+ CAFs are functionally engaged in antigen presentation, they would exhibit preferential spatial interaction with CD4+ T cells. To test this, we evaluated the spatial relationship between CD74+S100A4+CAFs and immune cells. mIHC-based spatial analysis demonstrated that CD74+S100A4+CAFs were significantly closer to CD4+T cells than other CAF subtypes (Figure 4(a) and (b), p = 0.0088–0.0231), suggesting a functional involvement in local immune regulation.

Immune spatial interactions and prognostic significance of CD74+S100A4+ antigen-presenting CAFs in ROC. (a, b) Spatial proximity analysis between CAF subpopulations and CD4+T cells using mIHC and computational phenotyping. (a) Representative mIHC images showing spatial relationships between αSMA+, S100A4+, CD74+S100A4+ CAFs, and CD4+T cells. Lines indicate nearest neighbor distances between cells. Scale bar, 50 µm. (b) Boxplot quantification of mean number of CD4+T cells within 20 µm radius of each CAF subtype. CD74+S100A4+ CAFs displayed significantly closer proximity to CD4+ T cells. (p < 0.05) as shown in representative image (a). (c–e) Differences in CD74+S100A4+CAFs distribution and their spatial relationship with CD4+T cells between patients achieving R0 versus Non-R0. (c) Representative images of mIHC staining illustrating differences in spatial cell arrangement. Scale bar, 200 µm. (d) Quantification of CD74+S100A4+ CAFs densities (cells/mm²) and (e) mean count of CD4+ T cells within 20 µm of CD74+S100A4+ CAFs between R0 and Non-R0 groups. (f, g) Prognostic significance of S100A4+apCAFs based on multi-dataset transcriptomic analysis. (f) Forest plot showing HR of S100A4+apCAFs-associated gene signature across 11 ovarian cancer datasets. Each horizontal black square represents the HR estimate from an individual dataset, and the horizontal line indicates the 95% CI. The overall HR for S100A4+apCAFs is shown at the bottom, with the dashed vertical line indicating the reference value HR = 1. (g) In the TCGA ovarian cancer cohort, patients were stratified into a high-expression group (top 30%, n = 68, shown in blue) and a low-expression group (bottom 30%, n = 68, shown in red) based on the expression levels of the top 100 S100A4+apCAFs signature genes. The Kaplan–Meier survival curves compare overall survival between these groups. The x-axis represents time since diagnosis (in months), and the y-axis indicates overall survival probability.
Next, to assess the clinical relevance of S100A4+apCAFs, we analyzed their abundance and spatial context in relation to surgical outcomes. Patients who achieved R0 exhibited significantly higher densities of CD74+S100A4+ CAFs in the TAS, and these cells were located in closer proximity to CD4+ T cells, compared to patients with Non-R0 (Figure 4(c)–(e), p = 0.0187–0.0324). These findings suggest that S100A4+apCAFs may contribute to a favorable immune contexture associated with optimal surgical results.
Finally, a meta-analysis of multiple ovarian cancer transcriptomic datasets (CuratedOvarianData collection) revealed that a gene signature associated with S100A4+apCAFs was consistently correlated with a protective effect on patient survival (overall hazard ratio = 0.81, 95% confidence interval: 0.69–0.95; Figure 4(f)). This prognostic significance was further supported by Kaplan–Meier analysis in The Cancer Genome Atlas (TCGA) cohort, where high expression of the S100A4+apCAFs signature genes was associated with significantly improved overall survival (Figure 4(g), p = 0.03). Together, these results highlight the potential of S100A4+apCAFs as prognostic stromal biomarkers and immunomodulatory components within the TME.
Discussion
SCR is primarily indicated for platinum-sensitive ROC patients with resectable disease. Our study, therefore, focused exclusively on this platinum-sensitive cohort undergoing SCR, aligning with standard surgical practice. Platinum-resistant patients were excluded because SCR is not typically recommended for them, and their inclusion would introduce confounding variables. The TME in platinum-resistant disease is profoundly remodeled, which could obscure the specific CAFs biology related to resectability that we aimed to characterize in a homogeneous, surgery-eligible population. Future studies are needed to explore CAF heterogeneity in the context of platinum resistance.
This study systematically characterized the heterogeneity of CAFs in the ROC microenvironment, highlighting significant variations among CAF subtypes. Immunohistochemical and multiplex immunofluorescence analyses demonstrated consistent and robust expression of αSMA, FAP, and S100A4 markers within the TAS, contrasting with localized PDPN expression. These observations are consistent with previous studies indicating sustained CAFs activation in tumor progression and spatial specificity within stromal regions proximal to tumor cells. 40 Notably, PDPN+ CAFs, although less abundant, have been reported to facilitate structurally aberrant tertiary lymphoid structures (TLS) formation, thereby influencing immune cell localization and functional dynamics. 41 Our study reinforces the notion that CAF subtypes exhibit spatial heterogeneity within the ovarian TME, driven potentially by local tumor-derived signals or ECM remodeling processes. 36
Our results highlighted a novel association between CAF subtypes composition—specifically S100A4+CAFs—and the surgical outcomes of ROC patients undergoing SCR. Patients achieving R0 displayed significantly higher densities of S100A4+ CAFs within TAS, suggesting that their enrichment might positively influence tumor encapsulation and facilitate complete surgical removal. Consistent with prior findings, S100A4 expression has been closely linked to fibrosis and ECM remodeling. 42 Interestingly, the prognostic association appeared specific to the S100A4+αSMA+CAFs subpopulation rather than all CAF subtypes, underscoring the importance of subtype-specific functional distinctions. Therefore, future clinical strategies may benefit from detailed CAF phenotyping to identify and selectively target CAF subsets that contribute to improved surgical outcomes and reduced tumor invasiveness.
Emerging evidence suggests CAFs critically modulate immune cell infiltration and spatial organization within tumors.38,43 Our analysis demonstrated that S100A4+ CAFs showed significantly higher spatial proximity to CD3+ T cells compared with other CAF subtypes, particularly in patients achieving R0. This spatial relationship suggests S100A4+CAFs may facilitate T-cell infiltration or enhance local immune activation, supporting an antitumor immune response conducive to successful surgical outcomes.
The scRNA-seq allowed us to further delineate transcriptional and functional heterogeneity among ovarian cancer. S100A4+CAFs broadly expressed multiple ECM-remodeling genes (e.g., MMP1, COL12A1, WNT5A) and immunoregulatory factors (IL7R, ADM, IL32), underscoring their dual role in stromal activation and immune modulation. GO and KEGG analyses further indicated significant enrichment of pathways associated with ECM remodeling, hypoxia response, actin cytoskeleton regulation, and, notably, antigen processing and presentation. Such findings suggest S100A4+CAFs may exert their effects through immune-regulatory functions, potentially influencing tumor-associated inflammation and T-cell-mediated immunity.16,44 These findings provide a compelling transcriptional foundation for the functional significance of S100A4+CAFs and their distinct immunomodulatory potential.
An intriguing finding of our study was the identification of an apCAFs subtype, characterized by high co-expression of CD74 and S100A4 (S100A4+apCAFs). This subpopulation demonstrated enhanced proximity to CD4+T cells, indicative of a potential role in antigen presentation through MHC class II-mediated pathways. Previous studies have established CD74 as critical for antigen presentation to CD4+ T cells, mediating specific immune responses. 39 Although our results suggest a spatial interaction between apCAFs and CD4+ T cells consistent with MHC-II-mediated biology, it does not define the functional subset or activation state of these T cells. Furthermore, future studies should extend this spatial analysis to CD8+ cytotoxic T cells to provide a more comprehensive view of apCAFs-mediated immunomodulation within the TME.
In addition, we observed that increased densities of CD74+S100A4+ CAFs correlated positively with favorable surgical outcomes, likely through improved T-cell-mediated local immune responses. Meta-analysis across multiple ovarian cancer datasets and the TCGA database further corroborated the protective prognostic implications of S100A4+apCAFs, indicating their utility as potential prognostic biomarkers. While our data delineate the “what” and “where” of S100A4+apCAFs, the “how”—namely the upstream signals inducing this phenotype or the precise mechanism of T-cell interaction—remains speculative. Future functional studies should investigate whether specific cytokines (e.g., IFNγ), metabolic cues, or mechanical stresses from the tumor or immune cells drive the formation of S100A4+CD74+ CAFs. Furthermore, co-culture experiments and antigen-specific assays are needed to determine if this apCAF actively presents antigen via MHC-II to modulate CD4+ T cell function, or engage through other immunomodulatory pathways. 45
Our findings indicate that S100A4+apCAFs potentially represent a protective CAF subtype associated with improved clinical outcomes in ovarian cancer patients. Meta-analysis demonstrated their association with reduced patient mortality, emphasizing their immunoregulatory role in promoting favorable immune surveillance within the TME. These insights provide an important theoretical foundation for future clinical applications, suggesting that S100A4+apCAFs could serve as promising prognostic biomarkers to guide individualized treatment strategies. However, our findings require validation in larger prospective cohorts, considering the limited patient numbers analyzed in this study. The sample sizes for mIHC (n = 31) and scRNA-seq (n = 11), while sufficient for initial discovery, warrant caution in generalizing the findings. Future validation in larger, independent, prospective cohorts of ROC patients is essential to confirm the clinical utility of S100A4+apCAFs as significant biomarkers.
Conclusion
In this multi-platform investigation integrating spatial phenotyping, single-cell transcriptomics, and clinical outcome analysis, we systematically characterized the cellular and functional heterogeneity of CAFs in ROC. Our findings reveal that S100A4+ CAFs, particularly the antigen-presenting S100A4+CD74+ subset, represent a distinct stromal population enriched in tumor-adjacent regions, closely associated with CD4+ T-cell localization, and strongly correlated with complete surgical resection and improved patient survival. Transcriptomic profiling demonstrates these CAFs harbor unique ECM-remodeling and immunoregulatory signatures, underscoring their potential role in shaping the tumor immune microenvironment. Collectively, these results identify S100A4+apCAFs as clinically meaningful stromal biomarkers that may refine surgical candidate selection and inform personalized therapeutic strategies for ROC. Further mechanistic and prospective validation studies are warranted to translate these observations into clinical application.
Supplemental Material
sj-docx-1-tam-10.1177_17588359261436959 – Supplemental material for S100A4 characterize antigen-presenting cancer-associated fibroblasts and predicts surgical outcomes in relapsed ovarian cancer
Supplemental material, sj-docx-1-tam-10.1177_17588359261436959 for S100A4 characterize antigen-presenting cancer-associated fibroblasts and predicts surgical outcomes in relapsed ovarian cancer by Yilizhati Maimaiti, Yulian Chen, Longxia Li, Meichun Cai, Zeyun Li, Lifeng Lin, Shangbing Gao, Guanglei Zhuang, Wei Wu and Rongyu Zang in Therapeutic Advances in Medical Oncology
Footnotes
Acknowledgements
The authors would like to extend their sincere gratitude to the clinical and research teams at the Department of Gynecologic Oncology and the Department of Pathology for their invaluable support in sample collection and patient data management.
Declarations
Supplemental material
Supplemental material for this article is available online.