
Abstract
Background:
Cancer-derived inflammation has been shown to attenuate the efficacy of chemotherapy (CT) in colorectal cancer. However, its role in clinical response to bevacizumab (Bev) remains unclear in patients with metastatic colorectal cancer (mCRC).
Objectives:
To investigate the clinical significance of the fibrinogen-to-prealbumin ratio (FPR) as a biomarker in mCRC patients receiving first-line Bev plus CT (Bev/CT).
Design:
A retrospective, single-center, observational study.
Methods:
Patients treated with first-line Bev/CT were enrolled across discovery (n = 249), internal validation (n = 115), and external validation (n = 109) cohorts, along with a patient group receiving CT alone (n = 175). Propensity score matching was performed to balance baseline characteristics between the Bev/CT- and CT-treated groups. The primary endpoints were disease control rate (DCR) and progression-free survival (PFS), and 1-year overall survival (OS) was designated as a secondary endpoint.
Results:
Elevated pretreatment FPR was significantly associated with increased tumor burden. FPR-H patients exhibited an unfavorable DCR compared to the FPR-L patients in the overall Bev/CT-treated population (adjusted odds ratio (OR) = 2.18, 95% confidence interval (CI) = 1.32–3.61, p < 0.01). FPR-H was also independently associated with shorter PFS in the discovery (plog-rank < 0.01, adjusted hazard ratio (HR) = 1.51, 95% CI = 1.11–2.05), internal validation (plog-rank < 0.01, adjusted HR = 2.47, 95% CI = 1.43–4.27), and external validation cohorts (plog-rank < 0.001, adjusted HR = 2.28, 95% CI = 1.43–3.64), regardless of KRAS status, particularly in the microsatellite stable subgroup. Furthermore, FPR-H patients had significantly worse 1-year OS than the FPR-L subgroup in the overall population (plog-rank < 0.001; adjusted HR = 2.86, 95% CI = 1.78–4.61). Dynamic monitoring of FPR demonstrated utility in tracking disease progression during Bev/CT treatment, with earlier detection capability compared to imaging-based assessment. In propensity score-matched analysis, patients receiving Bev/CT showed superior outcomes relative to those receiving CT alone (plog-rank < 0.001), especially among the FPR-L subgroup (plog-rank < 0.01). In addition, Bev/oxaliplatin-treated FPR-L cases achieved better outcomes than those receiving the Bev/irinotecan regimen, particularly in the subgroup undergoing palliative resection.
Conclusion:
Cancer-derived inflammation appears to play a crucial role in mediating both intrinsic and acquired resistance to Bev. The FPR emerges as a robust, independent biomarker for predicting response to Bev, monitoring disease progression, and informing personalized therapeutic decision-making in patients with mCRC.

Keywords
Introduction
Colorectal cancer (CRC) poses a significant public health burden in China, ranking as the second most frequently diagnosed malignancy and the fourth leading cause of cancer-related mortality. 1 Due to postoperative minimal residual disease and therapeutic resistance, approximately 50% of CRC patients develop distant metastasis, 2 with around 20% presenting with metastatic CRC (mCRC) at initial diagnosis.3,4 Recently, substantial improvement in survival rates among mCRC patients has been attributed to the advent of targeted therapies and immunotherapy.5,6 Bevacizumab (Bev) has become a cornerstone of first-line treatment when combined with chemotherapy (Bev/CT). This regimen has demonstrated durable clinical responses and improved disease control rate (DCR).7,8 However, its effectiveness is often limited by intrinsic or acquired resistance.9,10
Bev, a monoclonal antibody targeting vascular endothelial growth factor A (VEGFA), could suppress angiogenesis by blocking VEGF/VEGFR signaling. 11 Nevertheless, conventional biomarkers such as VEGF, CD31, and KRAS/BRAF mutations have proven limited utility in predicting clinical response to Bev therapy.12–15 Although emerging biomarkers such as circulating tumor DNA and microbial DNA show promise, their widespread clinical application is hindered by high costs and technical challenges.16,17 Therefore, there remains an urgent need for cost-effective, accessible, and reliable biomarkers to identify mCRC patients who are most likely to benefit from the first-line Bev/CT regimen.
Cancer-derived inflammation is a well-established hallmark of CRC, promoting tumor progression, metastasis, and drug resistance. 18 Chronic inflammation processes reshape the tumor microenvironment and contribute to therapeutic resistance, 19 thereby diminishing responsiveness to both CT and targeted therapy in CRC patients. 20 Our previous studies identified the fibrinogen-to-prealbumin ratio (FPR) outperforms other commonly inflammatory ratios such as neutrophil-to-lymphocyte ratio (NLR), lymphocyte-to-monocyte (LMR), and systemic inflammation response index, and systemic immune-inflammation index (SII) as an optimal and sensitive biomarker in reflecting chronic inflammation burden.21,22 Circulating FPR has been shown to stratify subgroups benefiting from CT in CRC,23–26 monitor recurrence and disease progression among NSCLC, 27 and serve as an independent prognostic factor across various malignancies, including CRC. 28 Despite this evidence, the role of inflammation in modulating Bev/CT efficacy in mCRC remains poorly characterized. Moreover, no study to date has systematically evaluated the roles of FPR in assessing Bev therapeutic efficacy, predicting clinical prognosis, monitoring disease dynamics, or guiding therapeutic selection in mCRC.
In this study, we enrolled a total of 648 eligible mCRC patients. Among them, 473 patients received first-line Bev/CT and were allocated to a discovery cohort (n = 249), an internal validation cohort (n = 115), and an external validation cohort (n = 109), and the remaining 175 patients received CT alone. The objectives of this study were threefold: (1) to investigate the association between baseline circulating FPR and clinical outcomes; (2) to evaluate the utility of dynamic FPR changes in monitoring disease progression and informing treatment decisions; and (3) to explore the relationship with cancer-derived inflammation and Bev resistance in mCRC.
Materials and methods
Population
The Ethics Committee of the Second Affiliated Hospital of Nanchang University approved this retrospective study (O-MRE[2025] No. 65). We screened and selected eligible participants based on the following inclusion criteria: (1) patients who were first diagnosed with mCRC through imaging, laboratory, and gastrointestinal endoscopy between January 2018 and December 2024 at our hospital; (2) patients aged over 18 years at the time of diagnosis; and (3) newly diagnosed patients who were willing to receive further treatment at our hospital. Patients meeting any of the following exclusion criteria were excluded from the study: (1) diagnosis of more than two primary malignancies; (2) those with bacterial or viral infection within 1 month prior to diagnosis; (3) use of anti-inflammatory drugs or receipt of CT before diagnosis; and (4) loss to follow-up for three consecutive months without reaching any study endpoint.
Clinical treatments and response evaluations
All enrolled patients were categorized into groups based on whether they received CT or Bev/CT as first-line treatment, following shared decisions-making between patients and clinicians. The treatment regimens included the following: (1) oxaliplatin-based CT (FOLFOX/XELOX, CT-OX), (2) irinotecan-based CT (FOLFIRI/ XELIRI, CT-IRI), (3) Bev combined with oxaliplatin-based CT (Bev/OX), and (4) Bev combined with irinotecan-based CT (Bev/IRI). Clinical response was assessed according to RECIST v1.1 criteria 29 within the 3-month period after the completion of at least two treatment cycles. The DCR was defined as the proportion of patients achieving complete response (CR), partial response (PR), or stable disease (SD).
Follow-up
The primary endpoints were treatment response and progression-free survival (PFS), with 1-year overall survival (OS) designated as the secondary endpoint. Follow-up assessments were conducted every 3 months during the first 2 years and every 6 months thereafter, and the follow-up deadline was June 2025. PFS was defined as the time from initial diagnosis to disease progression, death, or the last follow-up. OS was defined as the time from initial diagnosis to death or the last follow-up, whichever occurred first. Common imaging modalities such as computed tomography (CT), magnetic resonance imaging (MRI), and single-photon emission CT were selected to assess disease status according to clinical requirements for optimal visualization of specific metastatic sites. All imaging assessments were centrally reviewed. Progressive disease (PD) was primarily determined by radiological imaging confirmation of new or progressive metastatic lesions. Serum tumor biomarker monitoring was performed for each patient, and a twofold increase in serum carcinoembryonic antigen (CEA) or carbohydrate antigen 19-9 (CA19-9) levels from the nadir was used as a supplementary criterion for PD. 30 The study adheres to the Strengthening the Reporting of Observational Studies in Epidemiology (STROBE) guideline for cohort (Appendix S1). 31
Laboratory detection
Laboratory parameter data were extracted from hospital records at the following clinically defined time points: pre-/post-treatment, at disease control (On-DCR), and at disease progression (On-PD). Fibrinogen (Fib) was measured using the Clauss assay (Sysmex CA-7000; Sysmex, Tokyo, Japan), and prealbumin (pAlb) was quantified by immunoturbidimetry (Olympus AU5400; Beckman Coulter, Tokyo, Japan). Serum CEA and CA19-9 levels were simultaneously analyzed by chemiluminescence immunoassay (Siemens ADVIA Centaur XP; Siemens, Erlangen, Germany). The FPR was calculated as Fib × 1000/pAlb. All inter- and intra-assay coefficients of variation were below 10%.
KRAS mutation and immunohistochemical detection of mismatch repair proteins
Formalin-fixed paraffin-embedded (FFPE) tumor samples were used to analyze KRAS mutations and mismatch repair protein expression (MLH1, MSH2, MSH6, and PMS2). Genomic DNA was extracted using the QIAamp DNA FFPE Kit (Qiagen; Hilden, Germany), and samples with OD260/280 ratios between 1.8 and 2.0 were included. KRAS mutations (G12C, G12S, G12R, G12V, G12D, G13A, and G13D) were detected by amplification-refractory mutation system PCR using the AmoyDx kit (Amoy Diagnostics, Xiamen, China). Immunohistochemistry was performed by a trained technician and evaluated independently by two pathologists. Specimens showing positive expression of all four proteins were classified as microsatellite stable (MSS), while loss of expression in any of the proteins was defined as microsatellite instability (MSI). 32
Statistical analysis
The optimal FPR cutoff for PFS was determined using X-tile software. 33 Group comparisons were performed using the Mann–Whitney, Kruskal–Wallis, Chi-square, or Fisher’s tests. Treatment efficacy was evaluated through logistic regression analysis, with results presented as odds ratio (OR) and 95% confidence intervals (CIs). PFS and OS were estimated using Kaplan–Meier curves (log-rank test) and Cox proportional hazards regression (hazard ratio (HR), 95% CI). Associations between continuous variables were assessed using Pearson correlation and restricted cubic spline (RCS) analysis. Propensity score matching was applied to balance the clinicopathological characteristics between the Bev/CT- and CT-treated groups. All statistical analyses were carried out using SPSS 27.0 software (IBM Corp, Armonk, NY, USA), GraphPad Prism 9.0 (GraphPad Software, San Diego, CA, USA), and MSTATA online (https://www.mstata.com/). Statistical significance was defined as p < 0.05.
Results
Clinical characteristics of the eligible patients
The detailed flowchart of eligible cases is presented in Figure 1. Based on the inclusion and exclusion criteria, a total of 648 patients were enrolled, including 175 patients who received first-line CT (CT group) and 473 patients who underwent first-line Bev/CT (Bev/CT group). Among patients in the Bev/CT group diagnosed before June 2023, participants were randomly assigned to the discovery (249 cases) and internal validation cohort (115 cases) in an approximately 2:1 ratio; those diagnosed on or after this date were allocated to the external validation cohort (109 cases). The median follow-up duration was 9 months (range, 1–36 months). Baseline characteristics are summarized in Tables S1 and S2. Among patients receiving Bev/CT, baseline characteristics differed across cohorts, with fewer palliative surgeries performed in the discovery cohort (p < 0.01). The majority of patients (n = 311) received Bev/OX, with the remainder receiving Bev/IRI (Table S1). Before propensity score matching, the Bev/CT group had significantly higher prevalence of hypertension (45.67% vs 13.71%, p < 0.001), diabetes (17.55% vs 6.29%, p < 0.001), right-sided mCRC (33.62% vs 24.00%, p = 0.02), and palliative surgery (69.56% vs 48.57%, p < 0.001). However, no significant differences were observed in the distribution of liver-limited or multisite metastases between the two groups. Following propensity score matching, all clinicopathologic characteristics were balanced (Table S2).

The flowchart of screening and identification of eligible patients in the present study.
FPR and clinical characteristics
Based on PFS in the Bev/CT cohort, the optimal cutoff value for the FPR was determined as 24.1. Accordingly, we categorized the cohort into high-grade inflammation (FPR-H) and low-grade inflammation groups (FPR-L). Postoperative FPR levels were markedly lower in patients who underwent palliative surgery compared to those who did not receive surgical intervention (p < 0.001; Figure 2(a)). Similarly, patients with single-site mCRC exhibited lower FPR than those with multi-site metastases (p = 0.07; Figure 2(b)). Furthermore, a significant positive correlation was observed between FPR and primary tumor size in palliative surgical patients (Pearson’s r = 0.40; Figure 2(c)).
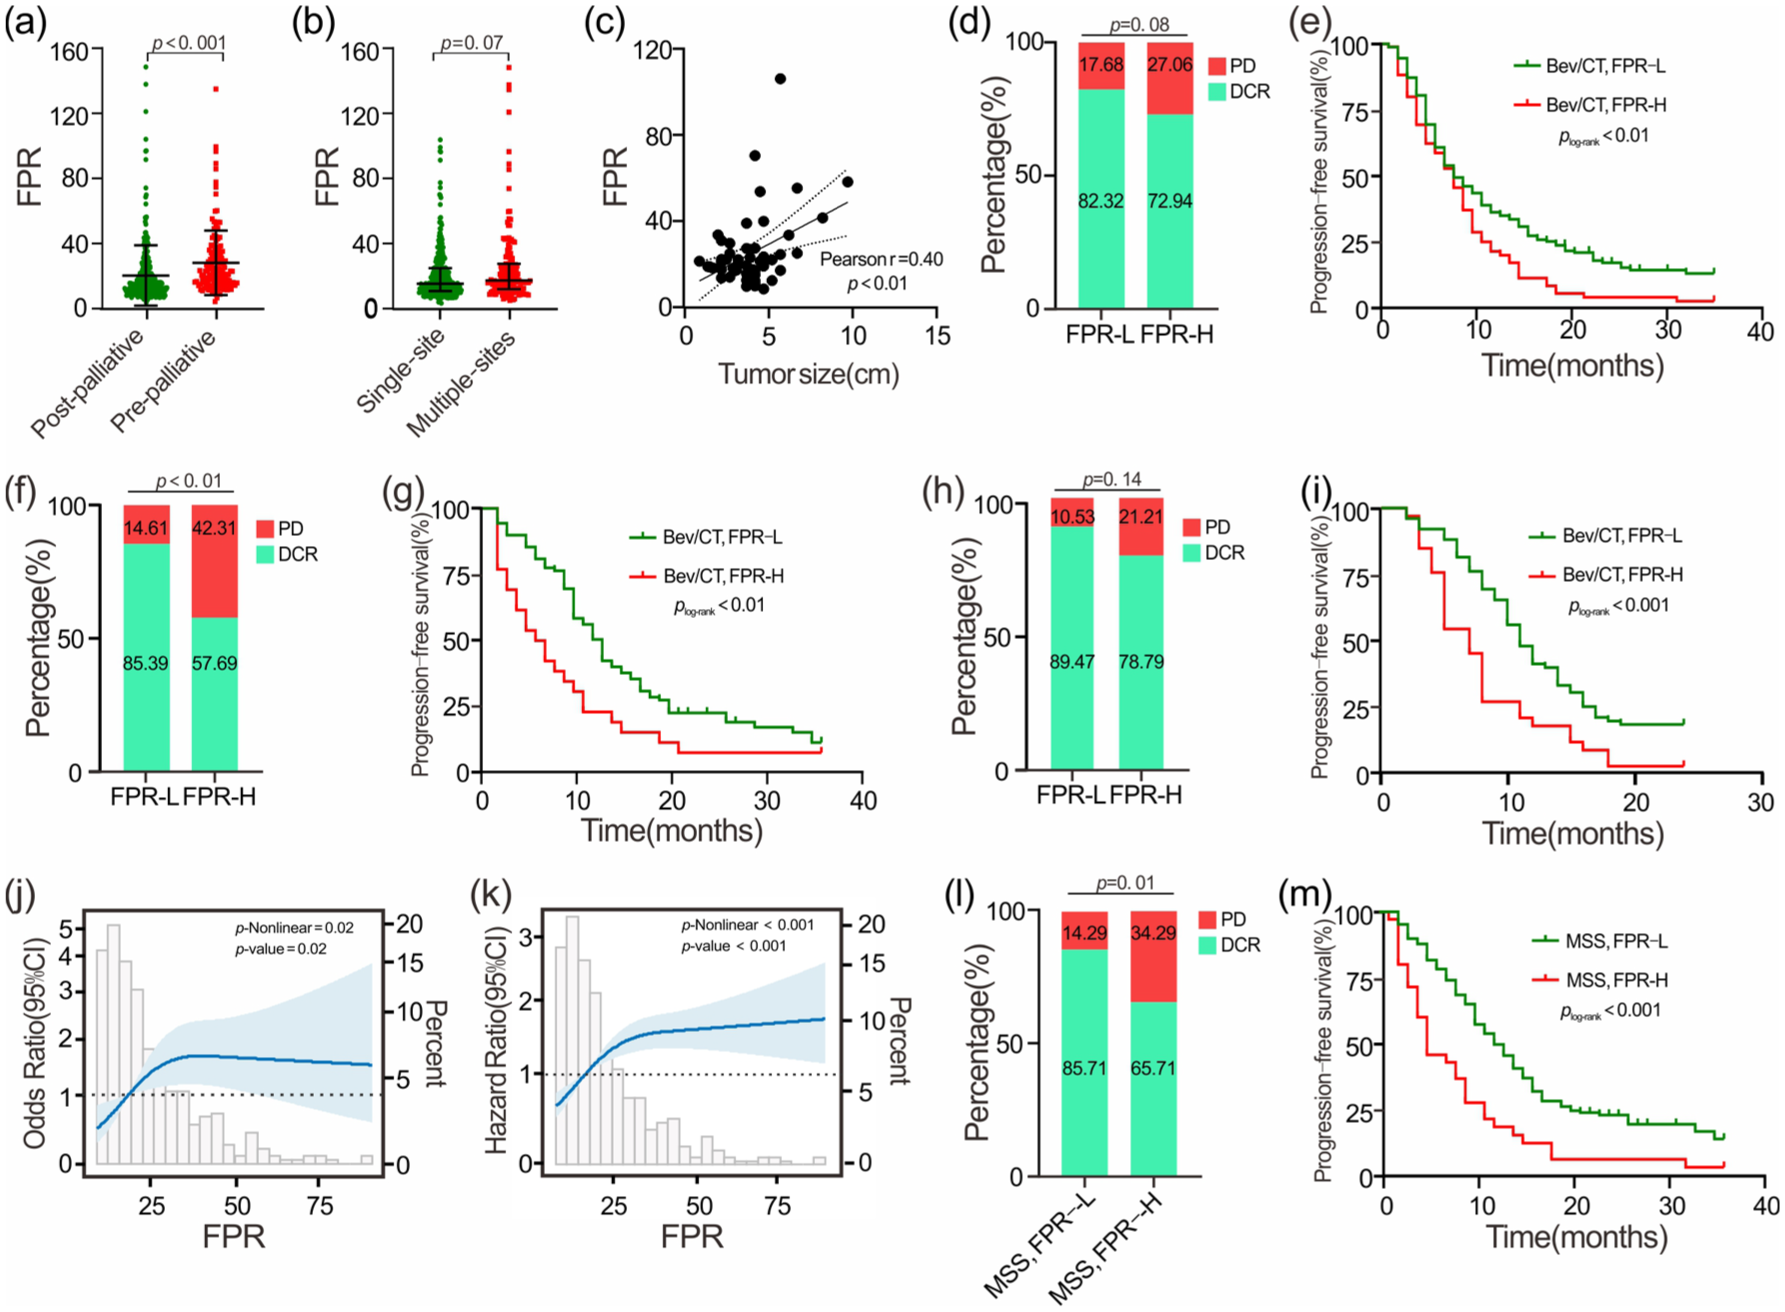
Associations of FPR with clinical characteristics and clinical outcomes in Bev/CT-treated patients with mCRC. (a) FPR comparison between pre- and post-palliative surgical patients. (b) FPR comparison among the patients with single- and multiple-metastatic sites. (c) Association of FPR with tumor size. (d, e) Association of FPR with DCR, PFS in the discovery cohort. (f, g) Association of FPR with DCR, PFS in internal validation cohort. (h, i) Association of FPR with DCR, PFS in external validation cohort. (j, k) Restricted cubic spline between FPR with DCR, PFS in the overall population. (l, m) Association of FPR with DCR, PFS in the overall population with MSS mCRC.
FPR and clinical outcomes
After two cycles of first-line Bev/CT, only one patient achieved a CR. The rates of SD and PD were 76.53% and 19.24%, respectively, yielding an ORR of 4.23% (Table S1). Patients with FPR-H exhibited a low DCR compared to those classified as FPR-L across cohorts (Discovery: 72.94% vs 82.32%, p = 0.08; Internal validation: 57.69% vs 85.39%, p < 0.01; External validation: 78.79% vs 89.47%, p = 0.14; Figure 2(d), (f), and (h)). Multivariable logistic regression analyses indicated that FPR-H (adjusted OR = 2.18, 95% CI = 1.32–3.61, p < 0.01) and multi-site metastases (adjusted OR = 2.07, 95% CI = 1.13–3.79, p = 0.02) were significantly associated with a notably higher PD in the overall Bev/CT population (Table 1). Furthermore, multivariate RCS analysis revealed a nonlinear association between FPR and clinical response in the overall population (p-nonlinear = 0.02, Figure 2(j)).
Association between the baseline characteristics and clinical response in the overall Bev/CT-treated population.

Tumors site at the caecum, ascending colon, and transverse colon were defined as right-sided colorectal cancer, and those located within the splenic flexure and beyond were defined as left-sided colorectal cancer. Multivariate analysis included the following parameters: sex, age, smoking, drinking, hypertension, diabetes, tumor site, palliative surgery, liver-limited metastasis, multisite metastasis, and treatment regimens.
p < 0.001, for logistic regression analysis.
Bev/CT, bevacizumab combined chemotherapy; Bev/OX, Bev combined oxaliplatin-based CT; CI, confidence interval; DCR, disease control rate; FPR, fibrinogen-to-prealbumin ratio; OR, odds ratio; PD, progressive disease.
In the discovery cohort, the FPR-H patient had significantly worse PFS than the FPR-L cases (plog-rank < 0.01; Figure 2(e)). After multivariable adjustment, elevated FPR remained independently associated with poorer PFS (adjusted HR = 1.51, 95% CI = 1.11–2.05, p < 0.01). This finding was consistently validated in both the internal (plog-rank < 0.01, adjusted HR = 2.47, 95% CI = 1.43–4.27; Figure 2(g)) and external (plog-rank < 0.001, adjusted HR = 2.28, 95% CI = 1.43–3.64; Figure 2(i)) validation cohorts (Table 2). Similarly, FPR-H patients had significantly inferior 1-year OS compared to FPR-L patients in the overall population (plog-rank < 0.001; adjusted HR = 2.86, 95% CI = 1.78–4.61; Figure S2, Table S3). Moreover, multivariate RCS analysis indicated an inverted L-shaped dose–response relationship between FPR and PFS among first-line Bev/CT-treated mCRC patients (Figure 2(k)).
Association between the baseline characteristics and progression-free survival in the three cohorts.
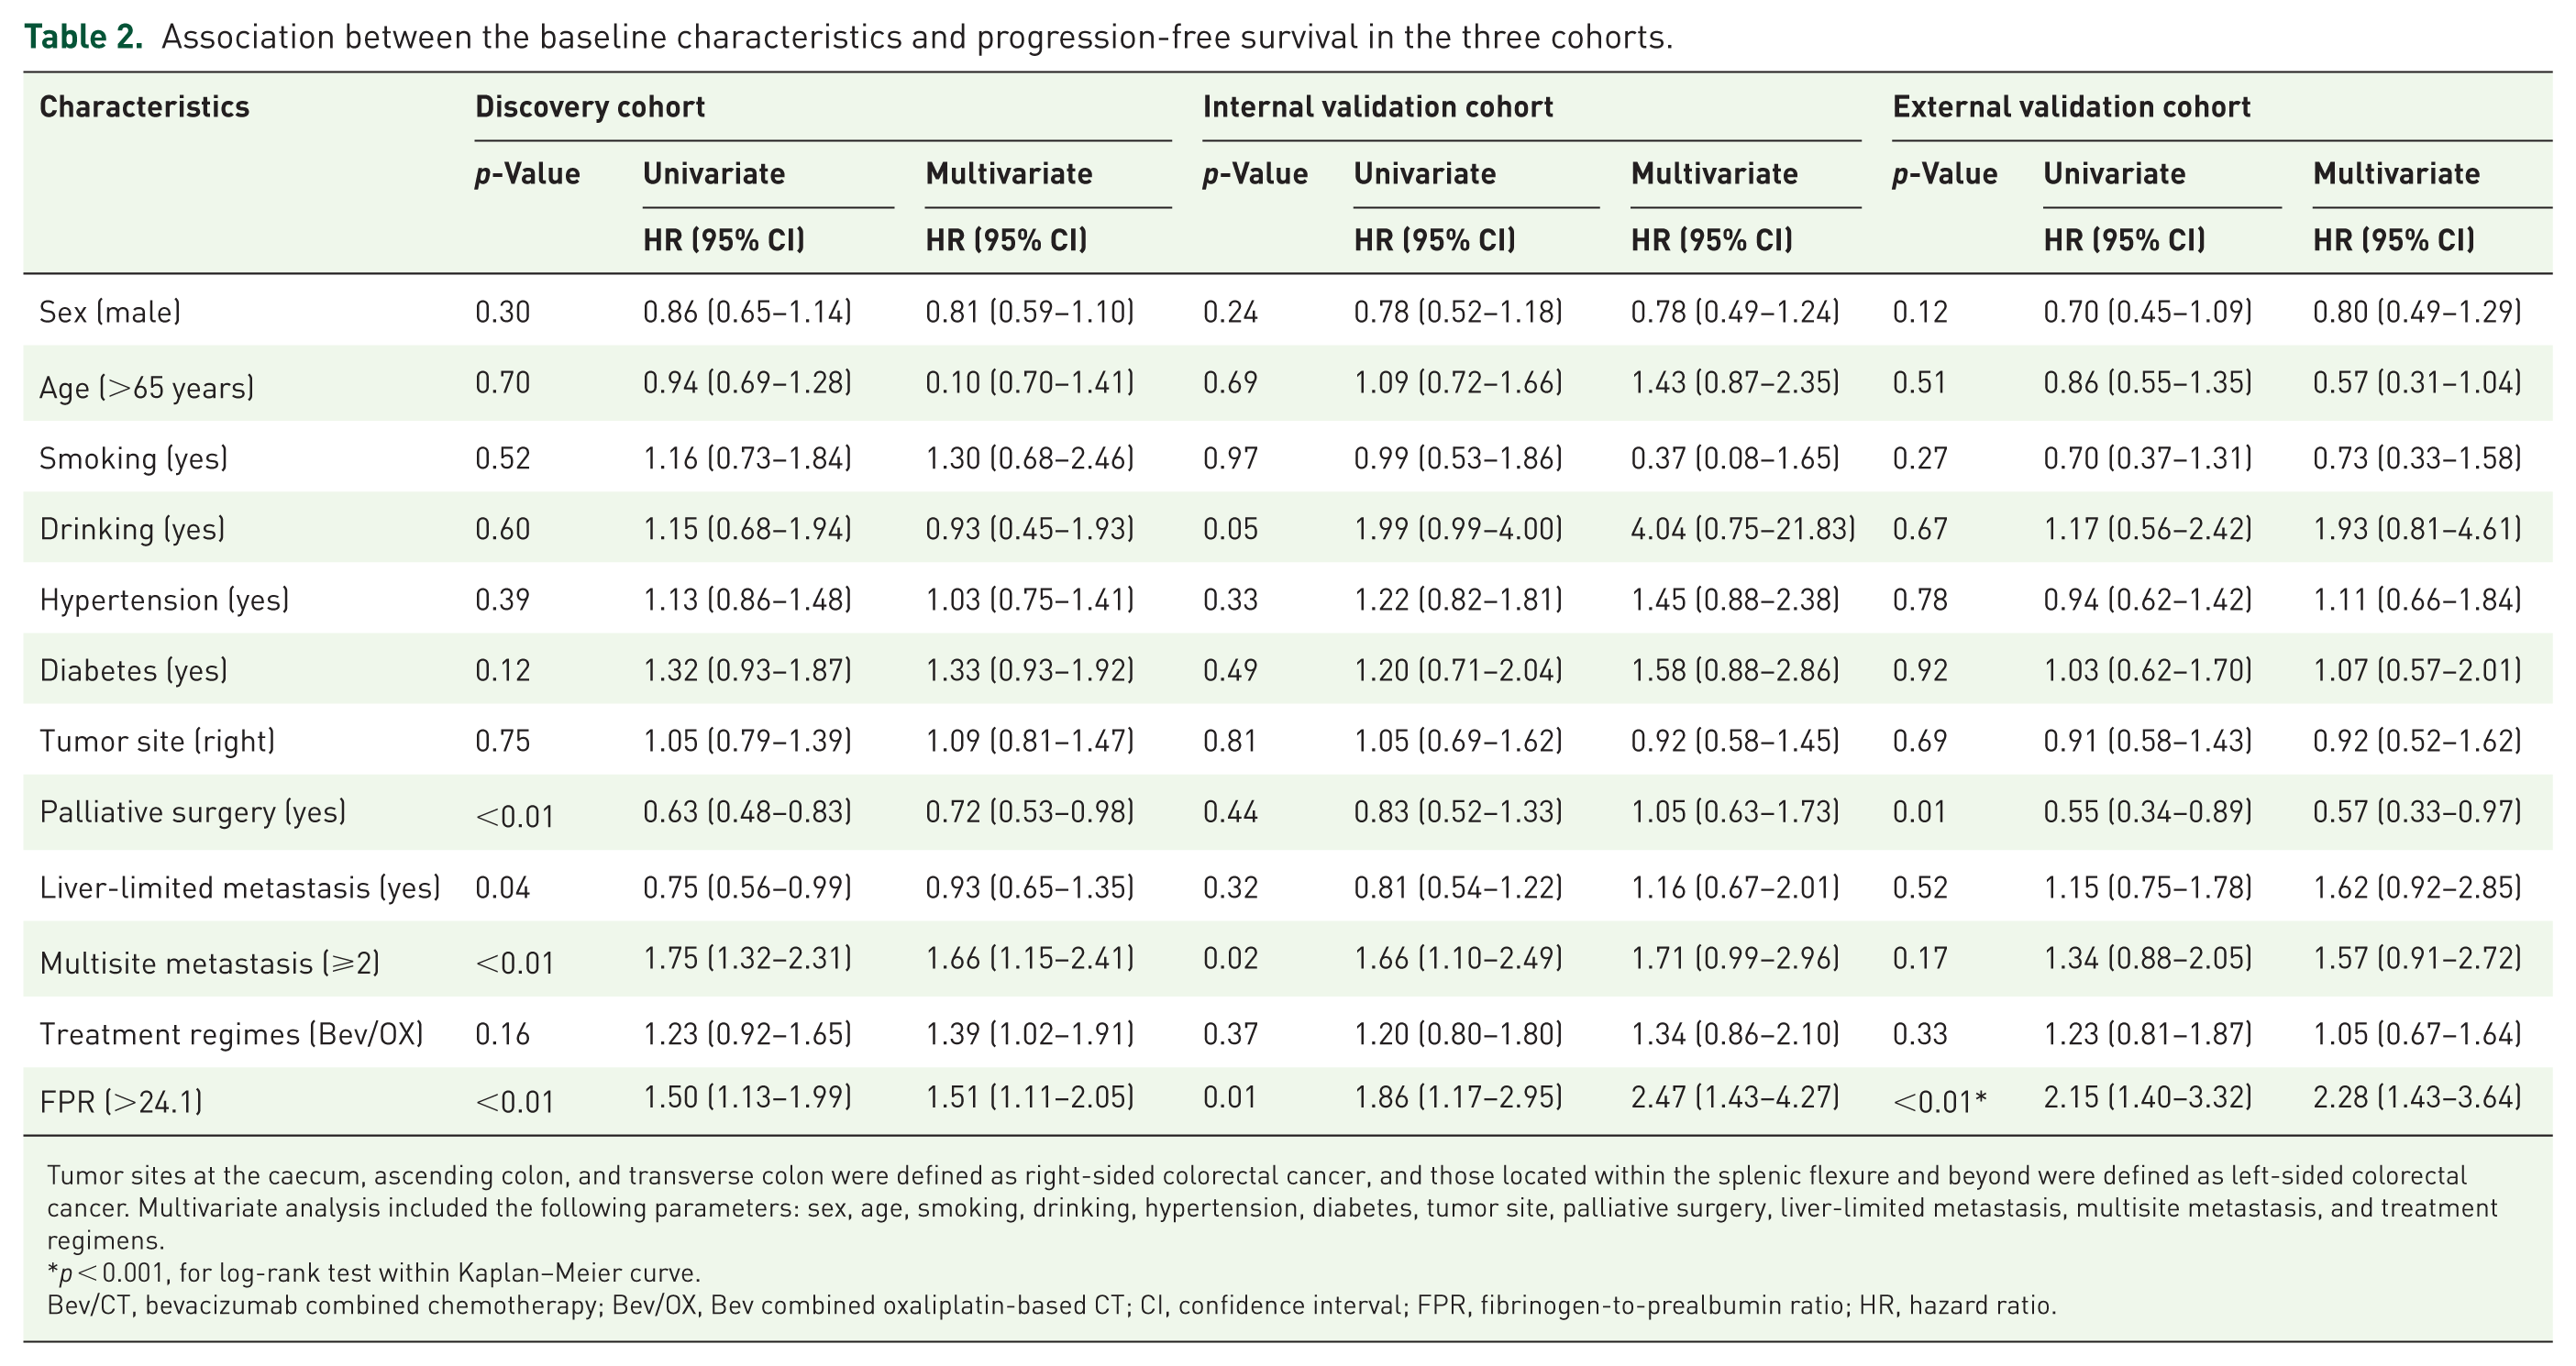
Tumor sites at the caecum, ascending colon, and transverse colon were defined as right-sided colorectal cancer, and those located within the splenic flexure and beyond were defined as left-sided colorectal cancer. Multivariate analysis included the following parameters: sex, age, smoking, drinking, hypertension, diabetes, tumor site, palliative surgery, liver-limited metastasis, multisite metastasis, and treatment regimens.
p < 0.001, for log-rank test within Kaplan–Meier curve.
Bev/CT, bevacizumab combined chemotherapy; Bev/OX, Bev combined oxaliplatin-based CT; CI, confidence interval; FPR, fibrinogen-to-prealbumin ratio; HR, hazard ratio.
Exploratory analysis: FPR, KRAS mutation, MSI, and clinical outcomes
Given limited tumor tissue availability, KRAS and MSI status were analyzed in 101 and 188 Bev/CT-treated patients, respectively. Among these, 22 patients were identified as KRAS wild-type, 79 patients harbored a KRAS mutated genotype, and 182 patients exhibited MSS. Owing to the small sample size, no significant difference in FPR was observed between KRAS wild-type and KRAS-mutated patients (19.76 vs 14.28, p = 0.20; Figure S1(A)). Notably, FPR-H patients demonstrated consistently lower DCR compared to FPR-L counterparts across KRAS subtypes (wild-type: 71.43% vs 86.67%, p = 0.56; mutated: 72.73% vs 85.96%, p = 0.20; Figure S1(B) and (C)). Kaplan–Meier analysis showed that FPR-H was marginally associated with unsatisfactory PFS in both KRAS wild-type (mPFS: 4 vs 10 months, plog-rank = 0.04; Figure S1(D)) and mutated subgroups (mPFS: 5 vs 10 months, plog-rank < 0.01; Figure S1(E)). MSS patients with FPR-H showed a significantly reduced DCR (65.71% vs 85.71%, p = 0.01; Figure 2(l)) and shorter PFS (mPFS: 5 vs 12 months, plog-rank < 0.001; Figure 2(m)) compared to FPR-L cases.
Dynamic monitoring of FPR and progression of Bev/CT-treated mCRC
In this study, we observed that pre-treatment FPR levels in patients with PD were significantly higher than those of patients with DCR (median: 22.20 vs 16.47, p < 0.01; Figure 3(a)). Longitudinal analysis showed a marked reduction in FPR from pre-treatment to On-DCR time point (median: 17.05 vs 13.99, p < 0.001); conversely, FPR showed a significant increase at On-PD compared to baseline levels (median: 21.10, p = 0.02; Figure 3(b)).

Dynamic changes in FPR for monitoring disease progression in mCRC patients treated with first-line Bev/CT. (a) Pre-treatment FPR comparison in DCR and PD patients. (b) Longitudinal FPR changes across pre-treatment, on-DCR, on-PD time-points. (c) Median time to progression comparison monitored by FPR and imaging detection. (d, e) Temporal FPR dynamics in discovery cohort. (f, g) Temporal FPR dynamics in internal validation cohort. (h, i) Temporal FPR dynamics in external validation cohort. (j–l) Kaplan–Meier analysis of FPR dynamic change in the discovery (j), internal validation (k), and external validation (l) cohorts.
In the discovery cohort, most patients (60.5%) maintained continuous FPR-L, of whom 84% achieved DCR. Among those transitioning from pre-treatment FPR-H to post-treatment FPR-L, 87% exhibited SD or PR (Figure 3(d)). Conversely, 45% of PD patients had baseline FPR-H, and 52% maintained persistently high FPR (Figure 3(d)). Longitudinal analysis showed that proportions of FPR-H were 35%, 9%, and 37% at pretreatment, On-DCR, and On-PD time-points, respectively (Figure 3(e)). Furthermore, post-treatment FPR-L was associated with significantly longer PFS compared to FPR-H (mPFS: 9 vs 4 months, plog-rank < 0.01; Figure 3(j)). In the internal validation cohort, 24 patients showed PD as a clinical response to Bev/CT therapy, with 46% presenting baseline FPR-H, and 8 patients displayed persistently elevated FPR at the On-PD time point (Figure 3(f)). Of patients transitioning from FPR-H to FPR-L, 81% achieved DCR (Figure 3(f)). Sixty patients included in longitudinal analysis showed 80% of them with pre-treatment FPR-L, 92% and 18% of them harbored FPR-L and FPR-H at On-DCR and On-PD time-point, respectively (Figure 3(g)). Persistent FPR-H was associated with poor PFS (mPFS: 3 vs 12 months, plog-rank < 0.001), while continuous FPR-L correlated with optimal survival (Figure 3(k)).
These findings were also observed in the external validation cohort, where 74 patients showed DCR as a clinical response to Bev/CT therapy, with 78% presenting baseline FPR-L, and 56 patients maintaining persistent FPR-L throughout treatment (Figure 3(h)). Ten patients transitioned from FPR-H to FPR-L, with 90% achieving SD (Figure 3(h)). FPR-L prevalence shifted characteristically with disease status changes (pre-treatment: 71%; On-DCR: 88%; On-PD: 61%; Figure 3(i)). Persistent FPR-H predicted markedly worse PFS versus post-treatment FPR-L (mPFS: 5 vs 9 months, plog-rank = 0.03), while continuous FPR-L was associated with the best outcome (12 months; Figure 3(l)). Moreover, the median positive time of FPR-H appearance was significantly earlier than CT/MRI detection (2 vs 3 months, p < 0.001; Figure 3(c)).
FPR and therapeutic decision
All PFS comparisons between first-line CT and Bev/CT were evaluated using data after 1:1 propensity score matching. In the CT cohort, median PFS was significantly longer in FPR-L than in FPR-H patients (9 vs 5 months, plog-rank = 0.02; Figure 4(a)). The Bev/CT cohort showed significantly improved overall PFS versus CT (Figure S3(A)), particularly in the FPR-L subgroup (plog-rank < 0.01; Figure 4(a)). However, no significant PFS benefit was observed with Bev/CT in FPR-H patients compared to CT alone (plog-rank = 0.46; Figure 4(a)). In FPR-L patients, first-line Bev/OX-treated cases harbored superior survival compared to those with treatment of CT-OX (plog-rank = 0.01; Figure 4(b)). No significant difference in PFS was observed between IRI-treated regimens with or without Bev in FPR-L cases, or between CT-OX and CT-IRI in FPR-H patients (Figure 4(b) and Figure S3(B)).

Comprehensive analysis of Bev-based therapy outcomes stratified by FPR in overall populations. (a) PFS comparison between Bev/CT- and CT-treated mCRC patients stratified by FPR following propensity score matching. (b) PFS comparison between FPR-L mCRC patients treated with OX or IRI with or without Bev following propensity score matching, (c, d) Clinical response to Bev/CT regimen and PFS in right- and left-sided mCRC patients stratified by FPR. (e, f) Clinical response to Bev/CT regimen and PFS in Bev/OX- and Bev/IRI-treated mCRC patients stratified by FPR. (g, h) Clinical response to Bev/CT regimen and PFS in non-palliation surgical- and surgical-treated mCRC patients stratified by FPR. (i–l) PFS comparison between FPR-L and FPR-H mCRC patients treated with OX or IRI with or without Bev following propensity score matching (i, j: FPR-L patients with or without palliative surgery; k, l: FPR-H patients with or without palliative surgery).
We subsequently assessed the treatment benefits of Bev/CT within the original, non-matched Bev/CT population and found that among left-sided mCRC patients, those with FPR-H showed significantly lower DCR than those with FPR-L (67.78% vs 85.27; p < 0.001; Figure 4(c)). However, these differences did not reach statistical significance in right-sided mCRC patients. PFS was consistently better in FPR-L patients regardless of tumor location, while no significant PFS difference was observed between left- and right-sided tumors within the same FPR subgroup (Figure 4(d)). No significant difference in DCR was found between Bev/OX and Bev/IRI treatment in either FPR-L (85.64% vs 83.46%) or FPR-H (71.56% vs 71.43%) subgroups. However, both regimens achieved higher DCR in FPR-L patients compared to FPR-H (Figure 4(e)). Bev/OX-treated FPR-L patients exhibited superior PFS compared to all other subgroups, while Bev/OX- and Bev/IRI-treated FPR-H patients showed similar outcomes (Figure 4(f)). Patients undergoing palliative resection with FPR-L status exhibited significantly higher DCR compared to those with FPR-H (87.15% vs 70.51%; p < 0.01) and non-surgical patients (87.15% vs 77.50%; p = 0.048; Figure 4(g)). Surgical FPR-L patients also demonstrated the best PFS (mPFS: 11 months), followed by non-surgical FPR-L patients (8 months; plog-rank < 0.01), while non-surgical FPR-H patients had the poorest outcomes (7 months; plog-rank < 0.001; Figure 4(h)).
In the propensity score-matched analysis, surgical FPR-L patients receiving Bev/OX showed significantly longer PFS compared to CT-OX or Bev/IRI (13 vs 8.5 vs 10 months, respectively; plog-rank < 0.01; Figure 4(i)). However, this survival advantage was not observed in non-surgical FPR-L patients (Figure 4(j)) or in FPR-H patients regardless of surgical status (Figure 4(k) and (l)). No survival difference was detected between Bev/IRI and CT-IRI in any subgroup (Figure 4(i)–(l)).
Discussion
Cancer-derived inflammation has been shown to induce resistance to CT and tyrosine kinase inhibitors.27,34 However, its role in Bev-based therapy for mCRC patients remains unclear. In this study, we demonstrated that cancer-derived high-grade inflammation is associated with both intrinsic and acquired resistance to Bev. The FPR reliably reflected tumor burden and emerged as a practical biomarker for evaluating treatment response, predicting prognosis, monitoring disease progression, and guiding therapeutic decision-making in Bev/CT treatment.
FPR, which integrates information on inflammation, nutrition, and coagulation, 35 was significantly correlated with primary tumor size, metastatic burden, and surgical history in this study, which are consistent with our previous findings in early-stage CRC. 25 Although palliative surgery is associated with 1-year OS, its impact on long-term OS remains undefined. Importantly, it showed no consistent association with PFS or treatment response across any cohort. This indicates that palliative surgery does not confound the primary findings of our study regarding the predictive value of the FPR biomarker for initial treatment efficacy. Notably, elevated FPR was consistently associated with approximately a twofold increased risk of disease progression across all cohorts and subgroups, including exploratory analyses stratified by KRAS status and MSS, supporting its robustness as a prognostic biomarker. Furthermore, high FPR remains an independent risk factor for 1-year mortality in the overall population.
Several systemic inflammatory biomarkers, such as NLR, platelet-to-lymphocyte ratio, LMR, and modified Glasgow prognostic score, have emerged as informative markers for predicting treatment efficacy and prognosis in mCRC.36–40 Encouragingly, we also found that FPR could effectively monitor disease progression during Bev/CT treatment. Moreover, the median positive time of FPR elevation was significantly earlier than that of traditional imaging-based detection methods, suggesting its potential utility for early intervention. Furthermore, among surgical mCRC patients within the FPR-L subgroup, those receiving Bev/OX treatment exhibited superior DCR and PFS compared to those treated with Bev/IRI. By contrast, propensity score matching analysis revealed that patients with FPR-H derived limited benefit from Bev regardless of the CT backbone, suggesting that CT-OX or CT-IRI may represent a more appropriate therapeutic strategy for this subgroup.
Although Bev/CT is the standard first-line therapy for mCRC, approximately 10%–20% of patients exhibit intrinsic resistance.41–43 We confirmed that elevated FPR levels are associated with innate resistance to Bev, effectively negating the survival benefit of adding Bev to CT. Furthermore, increasing FPR levels were correlated with reduced treatment response, and nearly one-third of patients experiencing disease progression showed elevated FPR at the time of progression, implicating cancer-derived inflammation in both intrinsic and acquired resistance mechanisms.
To the best of our knowledge, this is the first study to establish the FPR as a comprehensive biomarker of inflammation-associated Bev resistance in mCRC. However, several limitations should be addressed. First, as a single-center study with a limited sample size, the statistical power was insufficient to perform robust subgroup analyses, particularly those stratified by MSI and KRAS status. Second, given the current immaturity of the 3-year and 5-year OS data, we consequently selected 1-year OS as a key secondary endpoint. The results consistently demonstrated that elevated FPR is an independent risk factor for disease progression. Active follow-up of patients is ongoing, and the long-term survival outcomes will be reported in a future publication. Third, although an FPR cutoff value of 24.1 was identified and internally validated across several Bev-based and CT-only cohorts, its generalizability requires confirmation in external populations. Finally, while our previous work suggested the superiority of FPR over other inflammatory indices (NLR, LMR, and SII), the current study did not include direct comparative analyses among these biomarkers. Therefore, to fully address these limitations and validate our conclusions, a large-scale, multicenter, prospective randomized controlled trial is warranted.
Conclusion
Cancer-derived inflammation attenuates the efficacy of Bev in mCRC. FPR serves as a noninvasive and clinically applicable biomarker that can evaluate Bev response, predict prognosis, monitor disease progression, and guide therapeutic decisions in mCRC patients receiving first-line Bev/CT.
Supplemental Material
sj-doc-2-tam-10.1177_17588359251411086 – Supplemental material for Cancer-derived inflammation is associated with bevacizumab resistance and inferior clinical outcomes in patients with metastatic colorectal cancer
Supplemental material, sj-doc-2-tam-10.1177_17588359251411086 for Cancer-derived inflammation is associated with bevacizumab resistance and inferior clinical outcomes in patients with metastatic colorectal cancer by Ya-Nan Li, Yang Wu, Feng-Wen Deng, Ying Lu, Guo-Bin Song, Lin Xiang, Tian Peng, Xue-Xin Cheng and Hou-Qun Ying in Therapeutic Advances in Medical Oncology
Supplemental Material
sj-docx-1-tam-10.1177_17588359251411086 – Supplemental material for Cancer-derived inflammation is associated with bevacizumab resistance and inferior clinical outcomes in patients with metastatic colorectal cancer
Supplemental material, sj-docx-1-tam-10.1177_17588359251411086 for Cancer-derived inflammation is associated with bevacizumab resistance and inferior clinical outcomes in patients with metastatic colorectal cancer by Ya-Nan Li, Yang Wu, Feng-Wen Deng, Ying Lu, Guo-Bin Song, Lin Xiang, Tian Peng, Xue-Xin Cheng and Hou-Qun Ying in Therapeutic Advances in Medical Oncology
Footnotes
Acknowledgements
We extend our sincere gratitude to Dr Ming-Feng Fu for his support during this study. We also deeply appreciate all the patients who participated in this work.
Declarations
ORCID iDs
Supplemental material
Supplemental material for this article is available online.
References
Supplementary Material
Please find the following supplemental material available below.
For Open Access articles published under a Creative Commons License, all supplemental material carries the same license as the article it is associated with.
For non-Open Access articles published, all supplemental material carries a non-exclusive license, and permission requests for re-use of supplemental material or any part of supplemental material shall be sent directly to the copyright owner as specified in the copyright notice associated with the article.