
Abstract
Background:
Head and neck squamous cell carcinoma (HNSCC) remains a global health challenge with rising incidence, especially in HPV-associated subtypes. The mismatch repair (MMR) system maintains genomic stability, and its deficiency has been linked to tumor immunogenicity and response to immunotherapy in several cancers. However, its role in HNSCC, particularly in the context of HPV status, remains poorly defined.
Objectives:
The aim of this study was to compare the imbalance expression of MMR proteins and their association with clinical features and survival in HNSCC.
Design:
A retrospective, clinicopathological correlation study.
Methods:
We retrospectively analyzed 369 HNSCC specimens. Tissue microarrays were constructed and immunohistochemically stained for four key MMR proteins (MSH2, MSH6, PMS2, and MLH1) and p16 (as an HPV surrogate). Expression patterns were correlated with clinicopathological variables, immune cell infiltration, and survival outcomes.
Results:
Among all HNSCC patients, MMR protein expression was preserved in all but one case. MSH2 and PMS2 showed consistently higher nuclear positivity than their partners, MSH6 and MLH1. These imbalances were more pronounced in p16-negative tumors (p < 0.001), whereas p16-positive tumors showed balanced expression. Expression patterns varied by sex, tumor site, drinking history, and AJCC stage. Moreover, MSH6 was significantly lower than MSH2 in nondrinkers (p = 0.039), and PMS2 was lower in advanced-stage patients (p = 0.023). Immunologically, MSH2 expression positively correlated with CD8⁺ T cells in nontumor tissue, while MSH6 and PMS2/MLH1 ratios were inversely correlated with CD4⁺ T cells in tumor tissue. Kaplan–Meier survival analysis revealed that lower MSH2 expression was significantly associated with improved overall survival (p = 0.030).
Conclusion:
MMR protein expression in HNSCC varies by HPV status and demographic factors and is linked to differential immune infiltration. These findings suggest that MMR protein imbalance may influence tumor immunogenicity and could potentially serve as a biomarker to inform therapeutic strategies in the immunotherapy era, especially in p16-negative tumors.
Keywords
Introduction
Head and neck squamous cell carcinoma (HNSCC) is a significant global health burden, ranking as the sixth most common malignancy worldwide, with approximately 943,456 new cases and 482,001 deaths reported in 2022. 1 In China, HNSCC accounted for an estimated 145,600 new cases and 72,200 deaths, making it the country’s eighth most prevalent cancer. 2 HNSCC originates from the mucosal epithelium of the head and neck region and includes subtypes such as cancers of the oral cavity, larynx, nasopharynx, oropharynx, and hypopharynx, with squamous cell carcinoma comprising over 95% of cases. The disease is etiologically heterogeneous: while tobacco and alcohol use remain key risk factors, the incidence of HPV-related oropharyngeal cancers (OPC)—especially those linked to HPV-16—has increased in recent decades. This has led to the recognition of two biologically distinct subtypes of HNSCC: HPV positive and HPV negative.3,4
HPV-positive HNSCC is characterized by distinct molecular and immunological features, including improved prognosis, enhanced radiosensitivity, and increased infiltration of immune cells.3,4 These tumors often harbor fewer mutations in traditional oncogenes and tumor suppressor genes but demonstrate unique alterations in host–virus interactions. As immunotherapy becomes increasingly integral to the management of advanced HNSCC, the underlying mechanisms that govern tumor immunogenicity—including DNA repair deficiencies—are receiving heightened attention. Notably, genomic instability driven by impaired DNA repair, particularly mismatch repair (MMR), has been associated with increased tumor mutational burden and improved response to immune checkpoint inhibitors (ICIs) across various cancer types. Some study indication that inherited alterations of the DNA MMR pathway may modify toxicity and response to chemoradiation in HNSCC. However, the relationship between MMR and prognosis in HNSCC is still not very clear. Some researchers have found that MMR deficiency is likely to be sporadic in HNSCC.5,6 Given the unique viral etiology of HPV-positive HNSCC, it remains unclear whether host DNA repair mechanisms are disrupted in these tumors. Notably, virus-associated malignancies have shown distinct responses to ICIs; however, the relationship between DNA repair abnormalities and immunotherapy efficacy in HPV-positive HNSCC has yet to be explored.3,4
The DNA MMR system is a highly conserved mechanism that safeguards genomic integrity by correcting replication-associated errors such as base mismatches and small insertion–deletion loops.7–9 Deficiencies in MMR (dMMR) result in microsatellite instability (MSI), a mutator phenotype implicated in the pathogenesis of several cancers. Clinically, dMMR/MSI-high (MSI-H) tumors are most well-characterized in colorectal cancer (CRC), where they are associated with a favorable prognosis and enhanced responsiveness to ICIs.10,11 Consequently, MSI status now guides treatment decisions in CRC and other solid tumors, offering a paradigm for precision oncology.
The DNA MMR pathway is essential for maintaining genomic integrity by correcting replication errors such as base–base mismatches and insertion–deletion loops. Four key proteins—MLH1, MSH2, MSH6, and PMS2—constitute the core machinery of this system. MSH2 functions as a central sensor by forming heterodimers with MSH6 or MSH3, giving rise to the MutSα and MutSβ complexes, which recognize single-base mismatches and insertion–deletion loops of varying sizes, respectively. MSH6 is critical within the MutSα complex, primarily recognizing base–base mismatches and small insertion–deletion loops. Following mismatch recognition, MLH1 forms a heterodimer with PMS2 to generate the MutLα complex, which coordinates downstream repair steps, including strand excision and resynthesis. Notably, PMS2 harbors intrinsic endonuclease activity, enabling the introduction of nicks in the nascent DNA strand to facilitate repair. Dysfunction of any of these proteins, whether through germline mutations or somatic inactivation, disrupts MMR, leading to MSI, mutational accumulation, and ultimately carcinogenesis.11–16
The MMR system comprises two essential heterodimeric complexes: MutSα (MSH2–MSH6), which detects mismatches, and MutLα (MLH1–PMS2), which coordinates downstream repair processes including excision and resynthesis.17–20 Disruption in either component compromises genomic fidelity and promotes carcinogenesis. Moreover, recent evidence suggests that oncogenic viruses, such as HPV, may interact with MMR pathways—either through direct viral protein interference or through modulation of host DNA repair responses—potentially influencing tumor development and immune landscape in HPV-related HNSCC. However, the precise nature of this interaction remains insufficiently defined.
In this context, our study sought to investigate the clinicopathological relevance of MMR alterations in HNSCC, particularly in relation to HPV status. We retrospectively analyzed 369 HNSCC tissue samples collected from hospitalized patients in China between 2008 and 2018. By evaluating p16 expression via immunohistochemical (IHC) staining as a surrogate marker for HPV status, we aimed to explore correlations between MMR status, clinical outcomes, and demographic and etiological factors such as sex, age, tumor site, AJCC stage, and history of smoking and alcohol use. Clarifying these relationships may uncover novel biomarkers and inform tailored therapeutic strategies, particularly in the era of immunotherapy.
Materials and methods
Patient and ethical review
The study protocol was approved by the Institutional Research Ethics Committee of Sun Yat-sen University Cancer Center (SL-B2025-350-01). The specimens collected for this study were from 369 patients diagnosed and treated at Sun Yat-sen University Cancer Center, admitted between 2008 and 2018, who underwent surgery for resection of HNSCC (including subsites located in the oral cavity, oropharynx, larynx, or hypopharynx). Comprehensive studies of clinicopathological features, MMR protein expression, immune cell correlation, and prognosis were planned for the whole cohort and subgroup/subsite cohorts. The criteria for inclusion and exclusion of cases were as follows.
The inclusion criteria are as follows: (1) Clinical diagnosis and biopsy confirmed primary HNSCC located in the oral cavity, oropharynx, larynx, or hypopharynx. (2) Patients with complete medical information, including age, sex, smoking/drinking, Tumor/Node/Metastasis stage (TNM stage), AJCC stage, location of the tumor, follow-up (>5 years), time of admission, and discharge. (3) No other primary cancers at the time of diagnosis. The exclusion criteria are as follows: (1) Patient with inadequate formalin-fixed paraffin-embedded (FFPE) tissue blocks or incomplete medical records. (2) The HNSCC tumor was found to be a metastatic tumor from elsewhere.
Tissue microarray construction and IHC staining
To construct the tissue microarray (TMA) blocks, FFPE tissue blocks from 369 HNSCC patients were retrieved and examined by independent pathologists. Representative regions of invasive tumor tissue containing prognostically relevant cells were carefully selected. Tissue pairs of HNSCC tissue and adjacent tissue were arrayed onto slides in 2:1 ratio for subsequent IHC staining and evaluation. Each TMA slide consists of arrayed tissue cores from 41 to 50 patients (2 tumor tissue cores and 1 tumor adjacent core from each patient; Supplemental Figure 1). IHC staining was performed using the following primary antibodies: MSH2 (ZSGB-BIO®, Beijing, China; ZA-0622, 1:2000), MSH6 (Roche Diagnostics GmbH®, Indianapolis, IN, USA; SP93, ready-to-use), PMS2 (Dako®, Santa Clara, CA, USA; EP51, ready-to-use), MLH1 (Dako®, Santa Clara, CA, USA; ES05, ready-to-use), CD4 (Abcam, Cambridge, UK; ab133616, 1:2000), CD8 (SinoBiological, Beijing, China; 10980-R081, 1:500), and Foxp3 (Abcam, Cambridge, UK; ab191416, 1:1000). To preserve antigenicity, the initial 500 μm of paraffin was trimmed from each block. Subsequently, 4-μm thick sections were cut, mounted onto slides, deparaffinized in xylene, and rehydrated through a descending ethanol gradient. Antigen retrieval was performed using a high-pH buffer (Dako®; S2367) by incubating the slides in a heated water bath for 30 min, followed by a 20-min cooling period at room temperature. The sections were then rinsed in phosphate-buffered saline (PBS) and treated with 3% hydrogen peroxide for 30 min to block endogenous peroxidase activity. This was followed by overnight incubation with the primary antibodies at 4℃.
The slides were washed with PBS and incubated with the EnVision detection reagent (Dako®; K406189-2, ready-to-use) for 30 min on the following day. After a final PBS wash, chromogenic detection was carried out using 3,3′-diaminobenzidine tetrahydrochloride (Dako®; S196730-2) for 5 min. The sections were then counterstained with Harris’s hematoxylin for 10 s, dehydrated through graded ethanol, cleared in xylene, and mounted with coverslips. Appropriate positive and negative controls were included for each staining run in accordance with the manufacturer’s recommendations.
Demographic and clinical data collection
Demographic and clinical data were retrieved from the electronic medical record system of Sun Yat-sen University Cancer Center. Collected patient characteristics included sex, age, diagnosis, location of disease, TNM stage, AJCC stage, treatment details, smoking history, and alcohol consumption. p16 status was assessed by immunohistochemistry using a p16 antibody (Cell Signaling Technology, Danvers, MA, USA; #68410, 1:50 dilution); cases were considered p16-positive if ⩾60% of tumor cells exhibited nuclear staining. Survival information was obtained through telephone follow-up and the electronic medical record system. Overall survival (OS) and disease-free survival were calculated from the date of diagnosis to the date of death, disease recurrence, or last follow-up. All patients received standard-of-care treatment based on NCCN guidelines at that time for their disease stage, primarily involving surgical resection with or without adjuvant (chemo) radiotherapy.21–23 A schematic overview of the study is presented in Figure 1.

Illustrative schematic of the study.
IHC evaluation
For the evaluation of MSH2, MSH6, PMS2, MLH1, 10 fields per histological section were photographed at 400× magnification. 24 The images were exported to the ImageJ® software (Bethesda, MD, USA) and the percentage of stained cells was determined with the cell counter command. All IHC slides were evaluated independently by two board-certified pathologists who were blinded to all clinical and pathological data. The final score for each core was determined by averaging the counts from both observers. In cases of significant discrepancy, the slides were re-examined simultaneously by both pathologists using a multi-headed microscope to reach a consensus. Tissue cores from the TMA that did not include tumor regions or showed no tumor tissue under the microscope were excluded from the statistical analysis of positivity rates. Following IHC staining, all slides were evaluated for tumor content. Cores were deemed eligible for analysis only if sufficient tumor cells were present. Since there are two tumor tissue cores for each patient and backup blocks from the tissue bank, thus the ineligible cores do not affect the final analysis result. Evaluation of staining results was performed by pathologists. Briefly, MSH2 (ZSGB-BIO®; ZA-0622, 1:2000), MSH6 (Roche Diagnostics GmbH®; SP93, ready-to-use), PMS2 (Dako®; EP51, ready-to-use), MLH1 (Dako®; ES05, ready-to-use), CD4 (Abcam; ab133616, 1:2000), CD8 (SinoBiological; 10980-R081, 1:500), and Foxp3 (Abcam; ab191416, 1:1000) antibodies were used to immunohistochemically stain the TMA slides, with brown staining considered as positive immunoreaction and blue staining considered as negative immunoreaction (nuclear, cytoplasm, or membrane, based on cells of interest). Immunohistochemistry staining for p16 (Cell Signaling Technology; #68410, 1:50) was conducted with a 60% staining cutoff. ImageJ was used for the counting of IHC positively stained cells. For result interpretation, the cutoff for MMR expression groups was set as the median expression value across the entire cohort. The average number of CD4/CD8/FoxP3-positive cells per mm2 were calculated for each case. Correlations between MMR protein expression and immune cell densities were assessed using Pearson’s correlation coefficient.
Statistical analysis and data visualization
Statistical analyses and data visualization were performed using SPSS software version 20.0 (IBM Corp., Armonk, NY, USA), GraphPad Prism version 9.0 (GraphPad Software, San Diego, CA, USA), and R Studio version 1.1.463 (R Foundation, Vienna, Austria). Comparisons between two variables were conducted using the Student’s t test. Pearson correlation coefficients were calculated to assess bivariate relationships among the studied variables. Kaplan–Meier survival curves were generated to estimate OS, and differences between groups were evaluated using the log-rank test. For survival analysis, the expression levels of MMR proteins were dichotomized into high and low groups based on median expression values as the cutoff. A two-tailed p-value < 0.05 was considered statistically significant. An illustrative schematic (Figure 1) of the study was created in BioRender (Yang C. (2025) https://BioRender.com/m2h5awz). This study is in line with the Strengthening the Reporting of Observational Studies in Epidemiology (STROBE) guidelines.
Artificial intelligence policy statement
No generative artificial intelligence tools, such as ChatGPT, were used at any stage in the creation of the text, references, images, or any other content within this manuscript. The authors take full responsibility for the accuracy, originality, and integrity of all submitted work.
Results
Clinicopathologic overview and MMR immunophenotyping
We retrospectively analyzed 369 HNSCC samples collected between 2008 and 2018, comprising 160 oral cavity cancer (OCC), 41 OPC, 84 hypopharyngeal cancers (HPC), and 84 laryngeal cancers (LC). All specimens were incorporated into TMAs and assessed by immunohistochemistry for four MMR proteins: MSH2, MSH6, PMS2, and MLH1. Representative staining images were captured, and nuclear positivity was quantified. All but one sample showed preserved MMR protein expression. The average proportion of positively stained cells for each DNA MMR protein across tumor types was as follows: MSH2—75% (29%–99%) in OCC, 85% (38%–100%) in OPC, 83% (0%–99%) in HPC, and 76% (27%–96%) in LC; MSH6—61% (3%–98%), 80% (20%–97%), 72% (18%–98%), and 74% (17%–98%), respectively; PMS2—75% (3%–96%), 81% (13%–98%), 83% (33%–98%), and 77% (17%–98%); and MLH1—65% (5%–98%), 82% (33%–100%), 66% (18%–98%), and 73% (9%–98%). As shown in Figure 2.

Representative IHC staining images of MMR proteins. Representative IHC image for MSH2, MSH6, PMS2, and MLH1 stained cells in (a) OCC, (b) OPC, (c) HPC, and (d) LC.
Association between MMR protein expression and clinical variables in HNSCC
Patients were initially stratified into p16-positive (n = 57) and p16-negative (n = 312) groups, and the nuclear positivity rates of MutSα (MSH2 and MSH6) and MutLα (PMS2 and MLH1) proteins were compared between these two cohorts. As illustrated in Figure 3, although the underlying tumorigenesis may differ between p16-positive and p16-negative HNSCC, no significant differences in the nuclear positivity of either MutSα or MutLα proteins were observed between the groups.

Differential expression of each MMR protein in p16+ and p16− HNSCC. (a) Comparison of MSH2-positive cell percentage between in p16− and p16+ HNSCC (77.89% ± 17.67% vs 80.67% ± 17.34%, p = 0.284). (b) Comparison of MSH6-positive cell percentage between in p16− and p16+ HNSCC (67.88% ± 22.80% vs 72.84% ± 24.15%, p = 0.143). (c) Comparison of MSH2/MSH6 positive staining ratio between p16− and p16+ HNSCC (1.381 ± 0.906 vs 1.650 ± 2.767, p = 0.195). (d) Comparison of PMS2-positive cell percentage between p16− and p16+ HNSCC (78.10% ± 19.22% vs 78.43% ± 18.65%, p = 0.904). (e) Comparison of MLH1-positive cell percentage between p16− and p16+ HNSCC (68.14% ± 23.18% vs 72.42% ± 23.62%, p = 0.212). (f) Comparison of PMS2/MLH1 positive staining ratio between p16− and p16+ HNSCC (1.453 ± 1.467 vs 1.254 ± 0.817, p = 0.333).
Subsequently, we examined the associations between other clinical variables and MutSα/MutLα expression across the full cohort. The findings are detailed in Supplemental Tables 1–3. Overall, MSH2 positivity was consistently higher than MSH6, and PMS2 was more frequently expressed than MLH1.
Subgroup analysis of MMR protein expression and clinical characteristics
We next performed a subgroup analysis within the p16-positive HNSCC cohort. The expression balance between MSH2 and MSH6 (MutSα), as well as between MLH1 and PMS2 (MutLα), appeared relatively stable in this group, with no significant imbalance detected (Figure 4(a)–(c)). Further analysis of clinical variables in relation to these expression ratios is shown in Supplemental Tables 4–6. Most clinical factors did not significantly influence MMR protein expression. However, among nondrinkers, MSH6 expression was significantly lower than MSH2 (p = 0.039), and patients with advanced-stage disease (AJCC III–IV) exhibited significantly lower PMS2 expression compared to early-stage cases (AJCC I–II; p = 0.023).

Differential expression pattern of MutLa, MutSa, and their ratio in p16+ and p16− HNSCC. (a) Comparison of MSH2-positive and MSH6-positive cell percentage in p16+ HNSCC (80.67% ± 17.34% vs 72.84% ± 24.15%, p = 0.053). (b) Comparison of PMS2-positive and MLH1-positive cell percentage in p16+ HNSCC (78.44% ± 18.65% vs 72.42% ± 23.62%, p = 0.141). (c) Comparison of MSH2/MSH6 positive staining ratio and PMS2/MLH1 positive staining ratio in p16+ HNSCC (1.650 ± 2.767 vs 1.253 ± 0.817, p = 0.314). (d) Comparison of MSH2-positive and MSH6-positive cell percentage in p16− HNSCC (77.89% ± 17.67% vs 67.88% ± 22.80%, p < 0.001). (e) Comparison of PMS2-positive and MLH1-positive cell percentage in p16− HNSCC (78.10% ± 19.22% vs 68.14% ± 23.18%, p < 0.001). (f) Comparison of MSH2/MSH6-positive staining ratio and PMS2/MLH1 positive staining ratio in p16− HNSCC (MSH2/MSH6 = 1.381 ± 0.906 vs 1.453 ± 1.467, p = 0.493).
In contrast, analysis of the p16-negative subgroup revealed notable imbalances in MMR protein expression. As shown in Figure 4(d)–(f), MSH6 expression was significantly lower than MSH2 (p < 0.001), and MLH1 expression was significantly lower than PMS2 (p < 0.001). Further breakdown of clinical variables and their associations with MMR protein expression in the p16-negative group is presented in Supplemental Tables 7–9.
Association between MMR protein balance and tumor subsite in HNSCC
We further examined the relationship between MMR protein balance and different anatomical subtypes of HNSCC, as shown in Figure 5. In OPC and LC, the expression of MutSα (MSH2/MSH6) and MutLα (PMS2/MLH1) proteins appeared relatively balanced, with no significant differences observed. However, a distinct imbalance was identified in oral cavity cancer (OCC) and HPC. In OCC, MSH2 expression was significantly higher than MSH6 (p < 0.001), and PMS2 expression exceeded that of MLH1 (p < 0.001). A similar pattern was seen in HPC, where MSH2 was significantly higher than MSH6 (p < 0.001), and PMS2 was significantly higher than MLH1 (p < 0.001). These findings may suggest that, despite being grouped under HNSCC, tumors from different subsites may exhibit distinct DNA MMR profiles and potentially divergent pathogenic mechanisms.

Differential expression pattern of MutLa, MutSa, and their ratio in different anatomical subtypes of HNSCC. (a) Differential expression pattern of MSH2 versus MSH6, MLH1 versus PMS2, and MSH2/MSH6 ratio versus PMS2/MLH1 ratio in OCC (left: p < 0.001, middle: p < 0.001, right: p = 0.194). (b) Differential expression pattern of MSH2 versus MSH6, MLH1 versus PMS2, and MSH2/MSH6 ratio versus PMS2/MLH1 ratio in OPC (left: p = 0.102, middle: p = 0.737, right: p = 0.098). (c) Differential expression pattern of MSH2 versus MSH6, MLH1 versus PMS2, and MSH2/MSH6 ratio versus PMS2/MLH1 ratio in HPC (left: p < 0.001, middle: p < 0.001, right: p = 0.085). (d) Differential expression pattern of MSH2 versus MSH6, MLH1 versus PMS2, and MSH2/MSH6 ratio versus PMS2/MLH1 ratio in LC (left: p = 0.476, middle: p = 0.220, right: p = 0.671).
MMR protein expression and its correlation with immune cell infiltration
We further explored the associations between four MMR proteins (MSH2, MSH6, PMS2, and MLH1), their expression ratios (MSH2/MSH6 and PMS2/MLH1), and immune cell subsets. Representative IHC images of inflammatory cells are shown in Supplemental Figure 2. MSH2 expression was positively correlated with CD8+ T-cell infiltration in nontumor tissues (Figure 6(a)), while MSH6 expression showed a negative correlation with CD4+ T-cell infiltration in tumor tissues (Figure 6(b)). No significant correlations were observed between PMS2, MLH1, or the MSH2/MSH6 ratio and any immune cell subset (Figure 6(c)–(e)). However, the PMS2/MLH1 ratio was negatively correlated with CD4⁺ T-cell infiltration in tumor tissues (Figure 6(f)).
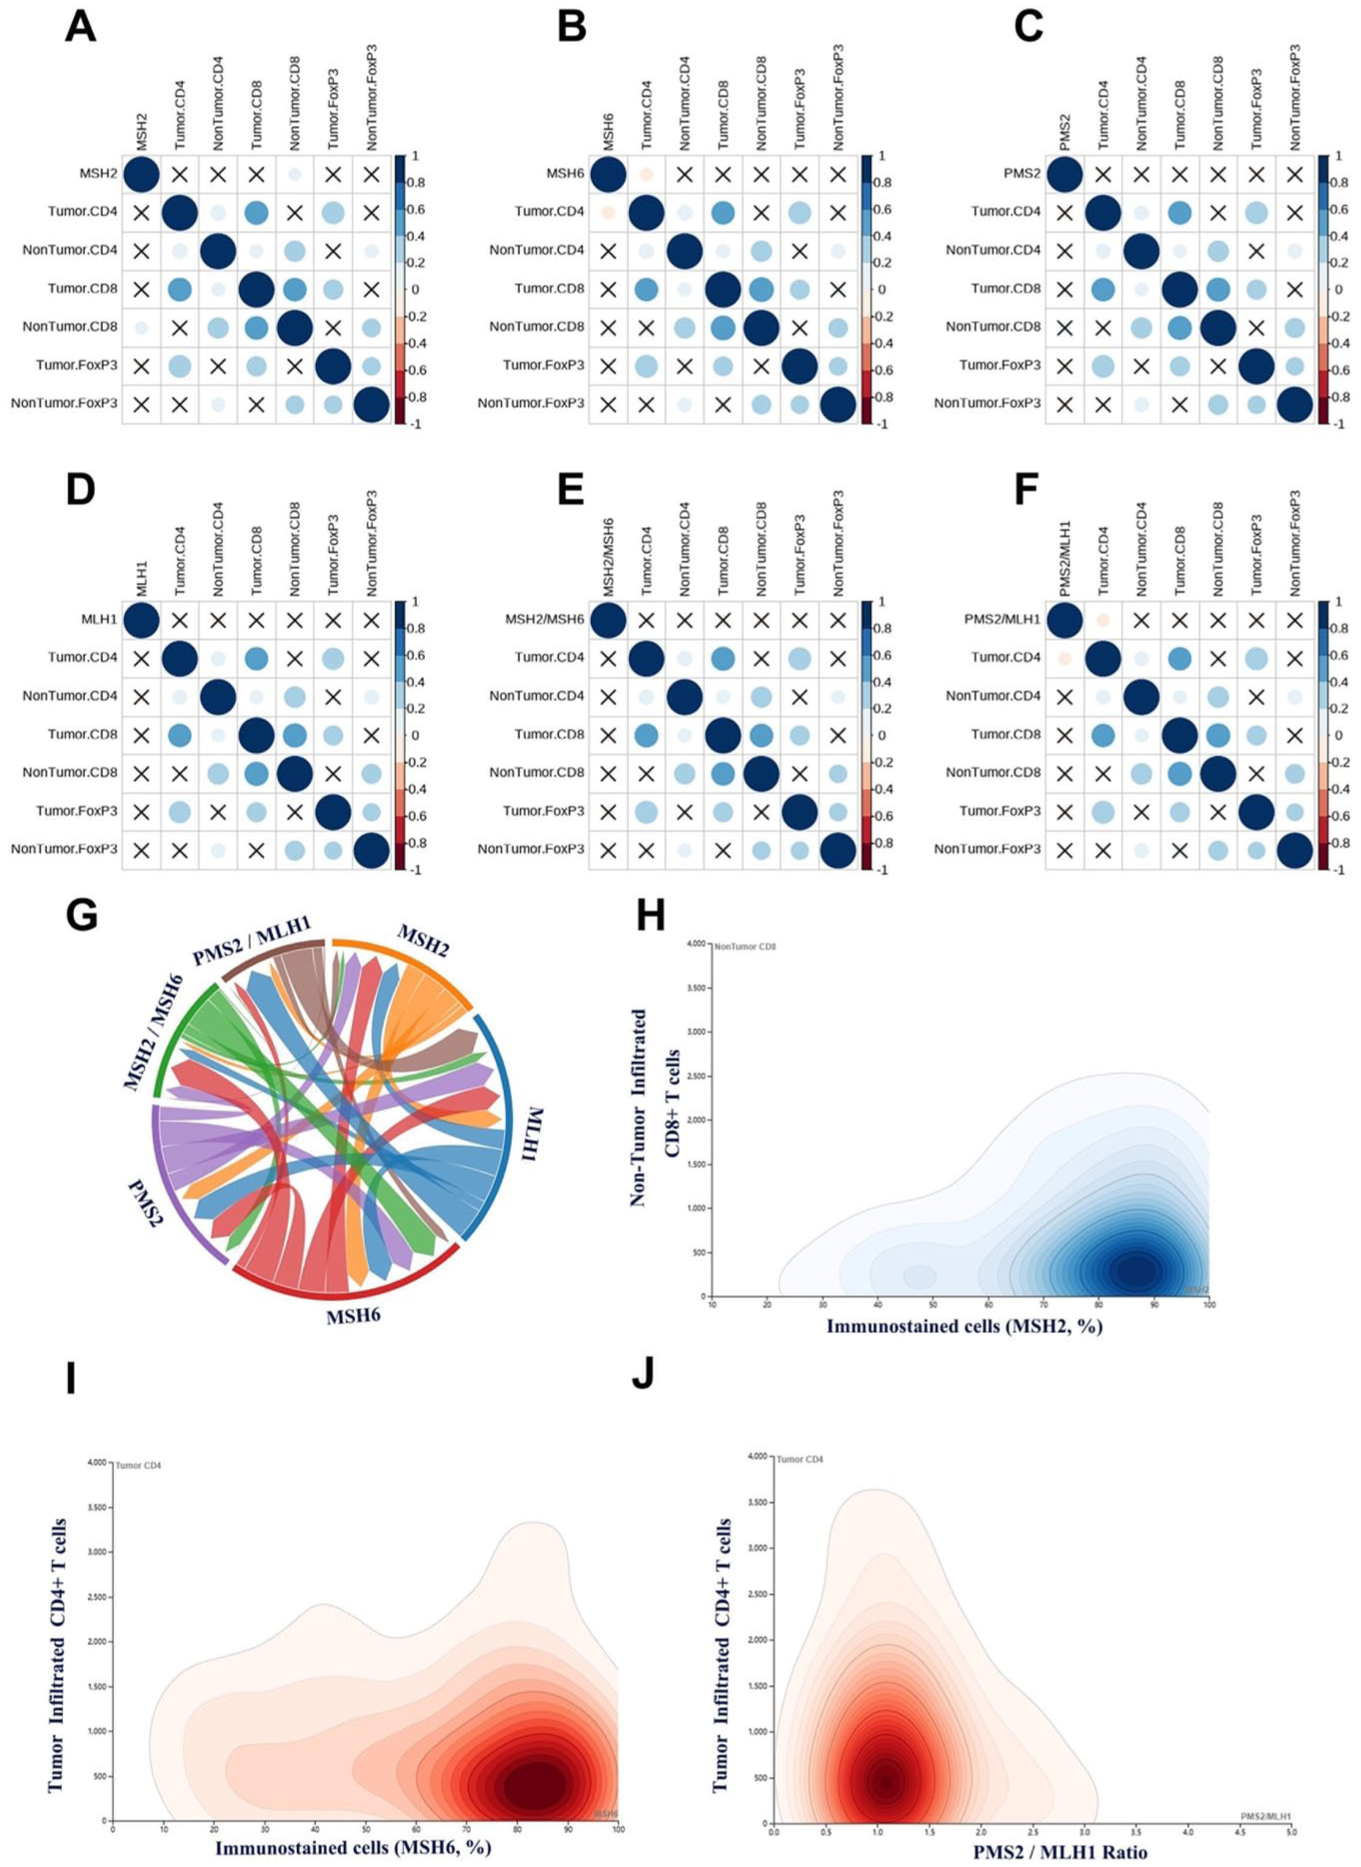
Correlation between MMR protein expression and immune cell subsets in HNSCC. (a–f) Correlation of MSH2, MSH6, PMS2, MLH1, MSH2/MSH6, and PMS2/MLH1 ratios with immune cell subsets. (g) Diagram of correlation patterns among MMR proteins. (h) Correlation between MSH2 expression and CD8+ T cells in nontumor tissues. (i) Correlation between MSH6 expression and CD4+ T cells in tumor tissues. (j) Correlation between PMS2/MLH1 ratio expression and CD4+ T-cell in tumor tissues.
Further analysis demonstrated strong co-expression patterns between MSH2 and MSH6, and between PMS2 and MLH1, suggesting coordinated regulation. The derived ratios (MSH2/MSH6 and PMS2/MLH1) may reflect more complex interactions, potentially serving as modulators within the immune microenvironment of HNSCC (Figure 6(g)).
Given the observed correlations, we further analyzed the distribution patterns of MSH2, MSH6, and the PMS2/MLH1 ratio in relation to immune infiltration. Most patients exhibited high MSH2 positivity (approximately 70%–90%), and increased MSH2 expression was associated with elevated CD8+ T-cell counts in nontumor tissues (Figure 6(h)). For MSH6, a mild inverse trend was observed with CD4+ T-cell infiltration in tumor tissues (Figure 6(i)). PMS2/MLH1 ratios were mostly clustered between 0.8 and 1.2, with lower ratios corresponding to higher CD4⁺ T-cell levels in tumor tissues. At higher ratios (>2.5), the data became more dispersed, suggesting a nonlinear relationship between PMS2/MLH1 and CD4+ T-cell infiltration in tumors (Figure 6(j)).
To further investigate whether the relationship between MMR protein expression and immune contexture is influenced by anatomical heterogeneity, we performed a subgroup analysis based on anatomical subtypes of HNSCC, including OCC, OPC, HPC, and LC. Notably, a distinct correlation pattern was observed specifically in the LC subgroup. MSH2 protein expression demonstrated a significant positive correlation with the density of CD8+ T cells (Tumor CD8+ T-cell, p = 0.04; Nontumor CD8+ T-cell, p = 0.02; Supplemental Figure 3). This suggests a potential site-specific role of MSH2 in shaping the CD8+ T lymphocyte infiltration within the tumor microenvironment of LC. In contrast, no statistically significant correlations between any of the four MMR proteins (MSH2, MSH6, MLH1, and PMS2) and the levels of CD4+, CD8+, or FoxP3+ immune cells were identified in the OCC, OPC, or HPC subgroups.
Prognostic value of MMR protein expression levels in HNSCC
We classified MSH2, MSH6, PMS2, MLH1, MSH2/MSH6, and PMS2/MLH1 into high-level and low-level groups based on their median expression levels. Survival analysis revealed that MSH2 expression exhibited a significant association with prognosis, with patients in the low MSH2 expression group demonstrating better OS. No statistically significant differences were observed for the other markers. High MSH2 expression may be associated with immunosuppressive effects within the tumor microenvironment (Figure 7).

OS of HNSCC patients according to MMR protein expression stratification. (a) OS between MSH2-high group versus MSH2-low group (p = 0.030, cutoff: 81%). (b) OS between MLH1-high group versus MLH1-low group (p = 0.908, cutoff: 80%). (c) OS between MSH6-high group versus MSH6-low group (p = 0.253, cutoff: 76%). (d) OS between PMS2-high group versus PMS2-low group (p = 0.792, cutoff: 85%). (e) OS between MSH2/MSH6-high group versus MSH2/MSH6-low group (p = 0.626, cutoff: 1.09). (f) OS between PMS2/MLH1-high group versus PMS2/MLH1-low group (p = 0.202, cutoff: 1.10). Median values were used as cut-offs to divide the cohort into high- and low-expression groups.
On multivariate analysis, age (hazard ratio (HR): 1.018, 95% confidence interval (CI): 1.002–1.033, p = 0.023) and AJCC stage (HR: 3.664, 95% CI: 2.389–5.619, p < 0.001) were independently associated with OS (Supplemental Table 10).
The situation of MMR negative patient
In our cohort, only one HNSCC patient was identified with deficient-MMR (loss of MSH2 expression). This patient was a 45-year-old male diagnosed with HPC. Immune profiling revealed the following: tumor-infiltrating CD4+ T cells, 1067 cells/mm2; tumor-infiltrating CD8+ T cells, 3581 cells/mm2. The patient received surgery with chemotherapy. During follow-up, no tumor recurrence or secondary malignancy was observed. The OS time was 71 months until the last follow-up.
Discussion
HNSCC is a highly prevalent malignancy, representing the sixth most common cancer worldwide. 1 The complexity of HNSCC is underscored by its diverse subtypes, including OCC, OPC, and LC, which necessitate a comprehensive understanding of its pathogenesis and exploring therapeutic avenues to improve patient outcomes and survival rates.25–27 This study aims to elucidate the role of the DNA MMR system in HNSCC, focusing specifically on the expression of MMR proteins and their prognostic implications. Our research employs a retrospective analysis of HNSCC patients, examining the IHC expression of MMR proteins, including MSH2, MSH6, PMS2, and MLH1, alongside long-term clinical follow-up data. Previous studies have indicated the significance of MMR in various cancers, particularly in relation to MSI, which has been linked to improved clinical outcomes and responses to immunotherapy. By assessing the expression patterns of MMR proteins across different subtypes of HNSCC and their correlation with clinical features, this study seeks to contribute to the identification of novel biomarkers and therapeutic targets, ultimately enhancing patient management strategies in this challenging malignancy.26–28
It is crucial to distinguish our findings from the well-established concept of dMMR/MSI-H. MMR imbalance, measured as differential expression among MMR proteins and their partner molecules, is different from MMR deficiency, where mutations were identified in DNA-repairing MMR genes. While dMMR is defined by the complete loss of MMR protein expression and resultant high mutational burden, our study focuses on a more subtle imbalance in the relative expression levels among MMR partners (e.g., MSH2 > MSH6). Although studies on MMR imbalance are relatively limited, its clinical and biological relevance was evidenced in several cancers, with solid findings related to colon cancer, showing its potential in altering pathway functions by reducing the formation of the MutSα complex and dysregulating other partner molecules.17,18 In OPC, a retrospective study of a small cohort also identified a MutSα imbalance where MSH2 was expressed significantly lower than MSH6 in both p16-negative and p16-positive tumors. 20 This quantitative imbalance may represent a novel, sub-functional state of the MMR machinery that could compromise its efficacy without completely abrogating it, potentially leading to different MMR function and distinct immunogenic profile not captured by conventional MSI testing.
Previous studies have primarily focused on the implications of MMR in CRC, where a well-established correlation exists between MSI and improved patient outcomes.29,30 However, limited data are available regarding the status and clinical significance of MMR in HNSCC. In this study, we provide novel evidence that MMR protein expression, particularly MSH2, is significantly associated with patient prognosis in HNSCC. Notably, distinct HNSCC subtypes exhibit variable MMR expression profiles, and imbalanced expression of MMR proteins is more frequently observed in patients lacking established tumorigenic risk factors, such as nondrinkers and HPV-negative individuals. This phenomenon suggests some potentially unique mechanisms of genomic instability in these subgroups. Furthermore, our findings highlight the prognostic value of MMR protein expression patterns, underscoring their potential utility as biomarkers for risk stratification in HNSCC. Collectively, this study fills the gap in understanding the clinical relevance of MMR status in head and neck cancers.31,32
The finding that low MSH2 expression is associated with improved OS in HNSCC provides a rationale for developing targeted therapies aimed at modulating MMR pathways.33–35 It is important to note that in the vast majority of literature, the converse is true: high MSH2 expression, indicative of proficient MMR function, is associated with improved survival across various cancer types, particularly in microsatellite-stable colorectal, as it represents maintained genomic fidelity.36,37 However, our finding—that low MSH2 expression correlates with better survival—while paradoxical, finds a mechanistic precedent in a smaller body of evidence. Some studies have shown that MSH2 loss or deficiency can lead to increased sensitivity to certain DNA-damaging chemotherapeutic agents (e.g., methotrexate and cytarabine), potentially conferring a survival advantage in treatment-specific settings. 35 This suggests that the role of MSH2 is highly context-dependent, influenced by tumor type and treatment modality. In HNSCC, it is plausible that reduced MSH2 expression may enhance susceptibility to conventional platinum-based therapies or radiotherapy, thereby explaining the observed survival benefit. This divergence from the canonical role underscores the need for a nuanced, cancer-specific understanding of DNA repair pathways. Incorporating MMR status as a prognostic biomarker in clinical practice may enable more personalized treatment strategies, particularly for patients with advanced disease. This approach aligns with the broader trend in oncology toward integrating molecular profiling into clinical decision-making, which has shown promise in improving therapeutic efficacy and reducing adverse effects. Furthermore, our study emphasizes the importance of demographic variables—such as gender and HPV status—in interpreting MMR protein expression, which may contribute to refining screening methods and optimizing treatment strategies for high-risk populations.
HPV-associated HNSCC represents a distinct clinical subtype with unique epidemiologic and biological characteristics. HPV-positive HNSCC accounts for a significant subset of head and neck cancers, with prevalence rates ranging from 5% to 20% globally depending on geographic and demographic factors. In our study, we observed discordant MMR protein expression patterns between HPV-positive and HPV-negative HNSCC tissues. Notably, HPV-positive tumors exhibited a more balanced MMR expression profile, suggesting distinct underlying tumorigenic mechanisms compared with HPV-negative HNSCC. HPV-positive HNSCC typically exhibits improved treatment response and survival outcomes. These insights could also inform the development of targeted screening and prevention programs tailored to population-specific risk profiles, ultimately improving clinical outcomes and healthcare resource allocation.
We further investigated the relationship between MMR protein expression and immune cell infiltration within the tumor and adjacent nontumor tissues. Our results revealed a positive correlation between MSH2 expression and CD8+ T-cell infiltration in adjacent nontumor tissues, and a negative correlation between MSH6 expression and CD4+ T-cell infiltration within tumor tissues. While previous studies have demonstrated that MMR status and tumor-infiltrating lymphocytes, particularly CD8+ T cells, are closely associated with immunotherapy efficacy, our findings did not show a direct correlation between MMR expression and CD8+ T cells within tumor tissues. These observations suggest a possible link between MMR dysregulation and immune cell chemotaxis or exclusion, which warrants further investigation to elucidate the mechanisms involved.
In this study, we evaluated immune cell infiltration in both tumor tissues and adjacent nontumor tissues to gain a comprehensive view of the tumor microenvironment. The rationale for assessing immune cells in nontumor tissue (peritumoral or adjacent normal areas) was to distinguish the intratumoral immune response from the baseline immune activity in the surrounding tissue, highlighting that the presence of T cells in nontumor areas can indicate an active immune response at the tumor margins, which may not be evident from intratumoral analysis alone. By examining immune infiltrates in nontumor tissue, we could determine whether immune cells are present in the local environment but perhaps excluded from the tumor itself—an insight into potential immune evasion or suppression within the tumor. This approach is particularly relevant in HNSCC, where the interaction between tumor cells and the surrounding stroma/normal tissue can influence disease progression and response to therapy.
Here, even within an apparently MMR-intact HNSCC cohort, variations in MMR protein expression correlated with differences in immune cell presence, hinting that MMR imbalance could modulate tumor immunogenicity. It is also noteworthy that when we stratified by anatomical subsite, a significant correlation (MSH2 with CD8+ T-cell density) was found specifically in laryngeal carcinomas—suggesting that the influence of MMR on immune infiltration might be context-dependent and possibly more pronounced in certain tumor locations. Taken together, these results provide a new perspective that MMR protein levels might serve as biomarkers or modulators of the immune milieu in HNSCC, though the causal relationships remain to be determined. This improved understanding of the MMR-immune relationship could have clinical relevance: for example, identifying patients whose tumors (despite being MMR-intact) exhibit an immune-excluded phenotype could potentially guide the use of immune therapies or combination strategies. In summary, by examining both tumor and adjacent tissues, we uncovered that MMR protein expression is linked with the distribution of T lymphocytes in and around HNSCC tumors, underscoring the importance of the tumor’s wider immunological context and providing a foundation for future studies on how DNA repair and immune response pathways intersect in head and neck cancer.
This study has several limitations. For instance, patients have different tumor subsite classifications. However, our patient treatment strategies were in line with standard-of-care practices of the time, as guided by the NCCN guidelines for the corresponding disease stage at the time of diagnosis.21–23 The primary management involved surgical resection, with adjuvant therapy (radiotherapy with or without chemotherapy) administered based on established pathological risk factors. While some heterogeneity in specific regimens is inherent to real-world, multidisciplinary clinical decision-making, this approach reflects the representative treatment landscape for HNSCC during the study period. Its retrospective design introduces the potential for selection bias and unmeasured confounding variables. The relatively small sample size—especially within specific subgroups such as HPV-positive patients—may reduce the generalizability of our findings. In addition, the reliance on IHC staining for MMR protein assessment may be influenced by variability in tissue preservation and staining protocols. 38 The lack of long-term follow-up also limits conclusions regarding the extended prognostic relevance of MMR expression. Future research should involve prospective, multicenter studies with larger, more diverse patient cohorts and an independent validation cohort of p16+ cases to validate these results and further clarify the biological and clinical implications of MMR alterations in HNSCC.
Conclusion
This study highlights a significant association between MMR protein expression—particularly MSH2—and prognosis in HNSCC. Variability in MMR expression appears to influence both immune microenvironment and clinical outcomes, supporting its potential as a prognostic and predictive biomarker. Continued investigation into the role of MMR dysregulation may potentially lead to improved risk stratification and personalized therapeutic approaches, ultimately enhancing survival and quality of life for patients with HNSCC.
Supplemental Material
sj-docx-1-tam-10.1177_17588359251408596 – Supplemental material for Mismatch repair protein imbalance in head and neck squamous cell carcinoma: associations with clinical features and survival
Supplemental material, sj-docx-1-tam-10.1177_17588359251408596 for Mismatch repair protein imbalance in head and neck squamous cell carcinoma: associations with clinical features and survival by Chulin Yang, Mingyuan Du, Lili Liu, Shaohang Cai, Wanming Hu, Shida Yan, Menghua Li, Xianlu Gao, Shiyan Yang, Liji Zheng, Wei Liao, Ming Song and Shuwei Chen in Therapeutic Advances in Medical Oncology
Footnotes
References
Supplementary Material
Please find the following supplemental material available below.
For Open Access articles published under a Creative Commons License, all supplemental material carries the same license as the article it is associated with.
For non-Open Access articles published, all supplemental material carries a non-exclusive license, and permission requests for re-use of supplemental material or any part of supplemental material shall be sent directly to the copyright owner as specified in the copyright notice associated with the article.