
Abstract
Background:
Immune checkpoint inhibitors (ICIs) combined with antiangiogenic agents have become a standard strategy for advanced hepatocellular carcinoma (HCC). There remains an urgent need for effective biomarkers to guide treatment, with C-reactive protein and alpha-fetoprotein in immunotherapy (CRAFITY) scores and cytokine levels representing promising candidates.
Objectives:
We aimed to assess the efficacy, safety, and potential biomarkers of anlotinib plus TQB2450 in patients with advanced HCC.
Design:
This study was a single-arm, phase Ib trial. Twenty-five patients with advanced HCC were enrolled.
Methods:
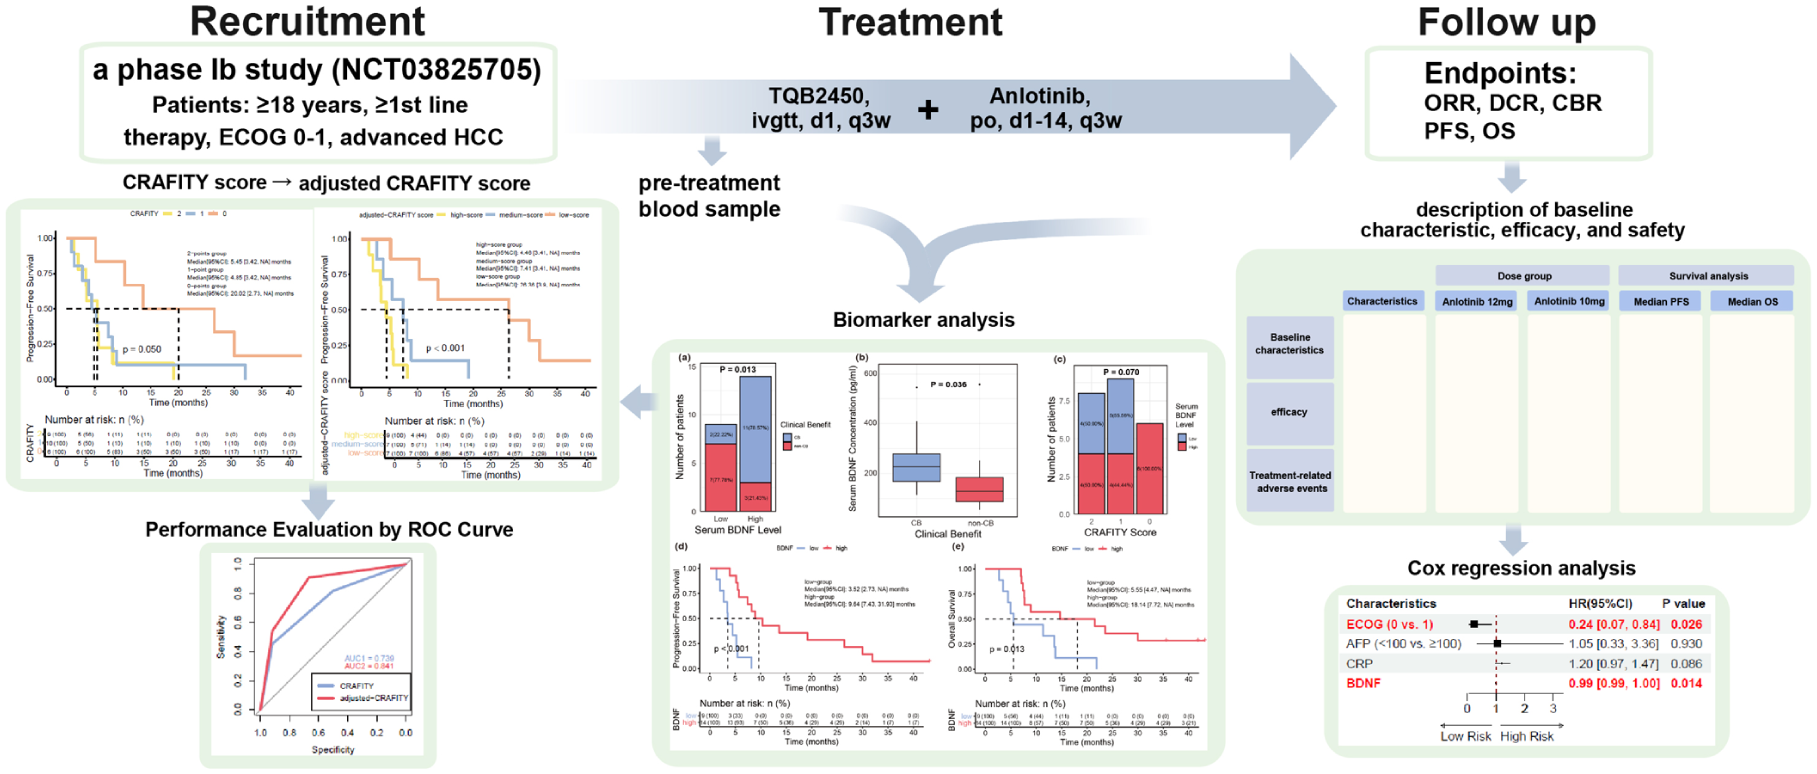
Patients received an intravenous infusion of TQB2450 (1200 mg, on Day 1) and oral administration of anlotinib (initiated at 10 mg, once a day, from Day 1 to Day 14), which was repeated every 3 weeks. Blood was collected at baseline for serum cytokine analysis.
Results:
After a median follow-up of 41.80 months, the median progression-free survival (mPFS) was 5.49 months, and the median overall survival (mOS) was 8.94 months. Treatment-related adverse events (TRAEs) occurred in 22 patients, with grade ⩾3 TRAEs observed in 12 patients. Patients who achieved clinical benefit (CB) had higher baseline serum brain-derived neurotrophic factor (BDNF) levels than non-CB patients (median, 227.97 vs 129.26 pg/ml, p = 0.036). High serum BDNF concentrations (⩾153.59 pg/ml) were associated with longer mPFS (9.64 vs 3.52 months, p < 0.001) and mOS (18.14 vs 5.55 months, p = 0.010). A CRAFITY score combining BDNF and Eastern Cooperative Oncology Group (ECOG) score showed superior prognostic performance in patients receiving anlotinib plus TQB2450, which was confirmed in a validation cohort of 36 advanced HCC patients treated with ICIs and antiangiogenic agents.
Conclusion:
Anlotinib plus TQB2450 demonstrated promising efficacy with manageable safety in advanced HCC. Elevated serum BDNF levels might serve as a potential positive prognostic marker and, together with ECOG score, may help complement the CRAFITY score in identifying subgroups that could benefit from ICIs and antiangiogenic therapy.
Trial registration:
This study was registered on ClinicalTrials.gov (NCT03825705, registered January 31, 2019).
Keywords
Introduction
According to global cancer statistics in 2022, primary liver cancer ranks sixth in incidence and third in cancer-related mortality worldwide. 1 China has a significant disease burden, with approximately 370,000 new cases accounting for approximately half of the global incidence. 2 Hepatocellular carcinoma (HCC) is the predominant histological subtype, representing the majority of primary liver cancers. Owing to its insidious onset and the lack of early symptoms, most patients are diagnosed at an advanced stage and miss the opportunity for curative surgery. 3
Multitarget small-molecule tyrosine kinase inhibitors (TKIs), such as sorafenib and lenvatinib, constitute the standard treatment for advanced HCC. The IMbrave150 trial (atezolizumab + bevacizumab) reported an objective response rate (ORR) of 30%, a disease control rate (DCR) of 74%, an mPFS of 6.9 months, and an mOS of 19.2 months. 4 The ORIENT-32 trial (sintilimab + IBI305) showed an mPFS of 4.6 months, whereas the mOS was not attained. 5 Both studies have established immune checkpoint inhibitors (ICIs) combined with antiangiogenic agents as a promising strategy for advanced HCC. LEAP-002 (lenvatinib + pembrolizumab), the first phase III study of a TKI in combination with a programmed cell death 1 (PDCD1; encoding PD-1)inhibitor for advanced HCC, reporting an ORR of 26.1%, a DCR of 81.3%, an mPFS of 8.2 months, and an mOS of 21.2 months, 6 failed to meet the primary endpoint. The follow-up CARES-310 (camrelizumab + rivoceranib), which demonstrated an ORR of 26.8%, mPFS of 5.6 months, and the longest mOS of 23.8 months among all the studies,7,8 successfully validated the efficacy of this combination. IMbrave150 illustrates that programmed death-ligand 1 (PD-L1) inhibitors are also options in combination therapy for advanced HCC. COSMIC-312 further explored the value of combining a programmed cell death ligand 1 (PD-L1) inhibitor with an antiangiogenic TKI. Compared with sorafenib, cabozantinib, and atezolizumab improved mPFS (6.9 vs 4.3 months). However, no significant improvement in mOS was observed (16.5 vs 15.5 months), and the primary endpoint was not met.9,10 Nevertheless, the combination demonstrated potential clinical benefits (CBs), suggesting that the combination of PD-L1 inhibitors and TKIs is worthy of investigation.
Although combining ICIs with antiangiogenic agents is a key treatment strategy, reliable biomarkers for therapeutic guidance are lacking. Traditional immunotherapy biomarkers are ineffective in treating HCC. Although high PD-L1 expression is correlated with ICI efficacy in some cancers, its role in HCC remains uncertain.11,12 PD-L1 expression in circulating tumor cells may indicate a favorable prognosis but requires further investigation.13,14 Although a high tumor mutational burden (TMB) may enhance immune responses, HCC typically has a low TMB and a microsatellite stable phenotype. 15 Emerging biomarkers, such as CD8+ T-cell infiltration, tumor-associated macrophages, and specific gene signatures, may provide valuable insights into the ICI response. 16 The CRP and alpha-fetoprotein in immunotherapy (CRAFITY) score, a biomarker model based on C-reactive protein (CRP) and alpha-fetoprotein (AFP), further emphasizes the value of noninvasive markers in predicting overall survival (OS) in HCC patients undergoing PD-(L)1 inhibitors. 17 The prognostic value of the CRAFITY score was subsequently validated in advanced HCC patients receiving ICIs in combination with large-molecule anti-vascular endothelial growth factor (VEGF) A monoclonal antibodies, 18 and was later extended to those treated with ICIs plus small-molecule TKIs.19,20
Anlotinib, a novel oral multitarget TKI, has demonstrated therapeutic potential in advanced HCC when combined with PD-1 inhibitors in several phase II studies. A phase III trial (NCT04344158) included 649 patients with untreated advanced HCC randomized 2:1 to receive anlotinib plus penpulimab or sorafenib. The mPFS (6.9 vs 2.8 months, p < 0.0001) and mOS (16.5 vs 13.2 months, p = 0.0013) significantly improved in the combination arm, which established anlotinib as a second oral multitarget TKI globally that demonstrated significant survival benefits with ICIs for first-line advanced HCC in a phase III trial. 21 TQB2450 is a PD-L1 inhibitor developed by Chia Tai Tianqing Pharmaceutical Group Co., Ltd (Nanjing, China). 22
Given the potential synergy between PD-L1 inhibitors and TKIs, a phase Ib trial of anlotinib plus TQB2450 was conducted in patients with advanced HCC. In addition to evaluating efficacy and safety, we also focused on analyzing peripheral blood samples to identify novel noninvasive biomarkers, aiming to optimize treatment strategies.
Methods
Study design
This study was a single-center, phase Ib trial. It was registered on ClinicalTrials.gov (identifier: NCT03825705; January 31, 2019). Only patients with advanced HCC who were initially treated or who had progressed or were intolerable following first-line therapy were included between May 2019 and January 2020. The inclusion criteria for the original trials were as follows: (1) age ⩾18 years; (2) Eastern Cooperative Oncology Group (ECOG) performance status score of 0 or 1; (3) life expectancy of at least 3 months; (4) histologically or pathologically confirmed unresectable or metastatic HCC, with at least one measurable lesion according to the Response Evaluation Criteria in Solid Tumors (RECIST) version 1.1 criteria; and (5) initial treated or occurrence of disease progression after first-line systemic therapy or intolerance because of treatment-related adverse events (TRAEs). Patients previously treated with antiangiogenic TKIs (including anilotinib) or ICIs targeting PD-(L)1/cytotoxic T-lymphocyte antigen 4 (CTLA-4) were excluded. The validation cohort was selected from a real-world population treated at the Cancer Hospital, Chinese Academy of Medical Sciences, between March and October 2021, on the basis of inclusion criteria similar to those of the phase Ib study. Eligible patients had received at least 1 month of anti-PD-(L)1 antibody combined with antiangiogenic therapy as first- or second-line treatment, and had available serum AFP, CRP, and cytokine profiles (including brain-derived neurotrophic factor (BDNF)) within 2 weeks prior to treatment initiation.
This study was conducted in accordance with both the Declarations of Helsinki and Istanbul and was approved by the institutional review board of the Cancer Hospital, Chinese Academy of Medical Sciences (identifier: 2019022611195102; February 21, 2019). All patients provided signed informed consent.
Procedure
Patients received an intravenous infusion of TQB2450 (1200 mg on Day 1) and oral administration of anlotinib (once a day from Day 1 to Day 14). This regimen was repeated every 3 weeks until disease progression, the occurrence of intolerable toxicity, or when the patient withdrew from the study. Briefly, 1200 mg of TQB2450 was dissolved in 250 ml of saline, and the infusion time was approximately 60 min. The initial dosage of anlotinib was 10 mg. If it was well tolerated during the trial, the dosage was increased to 12 mg. A dose of 12 mg was considered safe if one-sixth or fewer of the patients developed dose-limiting toxicity. Otherwise, 10 mg was ultimately recommended as a safe dosage. When two-sixths or more of the patients receiving a 10-mg dose developed dose-limiting toxicity, the dose was reduced to 8 mg. If the 8-mg dose was still intolerable, the trial would be terminated.
Bead-based multiplex immunoassay
Peripheral blood samples (approximately 10 ml) were collected before study treatment into a BD vacutainer blood collection tube (BD Biosciences, San Jose, CA, USA) by venipuncture and centrifuged (1000g for 15 min) to isolate the serum. A total of 59 serologic cytokines were simultaneously measured in serum samples using the ProcartaPlex Human Cytokine/Chemokine/Growth Factor Panel (Affymetrix Inc., Santa Clara, CA, USA) and the ProcartaPlexHuman Immuno-Oncology Checkpoint Panel (Affymetrix Inc., Santa Clara, CA, USA).
Endpoints
The efficacy endpoints included the ORR, DCR, clinical benefit rate (CBR; defined as the proportion of patients with a complete response (CR), a partial response (PR), and stable disease (SD) persisting for ⩾24 weeks), progression-free survival (PFS), and OS. Tumor assessments were evaluated according to RECIST 1.1 and were performed every 6 weeks until week 54 and then every 9 weeks. Safety was assessed using the Common Terminology Criteria for Adverse Events (Ver. 5.0).
Statistical analysis
The sample size in the phase Ib trial was not based on efficacy benefit or type I error considerations. A sample size of 20–30 patients in the dose-expansion phase was planned to evaluate the preliminary efficacy and safety. Statistical analysis was performed with R 4.4.3 software (R Foundation for Statistical Computing, Vienna, Austria). Missing data were not included in the data analysis process. Baseline serum inflammatory marker and cytokine levels were compared between the CB and non-CB groups using the Mann–Whitney U test. p Values < 0.10 in the intergroup analysis were selected for further analysis. The receiver operating characteristic curve was created for each of the selected factors, and the optimal cutoff value, which maximized the Youden index, was identified. The median PFS and OS were calculated using the Kaplan–Meier method and are presented as the median (95% confidence interval (CI)). The ORR, CBR, and DCR were evaluated with point estimates and 95% CIs. The duration of follow-up was calculated using the reverse Kaplan–Meier estimate of OS. Survival curves were generated using the Kaplan–Meier method and compared between patients with high and low levels (i.e., above or below the optimal cutoff) of the factors investigated, using the log-rank test. The Chi-square test or Fisher’s exact test was used to analyze the differences in the CBR, ORR, and DCR between patient groups. Univariate and multivariate analyses were performed using Cox regression to evaluate independent predictive factors. All the statistical tests were double-sided. A p value of ⩽0.05 was considered statistically significant.
Results
Baseline characteristics, efficacy, and safety
A total of 25 patients with advanced HCC were included (Figure 1(a)), with a median age of 54 (interquartile range (IQR), 50–62) years. Among the 25 patients, 22 were male. The ECOG scores ranged from 0 to 1.15 patients received a 10-mg dosage of anlotinib, and 10 patients received 12 mg. Seven patients underwent the regimen as a first-line treatment, whereas 18 received it as a second-line therapy. The demographic and clinical characteristics of the patients are presented in Table 1.

Flowchart of patient selection and survival curves of the entire population. (a) Flowchart of patient selection. (b) Kaplan–Meier curve of PFS. (c) Kaplan–Meier curve of OS.
Baseline characteristics and survival analysis.

AFP, alpha-fetoprotein; BDNF, brain-derived neurotrophic factor; CI, confidence interval; CRP, C-reactive protein; ECOG, Eastern Cooperative Oncology Group; EHS, extrahepatic spread; IQR, interquartile range; LC, liver cirrhosis; MVI, microvascular invasion; NA, not available; OS, overall survival; PFS, progression-free survival.
With a median follow-up of 41.80 months (95% CI, 35.60–not applicable (NA)), the median duration of treatment was 5.03 months (IQR, 2.00–14.49) until January 3, 2023. The mPFS was 5.49 months (95% CI, 4.47–10.30), and the mOS was 8.94 months (95% CI, 7.13–21.90; Figure 1(b) and (c)). Six patients achieved a PR, and 15 patients had SD. The ORR was 24.00% (95% CI, 9.36%–45.13%), the DCR was 84.00% (95% CI, 63.92%–95.46%), and the CBR was 52.00% (95% CI, 31.31%–72.20%). Furthermore, efficacy was assessed on the basis of anlotinib dosage, as detailed in Table 2.
Efficacy.

CBR, clinical benefit rate; CI, confidence interval; CR, complete response; DCR, disease control rate; IQR, interquartile range; ORR, objective response rate; PD, progressive disease; PR, partial response; SD, stable disease.
TRAEs were reported in 88.00% of patients. The incidences of TRAEs were 86.67% and 90.00% in patients who received 10 and 12 mg of anlotinib, respectively. The incidence of TRAEs of grade 3 or higher was 48.00%, which was 46.67% and 50.00% in patients who received 10 and 12 mg of anlotinib, respectively. The most common grade ⩾3 TRAEs included decreased neutrophil count (20.00%), decreased platelet count (12.00%), and elevated serum aspartate aminotransferase (12.00%). The incidence of immune-related AEs (irAEs) was 44.00%, whereas 16.00% of patients experienced grade ⩾3 irAEs. The detailed characteristics of the TRAEs are summarized in Table 3.
Treatment-related adverse events.

Safety was assessed using the Common Terminology Criteria for AEs (Ver. 5.0).
Peripheral BDNF as a predictive biomarker of TQB2450 and anlotinib for advanced HCC
We performed an exploratory biomarker analysis of 59 serum cytokines. A total of 23 baseline blood samples were available and passed quality control. Each serum cytokine was first compared between the CB (n = 13) and non-CB groups (n = 10). Serum BDNF concentrations were significantly higher in the CB group than in the non-CB group (median, 227.97 vs 129.26 pg/ml, p = 0.036; Figure 2(a)). In addition, serum concentrations of stromal cell-derived factor 1 alpha (median, 354.33 vs 320.00 pg/ml, p = 0.082) and macrophage inflammatory protein 1 alpha (median, 8.77 vs 2.56 pg/ml, p = 0.099) were also higher in the CB group (Table S1). Furthermore, we analyzed serum inflammatory markers and reported that serum CRP levels were lower in the CB group (median, 0.99 vs 2.53 pg/ml, p = 0.053; Table S1).

Relationships between serum BDNF concentration and the efficacy of anlotinib combined with TQB2450 in advanced HCC patients. (a) Distribution of CB and non-CB patients in the high and low serum BDNF groups. (b) Comparison of serum BDNF concentrations between CB and non-CB patients. (c) Distribution of patients with high and low serum BDNF levels across different CRAFITY score groups. (d) Kaplan–Meier curve for PFS stratified by serum BDNF levels. (e) Kaplan–Meier curve for OS stratified by serum BDNF levels.
Inflammatory markers and cytokines with p values < 0.10 in the intergroup analysis, along with baseline characteristics (including age, sex, dose, line of therapy (LOT), ECOG performance status, extrahepatic spread (EHS), microvascular invasion (MVI), liver cirrhosis (LC), and AFP) were included in the univariate Cox regression analysis. CRP and BDNF were associated with prognosis, particularly PFS (Figure S2(a) and (b)). Considering the sample size limitation, variables with p values <0.15 were included in the multivariable stepwise regression to identify the optimal model. Given the recognized prognostic value of AFP in HCC, 23 it was forcibly retained in the model. Ultimately, the ECOG performance status and serum concentrations of AFP, CRP, and BDNF were selected for inclusion in the multivariate models for both PFS and OS (Figure S2(c) and (d)).
The optimal threshold concentration of BDNF was defined as ⩾153.59 pg/ml for the high group (n = 14) and <153.59 pg/ml for the low group (n = 9). PFS was significantly longer in the high group than in the low group (mPFS, 9.64 vs 3.52 months, p < 0.001; Figure 2(d)). The high group also had a significantly longer OS (mOS, 18.14 vs 5.55 months, p = 0.013; Figure 2(e)). In addition, the CBR was greater in patients with high concentrations of BDNF than in those with low concentrations (78.57% vs 22.22%, p = 0.013; Figure 2(b)). Serum BDNF was not significantly associated with tumor characteristics, including EHS, MVI, LC, or tumor differentiation (Figure S1(e)–(h)).
CRAFITY score and development of the adjusted-CRAFITY score
The CRAFITY score is associated with OS in advanced HCC patients receiving PD-(L)1 immunotherapy. 17 In patients receiving TQB2450 and anlotinib, PFS and OS varied significantly across the three CRAFITY score, especially between the group with a CRAFITY score of 0 and the other groups (mPFS, 0-point group: 20.02 months, 1-point group: 4.85 months, 2-point group: 5.45 months, p = 0.050; mOS, 0-point group: 30 months, 1-point group: 7.54 months, 2-point group: 7.13 months, p = 0.026; Figure 3(a) and (b)). Individuals with a CRAFITY score of 0 had high serum levels of BDNF (Figure 2(c)).

Survival analyses based on the CRAFITY score and the adjusted-CRAFITY score in advanced HCC patients receiving TQB2450 and anlotinib. (a) Kaplan–Meier curve for PFS stratified by the CRAFITY score. (b) Kaplan–Meier curve for OS stratified by the CRAFITY score. (c) Kaplan–Meier curve for PFS stratified by the adjusted-CRAFITY score. (d) Kaplan–Meier curve for OS stratified by the adjusted-CRAFITY score.
To further elucidate the prognostic implications of serum BDNF levels and ECOG performance status, we performed a stratified analysis based on the CRAFITY score. Both Kaplan–Meier survival analysis and restricted mean survival time analysis were employed, which indicated that BDNF and ECOG score may provide additional prognostic value beyond the CRAFITY score (Table S2(a) and (b)). Due to the reduced sample size after further stratification, the median survival time may not fully reflect survival outcomes in each subgroup. In such cases, the log-rank test offers a more reliable assessment of differences between groups.
No correlations were observed between serum BDNF and ECOG score, CRP, AFP, or the CRAFITY score involving 23 patients (Figure S1(a)–(d)). Therefore, we modified the CRAFITY score to achieve better prognostic value in advanced HCC patients receiving antiangiogenic agents and immunotherapy. The adjusted-CRAFITY score = (ECOG performance status (0) = 0, ECOG performance status (1) = 1) + (BDNF (High) = 0, BDNF (Low) = 1) + CRAFITY score. Using X-tile, two optimal cutoff values with the greatest discriminative performance for both PFS and OS were identified. Accordingly, patients were stratified into three groups: low-score (adjusted-CRAFITY score = 0 or 1), medium-score (adjusted-CRAFITY score = 2), and high-score (adjusted-CRAFITY score = 3 or 4).
Performance of the adjusted-CRAFITY score in predicting prognosis
Twenty-three patients from this phase Ib study with valid cytokine results were defined as the training cohort. Through a retrospective review of patients with advanced HCC treated at our center between March 2021 and January 2023, an additional 36 patients who received anti-PD-1 antibodies in combination with antiangiogenic agents were identified and included as the validation cohort (the cutoff date, January 3, 2023; median follow-up time, 19.10 months (95% CI, 17.20–20.10); mPFS, 15.00 months (95% CI, 7.67–NA months); mOS, NA months (95% CI, 13.80–NA months)). The demographic and clinical characteristics are presented in Table S3. There were significant differences between the training and validation cohorts in terms of the LOT (p < 0.001), antiangiogenic agent (p = 0.003), BDNF (p = 0.003), EHS (p = 0.031), and CRP (p = 0.030).
Compared with the CRAFITY score, the adjusted-CRAFITY score could more clearly classify patients with different prognostic characteristics (Figures 3 and S3). Compared with the original CRAFITY score, the adjusted-CRAFITY score demonstrated superior prognostic performance in both the training and validation cohorts, as reflected by higher C-indices (Table S4). Time-dependent AUC analyses further supported the superior performance of the adjusted-CRAFITY score in predicting both PFS and OS across multiple time points (Table S5).
Discussion
In this phase Ib study, although more than 70% of patients received the combination as second-line therapy, anlotinib plus TQB2450 still exhibited substantial antitumor activity, with an ORR of 24.0% and a DCR of 84.0%. The mPFS was 5.49 months, and the mOS was 8.94 months, suggesting that the combination of TKIs with PD-L1 inhibitors may be a promising therapeutic strategy that warrants further investigation. The safety profile of anlotinib plus TQB2450 in advanced HCC was consistent with that reported in a prior phase Ib study of pretreated advanced biliary tract cancer 24 and aligned with safety outcomes from phase III trials of TKI–ICI combinations.
Exploratory biomarker analysis revealed the prognostic significance of serum BDNF levels. BDNF, a neuronal growth factor, and its receptor, tropomyosin-related kinase B (TrkB), are being increasingly acknowledged for their roles in tumor progression and metastasis in various types of cancer. 25 BDNF/TrkB overexpression is frequently related to an aggressive phenotype and poor prognosis. Intriguingly, BDNF acts not only as an oncogene but also as a cancer suppressor. Its dual functions are associated with TrkB isoforms, namely full-length TrkB (TrkB-FL) and truncated TrkB isoform 1 (TrkB-T1).26,27 BDNF promotes cancer cell proliferation, invasion, and metastasis in most cancers through binding to the TrkB-FL isoform. TrkB-T1 lacks the intracellular tyrosine kinase domain and mainly acts as a natural antagonist of TrkB-FL. 28 The downstream RhoA signaling pathway is also implicated in the dual effects of BDNF within the tumor microenvironment. 29
The role of BDNF in HCC remains under investigation. High BDNF expression was detected in HCC specimens and was significantly correlated with multifocal disease and advanced HCC stages. 30 As a secreted protein of the neurotrophin family, Yang et al. 31 reported a positive correlation between tissue and serum BDNF levels in HCC patients, with higher serum BDNF levels associated with more advanced tumor stages and larger tumor size. Taken together, these findings suggest that elevated BDNF expression levels might be associated with more aggressive clinicopathological features in HCC patients. Possibly due to the limited sample size and prior treatments, no significant correlation between serum BDNF and tumor characteristics was observed in our study. Both anti-BDNF and Trk inhibitor (K252a) effectively induced apoptosis and suppressed the invasion of human HCC cell lines. 30 MicroRNA-15a-5p selectively downregulated BDNF at the gene and protein levels, suppressing cancer proliferation and division in human HCC. 32
Therefore, BDNF has been proposed as an unfavorable prognostic biomarker in HCC patients on the basis of previous studies. Wang et al. 33 discovered a significant negative correlation between OS and BDNF at the genetic level, which is consistent with the GEPIA-based analysis of BDNF expression and OS in HCC (Figure S5). However, our study suggests that high serum BDNF levels may serve as a potential predictive biomarker for CB in HCC patients receiving combination therapy with ICIs and antiangiogenic agents. Previous studies have suggested a potential association between BDNF and PD-L1 expression. High BDNF messenger RNA levels were associated with high expression of cluster of differentiation 274 (CD274; encoding PD-L1) and programmed cell death 1 (PDCD1; encoding PD-1) in The Cancer Genome Atlas—pancreatic adenocarcinoma dataset. 34 Analysis of the TCGA-LIHC dataset also revealed that BDNF was co-expressed with several key targets of TQB2450 (CD274) and anlotinib (kinase insert domain receptor (KDR), fms-related receptor tyrosine kinase 1 (FLT1), FLT4, platelet-derived growth factor receptor alpha (PDGFRA), PDGFRB, fibroblast growth factor receptor 1 (FGFR1), and KIT proto-oncogene receptor tyrosine kinase (KIT)) in patients with HCC, not otherwise specified (Figure S4(a)). In gastrointestinal stromal tumors, high BDNF expression is significantly associated with PD-L1-positive tumor-infiltrating lymphocytes (TILs). 35 In castration-resistant prostate cancer, BDNF is positively correlated with leukemia inhibitory factor/leukemia inhibitory factor receptor-driven PD-L1 expression, and elevated BDNF expression has been linked to improved survival outcomes in patients treated with anti-PD-(L)1 therapy. 36 These findings suggest that the positive correlation between BDNF and PD-L1 expression, along with the infiltration of PD-L1-positive TILs, may represent a potential therapeutic target for ICIs, ultimately offering CBs to patients.
The heatmap illustrates the top 20 differentially expressed genes stratified by median BDNF expression using the TCGA-LIHC dataset (Figure S4(b)). Notably, these genes are predominantly associated with four hallmark biological processes, including angiogenesis (Figure S4(c)). Previous studies also showed that BDNF could function as an angiogenesis inducer similar to VEGF. 37 Microarray and molecular analyses further revealed that VEGF could mediate BDNF/TrkB-induced angiogenesis in a mouse endothelial cell line. 38 BDNF increases VEGF expression and enhances angiogenesis through a signal transduction pathway involving the TrkB receptor, phospholipase C gamma, protein kinase C alpha, and hypoxia-inducible factor 1-alpha in human chondrosarcoma cells. 39 Inhibiting BDNF expression reduces VEGF secretion and suppresses tumor angiogenesis in multiple myeloma. 40 The interplay between BDNF and VEGF may impact the therapeutic efficacy of antiangiogenic therapy.
Given the relatively small sample size of our study, fully elucidating the underlying mechanisms is difficult, and our interpretations should be considered preliminary. As research in this field is still in its early stages, these findings are mainly hypothesis-generating and warrant validation in larger patient cohorts as well as further mechanistic studies.
As noted above, BDNF and its receptor TrkB are overexpressed in multiple cancers and activate downstream pathways that promote proliferation, survival, epithelial–mesenchymal transition, and therapeutic resistance, contributing to aggressive tumor behavior and poor prognosis. Preclinical studies have shown that blocking the BDNF/TrkB axis with neutralizing antibodies or small interfering RNA significantly suppresses tumor growth 41 and increases sensitivity to anlotinib in gastric cancer models. 42 These findings suggest that targeting BDNF/TrkB, potentially in combination with immunotherapy or antiangiogenic agents, could further improve HCC outcomes. Although several Trk inhibitors (entrectinib, larotrectinib, and cabozantinib) are clinically available, their use is currently limited to neurotrophic tyrosine receptor kinase fusion-positive tumors. Broader strategies to target BDNF/TrkB in HCC remain to be developed and clinically validated.
Currently, first-line therapy for unresectable HCC typically combines ICIs with antiangiogenic agents. As a phase Ib exploratory study with a small sample size, our findings are not sufficient to guide treatment decisions but may inform future larger studies. Notably, patients with high serum BDNF seemed to benefit from standard first-line therapy. Several phase II trials have shown promising results with intensified regimens, including KN046 (anti-PD-L1/CTLA-4 bispecific antibody) plus lenvatinib, camrelizumab plus apatinib with hepatic artery infusion chemotherapy, and lenvatinib plus sintilimab combined with transarterial chemoembolization.43–45 These observations support further exploration of combination strategies, particularly for patients with low BDNF who respond poorly to standard treatment.
In advanced HCC, the combination of ICIs and antiangiogenic agents has emerged as a cornerstone of treatment. However, reliable biomarkers to guide therapeutic decisions remain lacking. The CRAFITY score, a biomarker model based on CRP and AFP, has been validated as a simple, noninvasive tool with significant prognostic value for OS in HCC patients receiving immunotherapy or combination immunotherapy.17,18,46 Although the CRAFITY score can broadly stratify patients into different prognostic groups, it relies exclusively on CRP and AFP without adequately accounting for the patients’ general condition or immune status, which may limit the precision of its prognostic predictions. Serum cytokines are critical regulators of the immune system that can be quantitatively measured and may serve as more precise indicators of immune status, presenting an opportunity to establish a noninvasive approach for exploring biomarkers. A prospective study revealed that early increases in serum interleukin-8 (IL-8) levels indicated the uselessness of ICIs and predicted worse prognosis in patients with unresectable HCC. 47 Yang et al. 48 reported that high baseline interleukin-6 levels may be associated with poor clinical outcomes and impaired T-cell function in patients with unresectable HCC following atezolizumab/bevacizumab treatment. Consistent results were obtained by Myojin et al. 49 In another trial of sintilimab combined with IBI305 in HCC patients, Zhang et al. 50 found that patients who achieved CB had higher serum CD137 concentrations and showed markedly longer PFS. These studies have highlighted the prognostic value of cytokines.
To improve the predictive accuracy of the CRAFITY score, peripheral blood cytokine levels were assessed. We proposed the adjusted-CRAFITY score, which incorporates two additional parameters, namely serum BDNF level and ECOG performance status. Compared with the CRAFITY score, the adjusted-CRAFITY score has stronger prognostic value for advanced HCC patients receiving ICI and antiangiogenic therapy. Notably, the predictive ability of the CRAFITY score is only for OS, whereas that of the adjusted-CRAFITY score can be applied to both PFS and OS, offering a more comprehensive assessment of treatment benefit. Given the relatively small sample size of our study, larger prospective cohort studies are needed to validate its applicability across different treatment regimens and patient populations. Because the adjusted-CRAFITY score requires additional serum cytokine testing, its cost-effectiveness may be relatively lower. Nevertheless, these results provide a novel direction for future research. To further refine risk stratification and optimize treatment selection for patients, it is essential to integrate additional immune-related biomarkers, either from circulation or the tumor microenvironment, with cytokines, representing a promising avenue for further investigation.
There are several limitations to our study. First, the sample size was small and was derived from a single center in China. As a result, our model remained preliminary and exploratory. The small sample size also resulted in a substantial group imbalance between groups when patients were stratified by objective response, as only 6 out of 25 patients achieved an objective response. Therefore, we adopted CB as an alternative grouping criterion to achieve a more balanced distribution and minimize potential bias caused by unequal group sizes. As a single-center study, validation was performed using only an independent cohort from the same center, without external cohort verification. Therefore, the model requires further comprehensive evaluation before it can be considered for clinical application and should be regarded solely as a potential direction for future research. Second, patient treatment histories were not uniform, and a subset received the study regimen as second-line therapy, which may have introduced confounding factors affecting comparisons between groups. In contrast, the validation cohort consisted entirely of patients treated in the first-line setting, which could limit the generalizability of the model. Accordingly, the results derived from the model should be interpreted with appropriate caution. Third, biomarker analyses were investigative and limited by the number of available specimens, potentially leading to bias. Fourth, although BDNF emerged as a potential prognostic biomarker, the lack of validation in tumor tissue and the absence of mechanistic studies limit the strength of these findings.
Conclusion
Anlotinib plus TQB2450 demonstrated promising efficacy and manageable safety in advanced HCC. Elevated serum BDNF levels were associated with a higher 24-week CBR and might serve as a positive prognostic marker, particularly for PFS. Together with the ECOG score, serum BDNF may complement the CRAFITY score to better identify favorable subgroups for ICIs and antiangiogenic therapy in terms of prognosis. These findings warrant further validation in future studies.
Supplemental Material
sj-docx-6-tam-10.1177_17588359251407052 – Supplemental material for Serum BDNF helps identify favorable subgroups in HCC patients treated with PD-L1 inhibitors and anti-angiogenic TKIs
Supplemental material, sj-docx-6-tam-10.1177_17588359251407052 for Serum BDNF helps identify favorable subgroups in HCC patients treated with PD-L1 inhibitors and anti-angiogenic TKIs by Caifeng Gong, Jinglong Huang, Dandan Cao, Tianyi Liu, Qi Cai, Shuhui You, Yongkun Sun, Zhichao Jiang, Wei Wang, Lin Yang, Hong Zhao, Wen Zhang and Aiping Zhou in Therapeutic Advances in Medical Oncology
Supplemental Material
sj-docx-7-tam-10.1177_17588359251407052 – Supplemental material for Serum BDNF helps identify favorable subgroups in HCC patients treated with PD-L1 inhibitors and anti-angiogenic TKIs
Supplemental material, sj-docx-7-tam-10.1177_17588359251407052 for Serum BDNF helps identify favorable subgroups in HCC patients treated with PD-L1 inhibitors and anti-angiogenic TKIs by Caifeng Gong, Jinglong Huang, Dandan Cao, Tianyi Liu, Qi Cai, Shuhui You, Yongkun Sun, Zhichao Jiang, Wei Wang, Lin Yang, Hong Zhao, Wen Zhang and Aiping Zhou in Therapeutic Advances in Medical Oncology
Supplemental Material
sj-jpg-1-tam-10.1177_17588359251407052 – Supplemental material for Serum BDNF helps identify favorable subgroups in HCC patients treated with PD-L1 inhibitors and anti-angiogenic TKIs
Supplemental material, sj-jpg-1-tam-10.1177_17588359251407052 for Serum BDNF helps identify favorable subgroups in HCC patients treated with PD-L1 inhibitors and anti-angiogenic TKIs by Caifeng Gong, Jinglong Huang, Dandan Cao, Tianyi Liu, Qi Cai, Shuhui You, Yongkun Sun, Zhichao Jiang, Wei Wang, Lin Yang, Hong Zhao, Wen Zhang and Aiping Zhou in Therapeutic Advances in Medical Oncology
Supplemental Material
sj-jpg-2-tam-10.1177_17588359251407052 – Supplemental material for Serum BDNF helps identify favorable subgroups in HCC patients treated with PD-L1 inhibitors and anti-angiogenic TKIs
Supplemental material, sj-jpg-2-tam-10.1177_17588359251407052 for Serum BDNF helps identify favorable subgroups in HCC patients treated with PD-L1 inhibitors and anti-angiogenic TKIs by Caifeng Gong, Jinglong Huang, Dandan Cao, Tianyi Liu, Qi Cai, Shuhui You, Yongkun Sun, Zhichao Jiang, Wei Wang, Lin Yang, Hong Zhao, Wen Zhang and Aiping Zhou in Therapeutic Advances in Medical Oncology
Supplemental Material
sj-jpg-3-tam-10.1177_17588359251407052 – Supplemental material for Serum BDNF helps identify favorable subgroups in HCC patients treated with PD-L1 inhibitors and anti-angiogenic TKIs
Supplemental material, sj-jpg-3-tam-10.1177_17588359251407052 for Serum BDNF helps identify favorable subgroups in HCC patients treated with PD-L1 inhibitors and anti-angiogenic TKIs by Caifeng Gong, Jinglong Huang, Dandan Cao, Tianyi Liu, Qi Cai, Shuhui You, Yongkun Sun, Zhichao Jiang, Wei Wang, Lin Yang, Hong Zhao, Wen Zhang and Aiping Zhou in Therapeutic Advances in Medical Oncology
Supplemental Material
sj-jpg-4-tam-10.1177_17588359251407052 – Supplemental material for Serum BDNF helps identify favorable subgroups in HCC patients treated with PD-L1 inhibitors and anti-angiogenic TKIs
Supplemental material, sj-jpg-4-tam-10.1177_17588359251407052 for Serum BDNF helps identify favorable subgroups in HCC patients treated with PD-L1 inhibitors and anti-angiogenic TKIs by Caifeng Gong, Jinglong Huang, Dandan Cao, Tianyi Liu, Qi Cai, Shuhui You, Yongkun Sun, Zhichao Jiang, Wei Wang, Lin Yang, Hong Zhao, Wen Zhang and Aiping Zhou in Therapeutic Advances in Medical Oncology
Supplemental Material
sj-jpg-5-tam-10.1177_17588359251407052 – Supplemental material for Serum BDNF helps identify favorable subgroups in HCC patients treated with PD-L1 inhibitors and anti-angiogenic TKIs
Supplemental material, sj-jpg-5-tam-10.1177_17588359251407052 for Serum BDNF helps identify favorable subgroups in HCC patients treated with PD-L1 inhibitors and anti-angiogenic TKIs by Caifeng Gong, Jinglong Huang, Dandan Cao, Tianyi Liu, Qi Cai, Shuhui You, Yongkun Sun, Zhichao Jiang, Wei Wang, Lin Yang, Hong Zhao, Wen Zhang and Aiping Zhou in Therapeutic Advances in Medical Oncology
Footnotes
Acknowledgements
We thank the patients who participated and the clinical study teams who were involved in data collection and analyses. We are grateful to Chia Tai Tianqing Pharmaceutical Group Co., Ltd, for assisting in this study.
Declarations
Supplemental material
Supplemental material for this article is available online.
References
Supplementary Material
Please find the following supplemental material available below.
For Open Access articles published under a Creative Commons License, all supplemental material carries the same license as the article it is associated with.
For non-Open Access articles published, all supplemental material carries a non-exclusive license, and permission requests for re-use of supplemental material or any part of supplemental material shall be sent directly to the copyright owner as specified in the copyright notice associated with the article.