
Abstract
Background:
The management of muscle-invasive bladder cancer (MIBC) remains challenging. The phase III NIAGARA trial showed that adding durvalumab to neoadjuvant chemotherapy significantly enhances event-free and overall survival for MIBC patients. However, due to the high cost of durvalumab, assessing its cost-effectiveness is crucial.
Objective:
To compare the cost-effectiveness of durvalumab with neoadjuvant chemotherapy versus neoadjuvant chemotherapy alone in operable MIBC, from the perspective of U.S. healthcare payers.
Design:
A model-based pharmacoeconomic evaluation.
Method:
A Markov model was constructed using data from the NIAGARA trial. Costs and utility were sourced from public databases and literature. Total costs, life-years, quality-adjusted life year (QALY), and incremental cost-effectiveness ratio (ICER) were evaluated. Sensitivity analysis assessed model robustness.
Results:
Compared to neoadjuvant chemotherapy alone, the combination of durvalumab with neoadjuvant chemotherapy results in an additional 0.68 QALY, with an incremental cost of $86,485.19. The ICER per QALY is $93,693.79. Sensitivity analysis demonstrated the robustness of the model.
Conclusion:
From the perspective of U.S. payers, durvalumab combined with neoadjuvant chemotherapy is a cost-effective strategy compared to chemotherapy alone for treating operable MIBC.
Plain language summary
Muscle-invasive bladder cancer (MIBC) is a serious condition that can be hard to treat. A recent clinical trial (NIAGARA) found that adding a drug called durvalumab to standard chemotherapy before surgery helps patients live longer and reduces the chance of cancer returning. However, durvalumab is expensive, and it’s important to understand if the benefits justify the costs. This study looked at whether the combination of durvalumab and chemotherapy provides good value for the money in the United States. Using data from the NIAGARA trial, researchers created a model to compare the total costs and health benefits of two treatments: chemotherapy alone versus chemotherapy with durvalumab. The model measured the costs, life expectancy, and quality of life for patients over time. The results showed that adding durvalumab gives patients an extra 0.68 quality-adjusted life years (QALYs), which means more time in good health. However, this benefit comes at an additional cost of $86,485. The cost-effectiveness of the treatment was measured using the incremental cost-effectiveness ratio (ICER), which was $93,693 per QALY gained. This amount is within the range that U.S. healthcare payers typically consider acceptable for new treatments. In conclusion, adding durvalumab to chemotherapy appears to be a cost-effective option for treating operable bladder cancer, offering better health outcomes for patients while providing reasonable value for the healthcare system.
Introduction
Bladder cancer is the sixth most common malignancy in the United States (US) and is classified based on tumor invasion depth into non-muscle-invasive bladder cancer (NMIBC) and muscle-invasive bladder cancer (MIBC). MIBC accounts for approximately 20%–25% of all bladder cancer cases and is considerably more aggressive, with a higher risk of recurrence and metastasis compared to NMIBC.1,2 Unlike NMIBC, MIBC invades the muscular layer of the bladder wall, making its clinical management more complex. The current standard treatment involves neoadjuvant chemotherapy followed by radical cystectomy (RC); however, approximately 50% of patients experience recurrence within 3 years.3,4
In recent years, immune checkpoint inhibitors (ICIs) have transformed the perioperative treatment landscape for MIBC. Perioperative therapy—including both neoadjuvant and adjuvant phases—plays a pivotal role across different stages of treatment. During the neoadjuvant phase, ICIs enhance antitumor immunity by activating the patient’s immune system, often in combination with chemotherapy to achieve synergistic effects. These benefits include tumor downstaging, improved surgical conditions, and a reduced risk of postoperative recurrence and distant metastasis. In the adjuvant setting, ICIs provide continued immune surveillance, targeting residual micrometastatic disease and potentially improving long-term survival. 5 A systematic review reported that patients receiving neoadjuvant immunotherapy combined with chemotherapy demonstrated significantly higher response and remission rates compared to those receiving chemotherapy alone. 6 With growing evidence of ICI efficacy, ongoing research continues to refine and expand immunotherapeutic strategies for MIBC management. 7
Durvalumab is a selective, high-affinity, humanized IgG1 monoclonal antibody that enhances T-cell function by blocking the interaction of PD-L1 with PD-1 and CD80, thereby promoting antitumor immune responses. 8 The phase III, global, open-label, randomized NIAGARA trial (NCT03732677) evaluated the efficacy and safety of perioperative durvalumab in combination with gemcitabine–cisplatin chemotherapy for patients with MIBC. 9 Results showed that the durvalumab group achieved significantly higher 24-month event-free survival (EFS; 67.8% vs 59.8%; hazard ratio (HR): 0.68; 95% confidence interval (CI): 0.56–0.82; p < 0.001) and overall survival (OS; 82.2% vs 75.2%; HR: 0.75; 95% CI: 0.59–0.93; p = 0.01) compared to chemotherapy alone, with an acceptable safety profile. 10 These findings highlight the growing importance of neoadjuvant immunotherapy in the comprehensive treatment of MIBC.
Bladder cancer is among the most expensive cancers to manage in the U.S. healthcare system, with annual expenditures exceeding $4 billion.11,12 While neoadjuvant chemotherapy remains the standard of care and is supported by level 1 evidence for improving survival, its cost is relatively modest. In contrast, the addition of perioperative immunotherapy such as durvalumab imposes a substantial financial burden. Therefore, this study aims to evaluate the cost-effectiveness of perioperative durvalumab combined with neoadjuvant chemotherapy for operable MIBC, from the perspective of U.S. healthcare payers. The objective is to provide critical economic insights for clinicians, healthcare providers, and policymakers in making informed decisions about MIBC treatment.
Methods
As this study is entirely based on previous research and publicly available data, it does not include any new research involving human participants or animals by any of the authors, and therefore does not require approval from an independent ethics committee. The study was completed in October 2024. The economic analysis adhered to the methodological guidelines established by the Second Panel on Cost-Effectiveness in Health and Medicine, and the findings are reported in accordance with the Consolidated Health Economic Evaluation Reporting Standards 2022 checklist, detailed in Table S1. 13
Patients and treatments
This study is based on the multicenter, open-label, randomized phase III NIAGARA trial. Eligible patients were aged ⩾18 with MIBC (T2-T4a, N0-N1, M0) per AJCC 8th edition, and suitable for cisplatin-based chemotherapy (creatinine clearance ⩾40 ml/min/1.73 m2) and RC. Patients were randomized 1:1 into two groups.
Durvalumab plus chemotherapy (durvalumab plus gemcitabine and cisplatin) group
Patients received four cycles of durvalumab (1500 mg) in combination with gemcitabine-cisplatin (gemcitabine 1000 mg/m² and cisplatin 70 mg/m² on Day 1, and gemcitabine 1000 mg/m² on Day 8) every 3 weeks as neoadjuvant therapy, followed by RC and up to eight cycles of adjuvant durvalumab (1500 mg every 4 weeks).
Chemotherapy-only (gemcitabine and cisplatin) group
Patients received four cycles of gemcitabine-cisplatin followed by RC.
NIAGARA showed that 9.9% of patients in the durvalumab plus gemcitabine and cisplatin (DGC) group and 17.5% in the gemcitabine and cisplatin (GC) group received subsequent treatments following disease progression; however, the specific regimens were not specified. Based on the NCCN Guidelines (Version 4.2024) and expert recommendations, we propose the following posttreatment strategies: patients who experience recurrence within 1 year after surgery are considered refractory and are assumed to receive pembrolizumab at a dose of 200 mg via intravenous infusion every 21 days. Other patients are presumed to receive gemcitabine (1000 mg/m² on Days 1 and 8) in combination with cisplatin (70 mg/m², intravenously administered every 21 days). Patients not receiving these treatments are assumed to receive best supportive care. 14 The follow-up schedule, also following the NCCN guidelines, included CT urography, CT imaging, and urine cytology every 3 months for the first 2 years, and annually thereafter, along with basic metabolic panel and complete blood count tests every 3 months during the first year, and annually afterward. 14 To determine specific drug doses for patients, we used U.S. anthropometric data and calculated the average body surface area (BSA) using the Mosteller formula, resulting in an average BSA of 1.98.15,16
Model construction
A time-varying Markov model was developed using the “heemod” package (R package version 1.0.1.9) in R (version 4.4.1, https://www.r-project.org/), with the full model code provided in Appendix 1, which details the structure of the Markov model, including state transitions, parameters, and implementation in R. The model incorporates five mutually exclusive health states: EFS, RC, non-RC, recurrence, and death (Figure 1). EFS represents the initial state, while death serves as the absorbing state.

Model structure of a decision tree combining the Markov model with the three health states.
In the EFS state, patients may either proceed to RC, opt against surgery, or transition directly to the death state. Patients undergoing or forgoing RC remain at risk for recurrence or death. The death state, being absorbing, terminates the simulation upon entry. The recurrence state also carries the possibility of progression to death. All patients are initially assigned to the EFS state, and the simulation runs for approximately 10 years with a cycle length of 21 days. The primary outcomes of interest include total costs, quality-adjusted life years (QALYs), and the incremental cost-effectiveness ratio (ICER). Consistent with the World Health Organization guidelines, the willingness-to-pay (WTP) threshold for U.S. payers was set at $150,000 per QALY. 17 Costs and utilities were calculated using the life-table method and discounted at an annual rate of 3% (Table 1).18,19
Ranges and distributions of parameters used in the model.

AEs, adverse events; BMP, basic metabolic panel; BSA, body surface area; CBC, complete blood count; CTU, CT urography; DGC, durvalumab plus gemcitabine and cisplatin; EFS, event-free survival; GC, gemcitabine and cisplatin; RC, radical cystectomy.
Model parameters
Transition probabilities
The OS and EFS curves were digitized using GetData Graph Digitizer version 2.0 (developed by S.Fedorov; GetData‑graph‑digitizer.com, Moscow, Russia). We then utilized R software (version 4.4.1) to reconstruct pseudo-individual patient data and extrapolate Kaplan–Meier curves. The parametric models employed included seven commonly used standard models: exponential, Weibull, Gompertz, log-normal, log-logistic, gamma, and generalized gamma distributions, along with five flexible models: fractional polynomial (FP) models, restricted cubic spline models, Royston–Parmar (RP) models, generalized additive models (GAM), and mixture cure models. For FP models, the optimal first-order and second-order models (FP1 and FP2) were selected. In RP models, the best-fitting models across the “odds,” “normal,” and “hazard” scales were thoroughly evaluated. The best-fitting model for long-term clinical survival outcomes was selected through a comprehensive assessment based on visual inspection, clinical plausibility, and statistical criteria such as the Akaike Information Criterion and Bayesian Information Criterion. 20
The fitted results are shown in Tables S2 and S3 and Figures S1–S4. Ultimately, the OS and EFS distributions for the DGC group were modeled using RP-hazard and RP-odds distributions, while the GC group used GAM and RP-normal distributions (Table S3 and Figure S5). The natural mortality rate for the United States in 2022 was incorporated into the analysis. Based on a review of the literature and expert consultation, it was assumed that the natural mortality and recurrence rates for patients not undergoing RC were twice those of patients undergoing RC.10,21 Time-varying transition probabilities between states were calculated by extrapolating survival data for each group.
Costs estimates
The cost-effectiveness analysis was conducted from the perspective of U.S. payers, considering only direct medical costs. These included drug acquisition, follow-up, physician consultations, tumor imaging, laboratory tests, best supportive care, end-of-life care, and the management of adverse events (AEs). Costs for drugs, physician consultations, tumor imaging, and laboratory tests were sourced from the Centers for Medicare and Medicaid Services Physician Fee Schedule,22,23 while other costs were obtained from published literature (Table 1).24–28 To account for inflation, all costs were adjusted to the 2024 price level. 29
Utility inputs
Since the NIAGARA trial did not provide detailed reports on patients’ health status and quality of life dimensions, we used data from published literature. The average health utility values for EFS, recurrence, and death were 0.95, 0.62, and 0, respectively.10,30 Following standard research methodologies, we primarily focused on treatment-related AEs of grade 3 or higher with an incidence rate of 5% or more, as mild AEs typically do not require treatment or incur significant costs.31–33 The impact of clinical events on quality of life was assessed by multiplying the utility decrement associated with each AE by its incidence rate (Table 1).
Sensitivity analyses
In the sensitivity analysis, costs were modeled using a gamma distribution, whereas health utilities, transition probabilities, and AEs were modeled using beta distributions, adhering to the ISPOR-SMDM Good Research Practices Modeling Task Force guidelines. 34 Standard deviations for each distribution were sourced from the literature where available; otherwise, they were estimated as ±25% of the mean. The one-way sensitivity analysis results will be presented visually through a tornado diagram.
To rigorously assess the uncertainty in the ICER estimates, we conducted a probabilistic sensitivity analysis (PSA) using 1000 Monte Carlo simulations. The PSA randomly samples input parameters from defined probability distributions, offering a comprehensive and robust evaluation of the potential variability in the ICER estimates while accounting for the inherent uncertainty of each parameter. The PSA results will be displayed through cost-effectiveness acceptability curves and scatter plots.
Scenario analysis
Three scenario analyses were conducted to explore key variables influencing the model outcomes. In Scenario 1, model duration was examined. The base case extrapolated results over a 10-year period, while real-world data from clinical literature covered a 5-year timeframe. To evaluate the impact of model duration, an additional analysis was performed with a 5-year model. Scenario 2 investigated the effects of varying discount rates by applying different rates to utility values and costs independently. This analysis assessed the sensitivity of the cost-effectiveness model to discounting strategies and highlighted the economic implications of alternative discount policies. In Scenario 3, it was assumed that only 80% or 50% of patients received subsequent treatment after disease progression, simulating real-world scenarios where some patients discontinue treatment for various reasons. This scenario provided practical insights to inform clinical decision-making.
Results
Base case analysis
The results of the base case analysis are presented in Table 2. Over a 10-year period, the total costs for the DGC group and GC group were $227,802.40 and $164,048.73, respectively, with QALY of 5.86 and 5.18. Compared to the GC group, the DGC group incurred an incremental cost of $63,753.67, leading to an ICER of $93,693.79 per QALY. Importantly, this ICER falls below the U.S. WTP threshold of $150,000, demonstrating that the DGC neoadjuvant immunotherapy regimen is a cost-effective option for operable MIBC patients.
The results of the model’s base-case evaluation.

AEs, adverse events; DGC, durvalumab plus gemcitabine and cisplatin; GC, gemcitabine and cisplatin; ICER, incremental cost-effectiveness ratio; QALY, quality-adjusted life-years.
Sensitivity analysis
The tornado diagram in Figure 2 highlights the substantial influence of specific parameters on the ICER. Among these, the cost of durvalumab, the discount rate, and the utility value for EFS emerge as the most critical factors. In contrast, other parameters exert only moderate or minor effects. Notably, when all parameters are varied within their respective ranges, the resulting ICER values remain distinct from the WTP threshold, thereby affirming the robustness of our model outcomes.

Tornado diagrams illustrating the results of DGC versus GC.
The results of the Monte Carlo simulation are shown in Figure 3. All scatter points in the plot are located in the first quadrant of the coordinate plane, indicating that higher costs are associated with additional QALY. The cost-effectiveness acceptability curve reveals that at a WTP threshold of $150,000, the probability of DGC being cost-effective compared to GC is 91.95% (Figure 4).
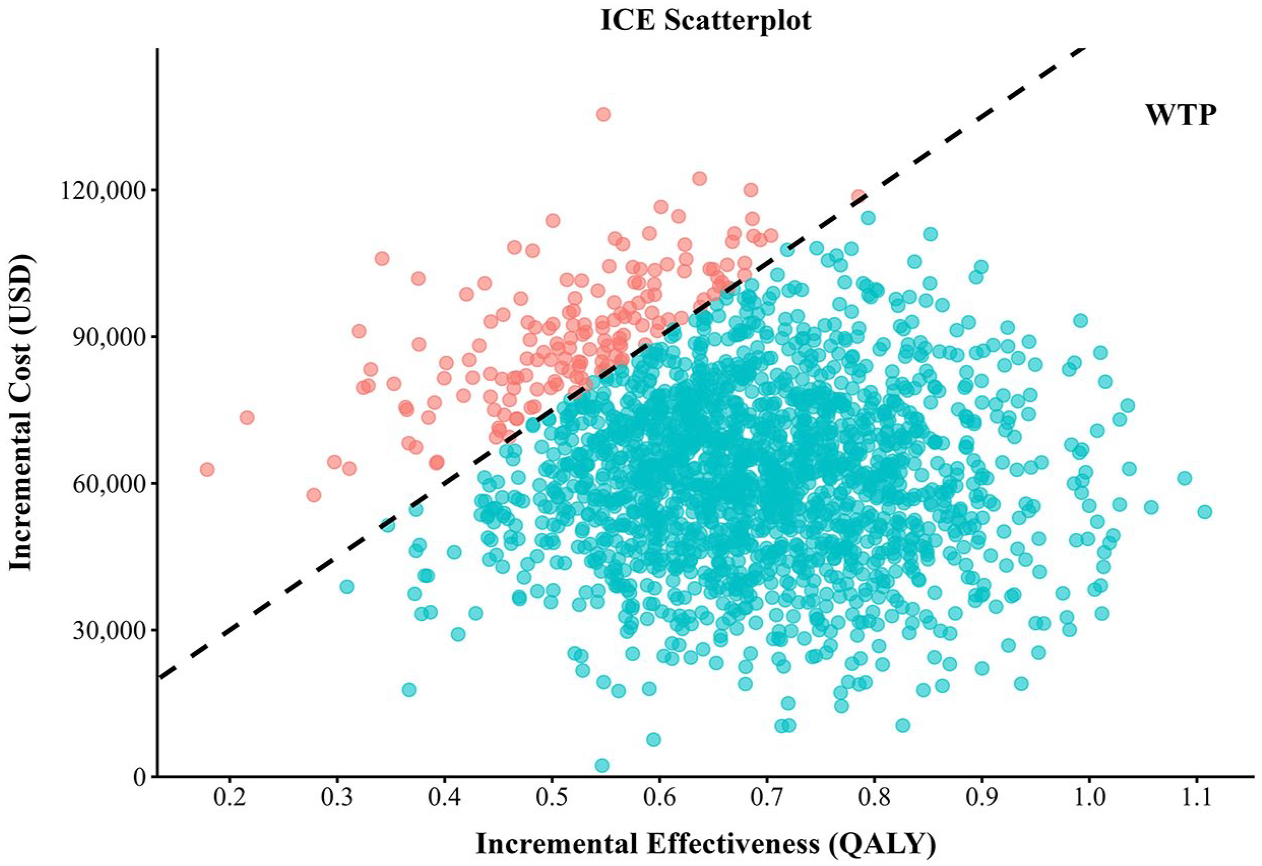
Scatter plot diagrams showing the ICE of DGC versus GC.

Cost-effectiveness acceptable curve for DGC versus GC.
Scenario analysis
The scenario analysis results are summarized in Table S4. In Scenario 1, with a study duration of 5 years, the ICER rises significantly to $359,493.07/QALY, exceeding the U.S. per capita WTP threshold and indicating that the DGC regimen is not cost-effective in the short term. In Scenario 2, when either utility values or costs are discounted, the ICER decreases to $74,625.79/QALY and $79,722.90/QALY, respectively—both well below the WTP threshold. Furthermore, in the absence of discounting, the ICER further declines to $63,498.17/QALY, representing the most favorable cost-effectiveness outcome. Lastly, in Scenario 3, when 80% and 50% of patients receive subsequent treatment, the ICERs are $114,377.03/QALY and $145,401.87/QALY, respectively, both remaining below the WTP threshold of $150,000/QALY.
Discussion
MIBC is an aggressive cancer that typically requires a comprehensive treatment strategy, including surgery, chemotherapy, and radiation therapy. The current standard of care includes neoadjuvant chemotherapy followed by RC, a regimen supported by level 1 evidence for improving OS. While approximately 40%–60% of patients achieve a favorable pathological response to neoadjuvant chemotherapy, a substantial proportion remains at risk of recurrence and metastasis. 35 Recently, the NIAGARA clinical trial introduced the ICI durvalumab as part of a perioperative treatment regimen, administered both before (neoadjuvant) and after (adjuvant) surgery in combination with chemotherapy. This therapeutic approach not only directly targets malignant cells but also stimulates the host immune response, thereby reducing the risk of recurrence and distant metastasis. As such, it represents a more comprehensive and potentially durable treatment strategy for patients with MIBC. 36 The emergence of this integrated therapeutic strategy represents a substantial advancement in the perioperative management of MIBC. However, the considerable cost associated with neoadjuvant immunotherapy has raised important concerns regarding its economic sustainability. In this context, we conducted a cost-effectiveness analysis to assess the value of this approach from the perspective of U.S. healthcare payers.
We constructed a time-varying Markov model to evaluate the cost-effectiveness of neoadjuvant durvalumab combined with chemotherapy in patients with MIBC. In the base case analysis, total costs were $227,802.40 for the DGC group and $164,048.73 for the GC group, with the cost difference primarily driven by durvalumab’s high price and its associated survival benefits. Despite an incremental cost of $63,753.67, the DGC group achieved an additional 0.68 QALYs. Moreover, the DGC regimen slightly reduced AE management costs due to a lower incidence of severe toxicities. The resulting ICER was $93,693.79 per QALY, which falls below the U.S. WTP threshold of $150,000, indicating that durvalumab plus chemotherapy is a cost-effective strategy.
To ensure the robustness of our findings, we conducted sensitivity analyses. The one-way sensitivity analysis showed that the ICER was most sensitive to the price of durvalumab, the discount rate, and the utility value of EFS. Nonetheless, variations within the plausible ranges of these parameters did not alter the overall conclusion of cost-effectiveness. PSA further demonstrated that, at a WTP threshold of $150,000 per QALY, the DGC regimen had a 91.95% probability of being cost-effective.
To assess the impact of time horizon, we conducted a scenario analysis using a 5-year time frame based on real-world clinical data. Under this assumption, the ICER increased to $359,493.07 per QALY, likely reflecting the high upfront cost of durvalumab, while its clinical benefits accrue over a longer duration. These findings highlight the importance of selecting an appropriate time horizon in economic evaluations. Shorter horizons may underestimate the long-term value of innovative therapies. Therefore, decision-makers should carefully consider both short- and long-term impacts when evaluating emerging treatment strategies. Future studies incorporating long-term real-world data are warranted to validate model extrapolations and enhance the reliability of economic assessments.
To our knowledge, this is the first study to evaluate the cost-effectiveness of neoadjuvant durvalumab immunotherapy in patients with MIBC. While a 2021 study assessed the economic impact of neoadjuvant pembrolizumab in a similar setting, 37 its conclusions differed, suggesting that pembrolizumab was not cost-effective from the U.S. payer perspective. We believe this discrepancy may be attributed to methodological limitations in the prior analysis, including reliance on data from a small phase II trial and meta-analyses, and the use of a simplified decision tree model. In contrast, our study leverages updated 2024 drug pricing and healthcare cost data, and is based on high-quality evidence from the phase III NIAGARA trial. We constructed a more sophisticated time-varying Markov model, enabling a nuanced assessment of disease progression. Additionally, we fitted and extrapolated 15 survival curves to ensure realistic estimation of transition probabilities, selecting models that best reflect clinical practice. This comprehensive approach provides an updated and more robust evaluation of the economic value of neoadjuvant durvalumab immunotherapy.
This study has several limitations worth noting. First, the NIAGARA trial did not report health-related quality of life data; thus, utility values were sourced from published literature. Sensitivity analyses using a wide range of utilities demonstrated that these variations did not materially affect our conclusions. Second, since the trial lacked details on subsequent treatments, we assumed both groups received follow-up care per NCCN guidelines and international standards. Scenario analyses varying the proportion of patients receiving subsequent therapy (80% and 50%) confirmed the robustness of this assumption. Third, consistent with prior studies, only grade ⩾3 AEs with incidence ⩾5% were considered, as lower-grade or rarer events have minimal impact on costs and utilities. Sensitivity analyses further supported that AE incidence variations did not influence result. Fourth, the study population was derived from the NIAGARA clinical trial, which may differ from real-world patients in terms of age, treatment adherence, and other clinical characteristics. These differences could lead to variations in real-world effectiveness and clinical benefit, potentially influencing cost-effectiveness outcomes. Future studies incorporating real-world data are warranted to validate and refine our findings. Despite these limitations, the study offers valuable economic insights for decision-makers.
Conclusion
In conclusion, from the perspective of U.S. payers, durvalumab plus neoadjuvant chemotherapy demonstrates improved both life expectancy and QALY in the perioperative setting compared to neoadjuvant chemotherapy alone, thereby making it a cost-effective treatment option for patients with MIBC.
Supplemental Material
sj-docx-1-tam-10.1177_17588359251357519 – Supplemental material for Cost-effectiveness of perioperative durvalumab plus neoadjuvant chemotherapy for muscle invasive bladder cancer in the United States
Supplemental material, sj-docx-1-tam-10.1177_17588359251357519 for Cost-effectiveness of perioperative durvalumab plus neoadjuvant chemotherapy for muscle invasive bladder cancer in the United States by Caicong You, Jiahao Zhang, Jianying Lei, Wu Fu, Maobai Liu, Hongfu Cai, Bin Zheng and Na Li in Therapeutic Advances in Medical Oncology
Footnotes
References
Supplementary Material
Please find the following supplemental material available below.
For Open Access articles published under a Creative Commons License, all supplemental material carries the same license as the article it is associated with.
For non-Open Access articles published, all supplemental material carries a non-exclusive license, and permission requests for re-use of supplemental material or any part of supplemental material shall be sent directly to the copyright owner as specified in the copyright notice associated with the article.