
Abstract
Background:
Epidermal growth factor receptor tyrosine kinase inhibitors (EGFR-TKIs) significantly improve the prognosis of EGFR-sensitive mutant non-small-cell lung cancer (NSCLC). However, the mechanisms underlying primary resistance to EGFR-TKIs remain unclear.
Objective:
This study aimed to explore the biomarkers associated with primary resistance to first- and second-generation EGFR-TKIs. Primary resistance to EGFR-TKIs was defined as disease progression within 90 days (3 months) of treatment in patients with EGFR-sensitive mutant adenocarcinoma without any evidence of objective response.
Design:
Retrospective, single-center study.
Methods:
This study retrospectively screened patients with NSCLC who received EGFR-TKIs at Hunan Cancer Hospital from January 2018 to December 2022. According to pre-determined clinical outcomes, we divided the patients into primary resistance and sensitivity groups. Only patients with sufficient samples that passed quality control were included in this study. Tumor tissue and paired peripheral blood samples collected from patients before treatment were subjected to next-generation sequencing using an 825-gene panel. In addition, tumor tissue samples were analyzed for programmed cell death ligand 1 (PD-L1) expression.
Results:
A total of 70 patients were enrolled in this study, with 35 in each of the primary resistant and sensitive groups. Patients with exon 4 mutations in the TP53 gene had significantly shorter progression-free survival (PFS) and overall survival (OS) compared to those without the mutation. PTPRD and TACC3 mutation frequencies were substantially higher in the primary resistant group and were associated with shorter PFS and OS. Furthermore, patients in the primary resistant group exhibited substantially higher levels of PD-L1 expression.
Conclusion:
The potential mechanisms of primary resistance to EGFR-TKIs are highly heterogeneous. Combining some somatic variants affecting tumor function and high PD-L1 expression may contribute to this resistance.
Keywords
Introduction
Lung cancer has the second highest incidence rate (11.4%) and the highest mortality rate (18%) among cancers, with non-small-cell lung cancer (NSCLC) accounting for approximately 85% of cases, being the main histological type of lung cancer. 1 Currently, we have entered the era of precision diagnosis and treatment. As sequencing technology keeps improving, precision diagnostics and targeted treatment are now standard in advanced lung cancer guidelines. 2 In NSCLC, particularly among East Asians, precision-targeted therapy guided by oncogenes has replaced chemotherapy for eligible patients, with epidermal growth factor receptor tyrosine kinase inhibitors (EGFR-TKIs) being the main treatment option. Currently, EGFR-TKIs, such as gefitinib,3,4 erlotinib, 5 icotinib, 6 afatinib, 7 dacomtinib, 8 and osimertinib, 9 are approved by either the U.S. FDA or the Chinese NMPA or both for first-line treatment of patients with advanced EGFR mutation-positive NSCLC.
Owing to reasons such as tumor heterogeneity, not all patients with EGFR-sensitive mutations benefit from EGFR-TKI treatment. Approximately 10%–20% of patients are less responsive and develop primary resistance, which is a significant clinical issue. Primary resistance to EGFR-TKIs is defined as disease progression within 90 days (3 months) of treatment in patients with EGFR-sensitive mutant adenocarcinoma without any evidence of objective response.10,11 Currently, there is limited research on the mechanisms of primary resistance to EGFR-TKIs. Therefore, it is pertinent to explore predictive biomarkers associated with this resistance from multiple dimensions.
This study aimed to identify biomarkers associated with primary resistance to first- and second-generation EGFR-TKIs. We compared the gene mutation profiles between the primary resistant and sensitive groups, combined with evaluations of tumor mutation burden (TMB) and programmed cell death ligand 1 (PD-L1) expression. In this study, tumor tissue and paired peripheral blood samples from 70 patients were subjected to next-generation sequencing (NGS) using an 825-gene panel. Tumor tissue samples were also assayed for PD-L1 expression.
Materials and methods
Patient enrollment and sample collection
This was a retrospective study. Patients with NSCLC treated with EGFR-TKIs at the Hunan Cancer Hospital between January 2018 and December 2022 were retrospectively screened. The inclusion criteria were as follows: (i) Age 18–75; (ii) Eastern Cooperative Oncology Group Performance Status (ECOG PS) of 0–2; (iii) Histologic or cytologic diagnosis of adenocarcinoma; (iv) TNM stage IIIB/IV according to American Joint Committee on Cancer (Eighth edition) guidelines; (v) Presence of EGFR-sensitive mutation (EGFR 19DEL, 21L858R, 21L861Q, 18G719X, 20S768I) 2 ; and (vi) Receiving first- or second-generation EGFR-TKIs as first-line treatment. All patients underwent either follow-up CT or MRI scans or both 1 month after treatment initiation and every 2 months after that to evaluate efficacy. Clinical responses were assessed using RECIST guideline (version 1.1). 12
Based on predefined clinical outcomes, we further screened the patients and divided them into two groups: (i) primary resistance group: disease progression within 90 days of treatment without any evidence of objective response (progression-free survival (PFS) <3 months)10,11; (ii) sensitive group: showing durable clinical benefit with PFS >12 months. 13 Clinical samples were collected from patients, including the tumor tissue, and matched peripheral blood samples before treatment with EGFR-TKIs. Patients with sufficient quality-controlled samples were finally included in this study. NGS was performed on tumor tissue and paired peripheral blood samples from the patients who were ultimately included. PD-L1 expression in the tumor tissue samples was also detected.
Detailed clinical data were collected for enrolled patients, including gender, age, smoking history, ECOG PS, TNM stage, pathologic type, metastatic site, baseline driver mutation status, and treatment regimen. PFS was defined as the time from the start of EGFR-TKIs treatment to disease progression or death from any cause (whichever occurred first). If neither occurred, the date of the last imaging was used. Overall survival (OS) was defined as the time from the start of EGFR-TKI treatment to death from any cause (whichever occurred first). If death did not occur, the final follow-up date was used. The final follow-up and data collection ended in December 2023. The reporting of this study conforms to the Reporting Recommendations for Tumour Marker Prognostic Studies (REMARK) guidelines (Supplemental File 1). 14
Next-generation sequencing
Plasma separation and ctDNA/gDNA extraction
AllPrep DNA/RNA Mini Kit (Qiagen 80204, Hilden, Germany) was used for gDNA extraction from fresh tissue samples and blood lymphocytes according to the manufacturer’s instructions. ctDNA was extracted from plasma using the MagMax™ Cell-Free DNA Isolation Kit (Thermo Fisher A29319, Waltham, MA, USA) following the manufacturer’s protocol. Both gDNA and ctDNA were assessed for fragment size, quality, and total concentration using a 2200 Bioanalyzer (Agilent Technologies, Santa Clara, CA, USA).
Library construction
The gDNA library was constructed using the KAPA Hyper Prep Kit (Kapa Biosystems, Wilmington, MA, USA) following the manufacturer’s protocols. For ctDNA library constructions, 4 bp random nucleolus were added as built-in tags to both ends of ctDNA after A-tailing of the 3′ ends. Adapters were then added for HiSeq X Ten sequencing by PCR amplification. Library quantities were measured with a Qubit 3.0 Fluorometer (Thermo Fisher).
Panel design and targeted sequencing
Panel825plus and CT_DNA_800a063 were used in our research (see Table S1 for a complete list of genes). gDNA and ctDNA libraries were enriched for regions targeted by custom-designed captured probes manufactured by Agilent. There were 825 gene point mutations, insertions, and deletions, 44 gene rearrangements, and 88 gene copy number variations. The organizational version of the panel is 3.7 M in size, and the blood version is 1.8 M in size. The correlation coefficient between the TMB assessment and whole exome sequencing (WES) R2 was 0.9779 (TMB assessment criteria reference F1CDx). Prepared libraries (750 ng) were hybridized with two different hybridization reagents and blocking agents using the SureSelectXT Target Enrichment System (Agilent Technologies). The enriched libraries were amplified with P5/P7 primers. After qualification by the 2200 Bioanalyzer and quantification with Qubit 3.0 and a qPCR NGS library quantification kit (Agilent Technologies), the libraries were sequenced on a Hiseq X10 platform (Illumina, San Diego, CA, USA).
Quality control and bio-informatics analysis
Quality control
The average sequencing depth after de-duplication was ⩾500× for tumor tissue samples and ⩾1000× for tumor ctDNA samples. The GC content ranged from 40% to 60%, the capture efficiency was ⩾45%, and the percentage of base mass Q30 was ⩾80%.
Sequence data processing
Primary processing of NGS data for tissue and ctDNA samples was performed using Trimmomatic (version 0.36; http://www.usadellab.org/cms/?page=trimmomatic), which included demultiplexing and masking of dual-index adapter sequences. Sequence reads were aligned to the human reference genome (version GRCh37/hg19) using BWA (version 0.7.10; https://bio-bwa.sourceforge.net/). Duplicate removal, local realignment, and base quality recalibration were performed using PICARD (version 1.103; http://broadinstitute.github.io/picard/) and the Genome Analysis Toolkit (GATK 3.5; https://gatk.broadinstitute.org).
Variation identification and annotation
For tissue samples, somatic single-nucleotide variations (SNVs) and small insertions and indels were identified using MuTect (version 3.1; https://github.com/broadinstitute/mutect) and Strelka (version 2.9.2; https://github.com/Illumina/strelka). For ctDNA samples, somatic SNVs, small insertions, and indels were identified using Samtools (version 1.3.1; http://www.htslib.org) and Pindel (version 0.2.5b8; https://github.com/genome/pindel) across the targeted regions of interest. Effects of variants were annotated using the Variant Effect Predictor (https://grch37.ensembl.org/info/docs/tools/vep/index.html), and Integrative Genomics Viewe (https://github.com/igvteam/igv) was used to filter alignment and sequencing artifacts.
PD-L1 evaluation
Immunohistochemistry for PD-L1 expression level was performed using the PD-L1 IHC 22C3 pharmDx on the Automated Link 48 platform (Dako, Carpinteria, CA, USA). The PD-L1 expression levels were independently evaluated by two pathologists. PD-L1 expression level was determined by the tumor proportion score (TPS), which is the percentage of total tumor cells showing any intensity of PD-L1 membrane staining. Based on TPS, PD-L1 expression level was categorized into three groups: (i) Negative PD-L1 expression: TPS <1%; (ii) Low PD-L1 expression: TPS 1%–49%; and (iii) High PD-L1 expression: TPS ⩾50%.
Statistical analysis
Statistical analysis for all data was performed using the statistical software R (version 3.6.1; The R Foundation for Statistical Computing, Vienna, Austria). The test level α = 0.05 was considered statistically significant for two-sided tests at p < 0.05. Categorical data between groups were compared using the Chi-squared and Fisher’s exact tests. Continuous data between groups were compared using unpaired t-tests and Mann–Whitney tests. The relationship between variables and survival was analyzed using Kaplan–Meier curves. Differences in survival between groups were compared using the Log-Rank test. Cox proportional hazard models were used to calculate hazard ratios (HR) and 95% confidence intervals (CI) to determine survival differences.
Results
Baseline clinical characteristics of patients
Between January 2018 and December 2022, 796 patients undergoing EGFR-TKI treatment were included during screening (Figure 1) for the enrollment screening process. Among these, 112 did not receive first-line treatment, and 62 had incomplete treatment records; these patients were excluded, leaving 622 eligible patients. Of these, 114 patients (18.3%) had a PFS of less than 3 months and were classified into the primary resistant group; 161 patients (25.9%) had a PFS of over 12 months and were classified into the sensitive group. Sufficient, quality-controlled clinical samples were available for only 35 patients in each group. These 70 patients were ultimately included in the study. The primary resistant and sensitive groups each had 27 patients with matched tumor tissues and peripheral blood samples for NGS. Eight patients had only tumor tissues sequenced because the peripheral blood samples did not pass quality control. Concordant EGFR-sensitive mutations were found in both tumor tissue and plasma ctDNA in 47 of 54 paired samples in the primary resistant and sensitive groups, with the ctDNA assay showing 87.0% sensitivity and 100% specificity.

Research flowchart.
The median survival follow-up time was 46.33 months (95% CI: 38.18–54.48 months). The baseline clinical characteristics of the two groups of patients are detailed in Table 1 and are comparable. In the primary resistant group, 42.9% were male (15/35), and 22.9% (8/35) were over 65 years. In the sensitive group, 34.3% were male (12/35), and 31.4% (11/35) were over 65 years. Most patients in both groups had an ECOG PS of 0–1. Smoking prevalence was 42.9% (15/35) in the primary resistant group and 28.6% (10/35) in the sensitive group. The baseline metastatic sites of the two groups were not significantly different. EGFR-sensitive mutations detected in the primary resistant group were EGFR 19DEL (54.3%) and EGFR 21L858R (45.7%), and those measured in the sensitive group were EGFR 19DEL (45.7%) and EGFR 21L858R (54.3%), showing no significant difference. Among the first-line EGFR-TKIs selected in the primary resistant group, icotinib, gefitinib, afatinib, and dacomtinib were the choices for 20 (57.2%), 12 (34.3%), 1 (2.8%), and 2 (5.7%) cases, respectively. Among the first-line EGFR-TKIs selected in the sensitivity group, icotinib, gefitinib, and dacomitinib were the choices for 19 (54.3%), 15 (42.9%), and 1 (2.8%) cases, respectively.
Baseline clinical characteristics of patients.

ECOG PS, Eastern Cooperative Oncology Group Performance Status; EGFR-TKIs, epidermal growth factor receptor tyrosine kinase inhibitors.
Somatic variations and primary resistance to EGFR-TKIs
Somatic variations between primary resistant and sensitive groups are shown in Figure 2. Complete molecular spectral data are provided in Table S2. The mean number of somatic variations did not significantly differ between the two groups (13.91 vs 15.23, p = 0.977). In addition to EGFR-sensitive mutations, the top 10 co-occurring mutations in the primary resistant group in terms of mutation frequency were TP53 (80.0%), uncommon EGFR mutations (22.9%), TET2 (22.9%), APC (20.0%), PIK3CA (17.1%), PTPRD (17.1%), TACC3 (17.1%), LRP1B (14.3%), ATRX (14.3%), and BRCA2 (14.3%). In the sensitive group, the top 10 coexisting mutations were TP53 (74.3%), LRP1B (22.9%), APC (20.0%), FAT1 (20.0%), NF1 (20.0%), PIK3CA (17.1%), ATRX (17.1%), RB1 (17.1%), ERBB2 (14.3%), and uncommon EGFR mutations (14.3%).

Somatic variation spectrogram.
To identify biomarkers linked to primary resistance to EGFR-TKIs, we further compared somatic variations between the resistant and sensitive groups.
In the primary drug-resistant group, 19 patients had the EGFR 19del mutation, of which 14 (73.7%) had the classic subtype (E746_A750del), and 5 (26.3%) had the non-classic subtypes (Leu747_Pro753del, n = 3; Leu747_Thr751del, n = 1; Glu746_Leu747del, n = 1). In the sensitive group, 16 patients had the EGFR 19del mutation, of which 11 (68.8%) had the classic subtype, and 5 (31.2%) had the non-classic subtypes (Leu747_Pro753del, n = 3; Glu746_Ser752del, n = 1; Glu746_Thr751del, n = 1). There was no significant difference in the frequency of specific EGFR 19del mutations between the two groups (p = 1.000). Further analysis showed that there was also no significant difference in PFS and OS between patients with classic and non-classic EGFR 19del mutations (PFS, p = 0.222; OS, p = 0.253).
TP53 was the most common coexisting mutation, with no significant difference in the frequency of TP53 mutations between the two groups (80.0% vs 74.3%, p = 0.776). Subgroup analyses revealed that TP53 mutation sites were not identical between the groups, and the only high-frequency mutation site seen in the primary resistant group was TP53 exon 4 mutation (11.4% vs 0.0%). Further analysis indicated that TP53 exon 4 mutations had significantly shorter PFS and OS than those of TP53 wild type (mPFS: 2.12 vs 12.12 months, p = 0.018; mOS: 9.91 vs 24.41 months, p = 0.002; Figure 3(a) and (d)), and no significant differences were seen for the other mutant loci.

Association of somatic mutations with PFS and OS. (a) PFS of patients with or without TP53-Exon 4. (b) PFS of patients with or without PTPRD. (c) PFS of patients with or without TACC3. (d) OS of patients with or without TP53-Exon 4. (e) OS of patients with or without PTPRD. (f) OS of patients with or without TACC3.
In the primary resistant group, the mutation rates of PTPRD and TACC3 were significantly higher than in the sensitive group (PTPRD: 17.1% vs 0.0%, p = 0.025; TACC3: 17.1% vs 0.0%, p = 0.025). Survival analysis revealed that patients with PTPRD or TACC3 mutations had significantly shorter PFS compared to those without mutations (PTPRD: mPFS: 2.35 vs 12.15 months, p = 0.002; TACC3: mPFS: 2.70 vs 12.15 months, p = 0.008; Figure 3(b) and (c)). In addition, patients with PTPRD mutations had significantly shorter OS than those without mutations (mOS: 14.52 vs 23.73 months, p = 0.015; Figure 3(e)). Although patients with TACC3 mutations tend to have a shorter OS than those without mutations, the difference was not statistically significant (mOS: 17.12 vs 23.73 months, p = 0.091; Figure 3(f)). In addition, primary EGFR T790M mutations (2/35) and rare EGFR mutations present only in the primary resistant group (EGFR G719A/C: 2/35; EGFR S768I: 2/35) may contribute to primary resistance to EGFR-TKIs.
We attempted to detect gene rearrangements in both groups but found none in either group. In addition, we compared copy number variation between the two groups. Copy number gains potentially associated with resistance to EGFR-TKIs were present only in the primary resistant group: ERBB2 amplification (4/35) and MET amplification (2/35).
TMB and primary resistance to EGFR-TKIs
To investigate the relationship between TMB and primary resistance to EGFR-TKIs, we compared tTMB and bTMB in the primary resistant and sensitive groups. The median tTMB in the primary resistant and sensitive groups were 5.56 and 5.95 Mut/Mb (p = 0.86), respectively, while the median bTMB were 3.89 and 4.44 Mut/Mb (p = 0.98), respectively. No significant differences were observed, suggesting that TMB may not indicate primary resistance to EGFR-TKIs (Figure 4).

Tumor mutation burden. (a) Tissue tumor mutation burden in primary resistant and sensitive groups. (b) Blood tumor mutation burden in primary resistant and sensitive groups.
PD-L1 and primary resistance
PD-L1 expression was positive in 57.1% (20/35) of patients in the primary resistant group. Within this group, 34.3% (12/35) exhibited low PD-L1 expression, and 22.9% (8/35) exhibited high PD-L1 expression. By contrast, only 17.1% (6/35) of patients in the sensitive group were positive for PD-L1 expression, with 14.3% (5/35) showing low PD-L1 expression and 2.9% (1/35) showing high PD-L1 expression (Figure 5).

PD-L1 expression levels in primary resistant and sensitive groups.
Patients in the primary resistant group had significantly higher PD-L1 expression levels than those in the sensitive group, whether the PD-L1 expression threshold was 1% (p = 0.001) or 50% (p = 0.028; Table 2).
Differences in PD-L1 expression between primary resistant and sensitive groups.
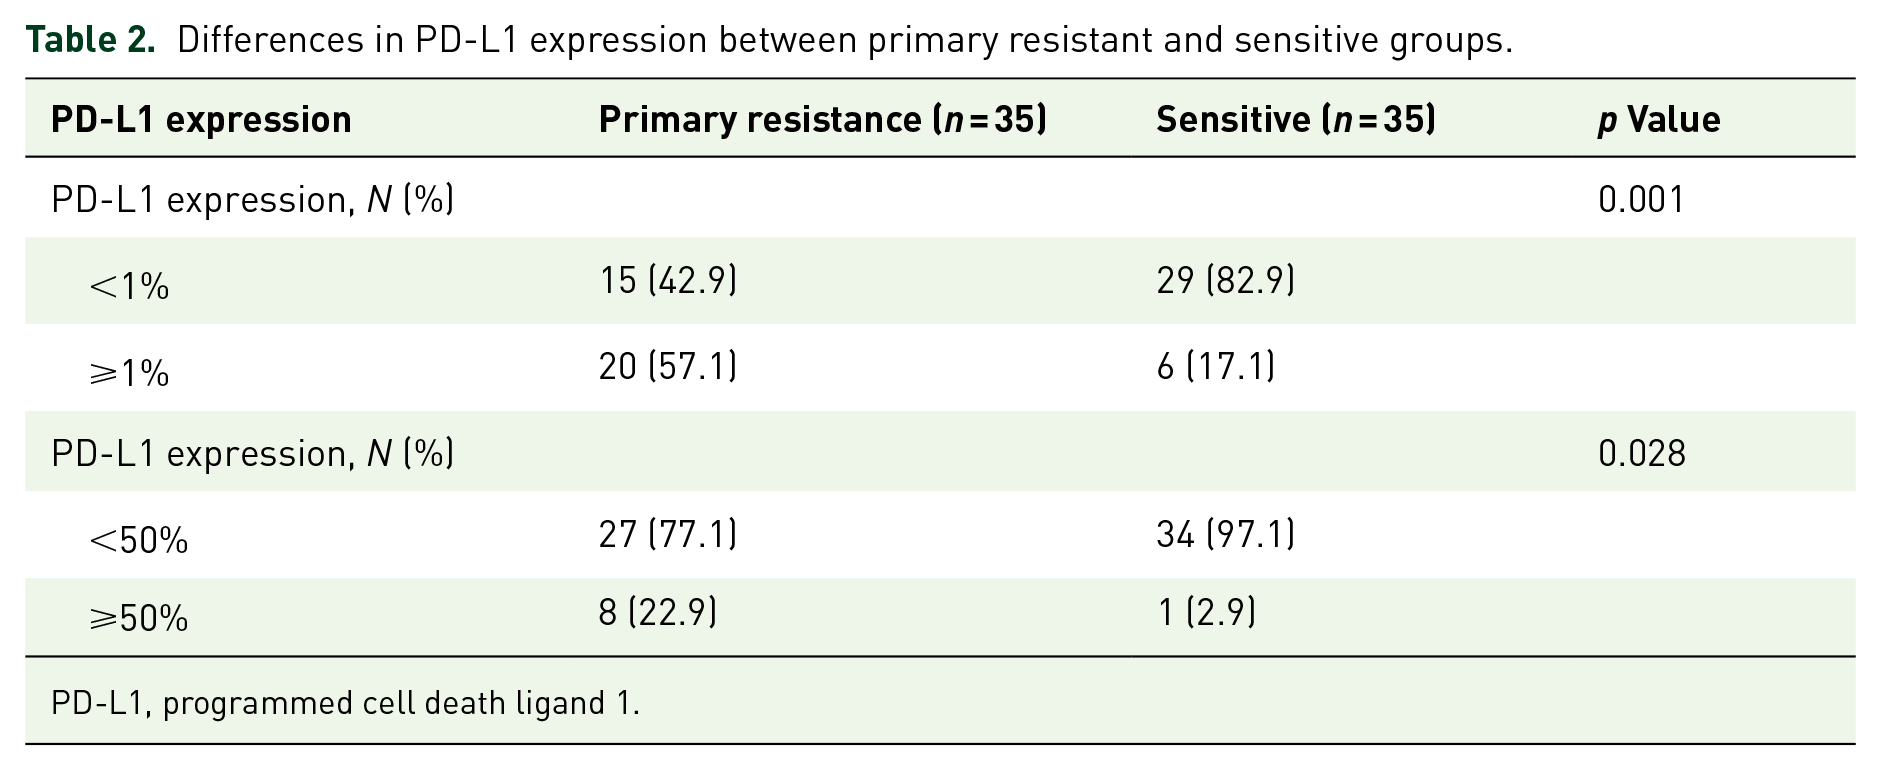
PD-L1, programmed cell death ligand 1.
The PFS and OS of patients with positive PD-L1 expression were significantly shorter compared to patients with negative PD-L1 expression (mPFS: 2.82 vs 12.80 months, p < 0.001; HR = 2.69, 95% CI: 1.58–4.58, p < 0.001; Figure 6(a); mOS: 15.67 vs 27.23 months, p < 0.001; HR = 2.68, 95% CI: 1.50–4.77, p < 0.001; Figure 6(b)).

Association of PD-L1 expression with PFS and OS. (a) PFS of patients with PD-L1 <1% or PD-L1 ⩾1%. (b) OS of patients with PD-L1 <1% or PD-L1 ⩾1%. (c) PFS of patients with PD-L1 negative, PD-L1 low expression, or PD-L1 high expression. (d) OS of patients with PD-L1 negative, PD-L1 low expression, or PD-L1 high expression.
Subgroup analysis explored the difference in PFS and OS between patients with negative PD-L1 expression, low PD-L1 expression, and high PD-L1 expression. The findings showed that PFS and OS of patients with high PD-L1 expression were significantly shorter compared to those with negative PD-L1 expression (mPFS: 2.47 vs 12.80 months, p < 0.001; HR = 4.02, 95% CI: 1.84–8.80, p < 0.001; mOS: 9.00 vs 27.23 months, p < 0.001; HR = 4.42, 95% CI: 2.00–9.74, p < 0.001; Figure 6(c) and (d)). PFS and OS of patients with low PD-L1 expression were also significantly shorter than those with negative PD-L1 expression (mPFS: 2.93 vs 12.80 months, p = 0.008; HR = 2.30, 95% CI: 1.26–4.18, p = 0.006; mOS: 18.00 vs 27.23 months, p = 0.029; HR = 2.17, 95% CI: 1.12–4.22, p = 0.022; Figure 6(c) and (d)). However, there were no significant differences in PFS and OS between patients with high PD-L1 and low PD-L1 expression (mPFS: 2.47 vs 2.93 months, p = 0.192; HR = 1.74, 95% CI: 0.76–4.00, p = 0.191; Figure 6(c)). The OS showed a shortening trend but was not significantly different (mOS: 9.0 vs 18.0 months, p = 0.088; HR = 2.05, 95% CI: 0.88–4.78, p = 0.095; Figure 6(d)).
Discussion
In this study, we used clinical samples of patients with NSCLC with primary resistance and sensitivity to EGFR-TKI treatment to perform 825-gene panel NGS and PD-L1 expression determination to explore predictable biomarkers for primary resistance to first- and second-generation EGFR-TKIs. Study results showed that the prediction mechanism for primary resistance to EGFR-TKIs had high heterogeneity. Some somatic cell mutations affecting tumor function and high PD-L1 expression may be associated with primary resistance. Currently, biopsy and genetic testing of tumor tissue samples are the gold standards for pathologic diagnosis and molecular profiling. However, these methods are limited by the availability and accessibility of biopsy tissue and tumor heterogeneity. Liquid biopsy has the advantages of being minimally invasive and replicable and can act as an adjunct to the biopsy results. Currently, liquid biopsy has wide clinical application value in guiding areas, including targeted therapy, efficacy monitoring, and prognosis assessment.15,16 The results of this study demonstrated that ctDNA liquid biopsy, based on NGS technology, had an 87.0% sensitivity and 100% specificity for detecting EGFR-sensitive mutations. When the biopsy of tumor tissue is difficult to obtain, the amount used for genetic testing is insufficient, or quality control fails, liquid biopsy can substitute for EGFR mutation testing to guide targeted therapy.
Somatic variations between primary resistant and sensitive groups were compared in this study. We found no significant correlation between the different EGFR 19del subtypes and primary resistance to EGFR-TKIs. There is still no consensus has been reached regarding the differences in clinical efficacy between patients with different EGFR 19del mutations who receive EGFR-TKI treatment. Gu et al. 17 identified 17 different EGFR 19del mutations in 101 patients and did not report significant differences in PFS or OS between the classic group (E746_A750del) and the non-classic group (the remaining variants). However, other studies have shown potential differences in the efficacy of EGFR-TKI, resistance mechanisms, and prognosis between different EGFR 19del subtypes. Patients with uncommon EGFR 19delins exhibit more evident clinical benefits from treatment with first-generation EGFR-TKIs. 18 Patients harboring deletions starting from L747 show a poorer prognosis than those with other subtypes. 19
TP53 was the most common concordant mutation; the TP53 exon 4 mutation was exclusive to the primary resistant group. The PFS and OS of the TP53 exon 4 mutation were significantly shorter than those of the TP53 wild type, which may be related to primary resistance. Multiple studies have shown that the PFS and OS significantly decreased for patients with NSCLC and TP53 concordant mutation receiving treatment with EGFR-TKIs.20–25 Analysis of resistance mechanisms in the FLAURA study showed that baseline TP53 missense mutations in tissues were associated with suboptimal tumor response, regardless of whether they were for first- or third-generation EGFR-TKIs. 26 Preliminary baseline tissue analysis in the FLAURA2 study also suggested TP53 alterations as a prognostic factor. 27 However, not all TP53 mutations will affect the prognosis of patients with EGFR mutation. Mutations in exons 4 and 6 of the TP53 gene are associated with poor prognosis. 28
In this study, the rate of PTPRD and TACC3 mutations in patients with primary resistance was also significantly higher than that in the sensitive group, and the PFS and OS of patients with PTPRD or TACC3 mutations were both shorter.29–31 Currently, PTPRD is the predictive biomarker for NSCLC immunotherapy, though its function in primary resistance to EGFR-TKI requires further research and validation. Studies show that high TACC3 expression is related to poor prognosis in lung adenocarcinoma32,33 and the FGFR3-TACC3 combination might be the mechanism of resistance to EGFR-TKI. 34 This study also identified some known mechanisms that may contribute to primary resistance to EGFR-TKI, including primary EGFR T790M mutations,35–38 rare EGFR mutations,39–41 ERBB2 amplification, 42 and MET amplification. 43 Zhong et al. 13 conducted NGS of 483 genes on tumor tissues from 11 primary resistant patients and 11 sensitive patients and found that mutations in downstream genes of EGFR (including MET amplification, PTEN deletion, and ERBB2 amplification), other somatic mutations, and single-nucleotide mutation patterns may contribute to primary resistance to EGFR-TKIs. In another study, NGS of 416 genes was performed on tumor samples and peripheral blood samples from 15 patients with short PFS and 17 patients with long PFS. 44 The study identified genes that possibly contribute to primary resistance to EGFR-TKIs, including CDC73, SMAD4, RB1, and PIK3CA, and reported signaling pathways enriched in patients with primary resistance to TKIs. Exploratory analysis of the FLAURA and FLAURA2 studies showed that MET amplification is a common mechanism of acquired resistance to all generations of EGFR-TKIs.26,27 The MARIPOSA study showed that first-line amivantamab in combination with lazertinib can alter the biological characteristics of acquired resistance compared to osimertinib and effectively inhibit resistance caused by changes in the EGFR and MET pathways. 45 These results highlight the need for comprehensive genomic analysis and combination therapies to address primary and acquired resistance. This study performed NGS on tumor tissues and matched peripheral blood samples of 70 patients in primary resistant and sensitive groups, which is a larger sample size compared to past research. Furthermore, the NGS testing panel included a total of 825 genes, which is larger and more comprehensive.
This study also aimed to explore the relationship between TMB and primary resistance to EGFR-TKIs. The results indicate no significant differences in tTMB and bTMB between primary resistant and sensitive groups. Another study, which included 153 patients with EGFR mutation, suggested a negative correlation between TMB and clinical prognosis in the patients with NSCLC treated with EGFR-TKIs. 46 However, our study did not show consistent results with past studies, possibly due to differences in research sample sizes. The role of TMB in predicting the efficacy and prognosis of treatment with EGFR-TKIs requires further investigation.
This study explored the relationship between PD-L1 expression levels and primary resistance to EGFR-TKIs. Results showed significantly higher PD-L1 expression in the primary resistant group compared to the sensitive group. High PD-L1 expression and primary resistance to EGFR-TKIs significantly correlate with shorter survival.47–49 This result is consistent with those of several previous studies: high PD-L1 expression is an important predictor of primary resistance to EGFR-TKI in patients with primary advanced EGFR-mutated lung adenocarcinoma.50–52 However, some studies have yielded different results, showing that the correlation between PD-L1 expression levels and EGFR-TKIs’ efficacy is insignificant. These inconsistent results are potentially due to PD-L1 expression heterogeneity within tumors and differences in detection methods and result interpretations. In this study, we focused on the relationship between PD-L1 expression level and primary resistance to EGFR-TKIs. Nevertheless, nearly half of the patients in the primary resistant group had negative PD-L1 expression, indicating that primary resistance to EGFR-TKIs has high heterogeneity; other mechanisms may also affect the therapy results. Thus, PD-L1 expression is not the only predictor of resistance.
In summary, although this study explored biomarkers related to primary resistance to EGFR-TKIs from multiple areas, it still has some limitations. Single-center retrospective studies have inherent limitations compared to prospective studies regarding bias and confounding factors. In addition, limitations in clinical sample quality (DNA degradation) and quantity restricted the number of enrolled patients. Future research should involve larger sample sizes. Furthermore, this study only included patients who were treated with first- and second-generation EGFR-TKIs as the first-line treatment. Future studies must include a third-generation EGFR-TKI treatment cohort to verify the universality of our conclusions. In addition, re-biopsy after drug resistance is not possible in retrospective studies, meaning that we could not perform a dynamic analysis of molecular profiling. In the future, prospective studies will be conducted to correlate the molecular profiles at baseline with those after drug resistance to more comprehensively explore the mechanism underlying primary resistance to EGFR-TKI.
Conclusion
The potential mechanisms of primary resistance to EGFR-TKIs are highly heterogeneous. Combining some somatic variants affecting tumor function and high PD-L1 expression may contribute to this resistance, which helps deepen the understanding of primary resistance mechanisms and guide individualized precision therapy. Prospective clinical studies with larger sample sizes and functional experiments are required in the future to further validate the precise relationship between these biomarkers and primary resistance to EGFR-TKIs.
Supplemental Material
sj-docx-1-tam-10.1177_17588359251336632 – Supplemental material for Potential biomarkers of primary resistance to first- and second-generation EGFR-TKIs in non-small-cell lung cancer: a real-world study
Supplemental material, sj-docx-1-tam-10.1177_17588359251336632 for Potential biomarkers of primary resistance to first- and second-generation EGFR-TKIs in non-small-cell lung cancer: a real-world study by Jingyi Wang, Bolin Chen, Xingxiang Pu, Jia Li, Yan Xu, Li Xu, Fang Xu, Kang Li, Yi Kong, Liyu Liu, Qianzhi Wang and Lin Wu in Therapeutic Advances in Medical Oncology
Supplemental Material
sj-docx-2-tam-10.1177_17588359251336632 – Supplemental material for Potential biomarkers of primary resistance to first- and second-generation EGFR-TKIs in non-small-cell lung cancer: a real-world study
Supplemental material, sj-docx-2-tam-10.1177_17588359251336632 for Potential biomarkers of primary resistance to first- and second-generation EGFR-TKIs in non-small-cell lung cancer: a real-world study by Jingyi Wang, Bolin Chen, Xingxiang Pu, Jia Li, Yan Xu, Li Xu, Fang Xu, Kang Li, Yi Kong, Liyu Liu, Qianzhi Wang and Lin Wu in Therapeutic Advances in Medical Oncology
Supplemental Material
sj-docx-3-tam-10.1177_17588359251336632 – Supplemental material for Potential biomarkers of primary resistance to first- and second-generation EGFR-TKIs in non-small-cell lung cancer: a real-world study
Supplemental material, sj-docx-3-tam-10.1177_17588359251336632 for Potential biomarkers of primary resistance to first- and second-generation EGFR-TKIs in non-small-cell lung cancer: a real-world study by Jingyi Wang, Bolin Chen, Xingxiang Pu, Jia Li, Yan Xu, Li Xu, Fang Xu, Kang Li, Yi Kong, Liyu Liu, Qianzhi Wang and Lin Wu in Therapeutic Advances in Medical Oncology
Footnotes
References
Supplementary Material
Please find the following supplemental material available below.
For Open Access articles published under a Creative Commons License, all supplemental material carries the same license as the article it is associated with.
For non-Open Access articles published, all supplemental material carries a non-exclusive license, and permission requests for re-use of supplemental material or any part of supplemental material shall be sent directly to the copyright owner as specified in the copyright notice associated with the article.