
Abstract
Background:
Dysregulated pathways in cancer may be hub addicted. Identifying these dysregulated networks for targeting might lead to novel therapeutic options.
Objective:
Considering the hypothesis that central hubs are associated with increased lethality, identifying key hub targets within central networks could lead to the development of novel drugs with improved efficacy in advanced metastatic solid tumors.
Design:
Exploring transcriptomic data (22,000 gene products) from the WINTHER trial (N = 101 patients with various metastatic cancers), in which both tumor and normal organ-matched tissue were available.
Methods:
A retrospective in silico analysis of all genes in the transcriptome was conducted to identify genes different in expression between tumor and normal tissues (paired t-test) and to determine their association with survival outcomes using survival analysis (Cox proportional hazard regression algorithm). Based on the biological relevance of the identified genes, hub targets of interest within central networks were then pinpointed. Patients were grouped based on the expression level of these genes (K-mean clustering), and the association of these groups with survival was examined (Cox proportional hazard regression algorithm, Forest plot, and Kaplan–Meier plot).
Results:
We identified four key central hub genes—PLOD3, ARHGAP11A, RNF216, and CDCA8, for which high expression in tumor tissue compared to analogous normal tissue had the most significant correlation with worse outcomes. The correlation was independent of tumor or treatment type. The combination of the four genes showed the highest significance and correlation with the poorer outcome: overall survival (hazard ratio (95% confidence interval (CI)) = 10.5 (3.43–31.9) p = 9.12E−07 log-rank test in a Cox proportional hazard regression model). Findings were validated in independent cohorts.
Conclusion:
The expression of PLOD3, ARHGAP11A, RNF216, and CDCA8 constitute, when combined, a prognostic tool, agnostic of tumor type and previous treatments. These genes represent potential targets for intercepting central hub networks in various cancers, offering avenues for novel therapeutic interventions.
Introduction
The clinical benefit of approved drugs generally is reflected by an increase in median progression-free survival (PFS) and overall survival (OS), with durations ranging from several weeks to several months. Unfortunately, cancer cells develop resistance mechanisms, in particular when they are administered as monotherapies.1–4 Indeed, networks dysregulated in malignancies evolve to resist common perturbations, such as the action of specific therapies, but are highly fragile when encountering rare ones. Identifying these rare disruptions can collapse entire oncogenic networks. Robust networks often become overly reliant on specific key components (genes), known as “hubs”. Dysregulated networks may be hub-addicted, meaning they develop a strong dependence on certain hubs, such as those involved in energy and metabolism, PI3K (phosphoinositide 3-kinase), Akt (serine/threonine kinase), or mTOR (mechanistic target of rapamycin kinase). Targeting these less common points with specific drugs could potentially collapse the entire network.1–3 The association between hub genes and cancer lethality is supported by multiple studies, highlighting the importance of these genes in cancer progression and patient prognosis.5–7 Since hub centrality may breed lethality, the identification of key hub targets of central networks may represent an important driver of novel drug development programs, aiming to increase the overall efficacy of treatments in advanced metastatic solid tumors and consequently improve survival outcomes.
A variety of factors influence a patient’s clinical outcome, including intrinsic characteristics of the cancer and the effects of therapies. Intrinsic characteristics may include specific genes that are prognostic biomarkers or predictive biomarkers that should be differentiated. Prognostic markers are used to identify persons who are more likely than similar individuals without the biomarker to experience a certain outcome regardless of treatment.8,9 Predictive biomarkers enable the prediction of treatment response.8,9 Common examples of predictive biomarkers are genes such as estrogen receptor, HER2/neu in breast cancer, and EGFR mutations in non-small-cell lung cancer (NSCLC).9,10 Since prognostic biomarkers may reflect biologic processes, they can also be targets for modulation by pharmacologic intervention. For instance, HER2 positivity is a marker of poor prognosis in breast cancer but is also predictive of response to HER2 antibodies and small molecular HER2 inhibitors.11,12
Here we present a panel of novel prognostic central hub biomarkers that are independent of tumor type. Mandating prospective analyses, these genes could also potentially be predictive and be targeted with a novel generation of specific interceptors (drugs) developed to collapse central hub key genes within dysregulated networks and thus enhance the performance of targeted therapies for patients with metastatic solid tumors and prolong survival.
Materials and methods
The reporting of this study conforms to the STROBE statement. 13
Dataset
The analysis presented in this study used the dataset generated by the WINTHER clinical trial which included a cohort of 101 patients with various metastatic cancer in multiple clinical sites across the world (France, Spain, Israel, and Canada). 14 In all, 34 patients had colorectal carcinomas (CRC), 20 patients had head and neck (HN) carcinomas, 18 patients had NSCLC, and the remaining 29 patients had a variety of other types of cancers (breast, bladder, liver, melanoma, gastrointestinal, etc.). The patients’ median age was 59 years, 60% were males, and 40% were females. Patients had one to seven previous lines of treatment before enrollment in the WINTHER trial, with a median of three previous lines. The WINTHER trial did not include randomization or blinding approaches. The patients had available tumor and normal matched biopsies, a full profile of transcriptomic and genomics that informed the therapeutic choice, and clinical data including outcome—both PFS and OS. The OS in the WINTHER clinical trial was defined by the length of time from the start date of treatment to death or time last known to be alive, while the PFS was defined by the length of time from the start date of treatment to progression. 14
In the WINTHER trial, it was demonstrated that the level of basal gene expression was highly variable between individuals and therefore a potential confounder of interpretation of gene expression in tumor tissue. 14 Hence, to eliminate this variability, the transcriptomic expression level was assessed by comparing the tumor tissue to its normal histologic counterpart.
Statistical analysis
All the genes in the transcriptome (approximately 22,000 genes) were reviewed for association between their expression in the tumor tissue with the survival outcome (OS) using a survival analysis. The survival analysis was done using the Cox proportional hazard regression model using the “survival” and “survminer” packages in R.15–17 Patients who had missing expression values for the genes of interest in the survival analysis were excluded from the analysis. For that reason, some of the analyses include less than 101 patients. The level of significance (p-value) was corrected for multiple comparisons using the Benjamini and Hochberg method. 18 Similarly, all genes in the transcriptome were reviewed for association between their expression in the normal tissue with the OS outcome. In the next step, we explored the difference between the expression of all genes in the tumor versus the normal tissues using a paired t-test with a 95% confidence interval (CI). Again, the p-values were adjusted using the false discovery rate methodology. 18 At this point, we were able to search for genes that demonstrated high differences between the tumor and the normal tissues, and also to identify which of these genes (in tumor and normal tissues separately), correlated with outcome (OS). The search was refined by focusing on genes that had less impact in the normal tissue, meaning the intensity in the tumor was higher than the intensity in normal. Testing the difference between the tumor and the normal gene expression was visualized using boxplots. The boxplots show the median (reflected by the line that divides the box into two parts) and the interquartile range (shown by the box itself). The points shown outside the box are outlier expression values. The significant difference between the expression values in the tumor and the normal was derived using a paired student t-test with 95% CI. By searching for the genes that had a high association with survival (OS) and a high impact on the tumor tissues, and by taking into consideration the biological relevance, we were able to identify four genes (Figure 1).
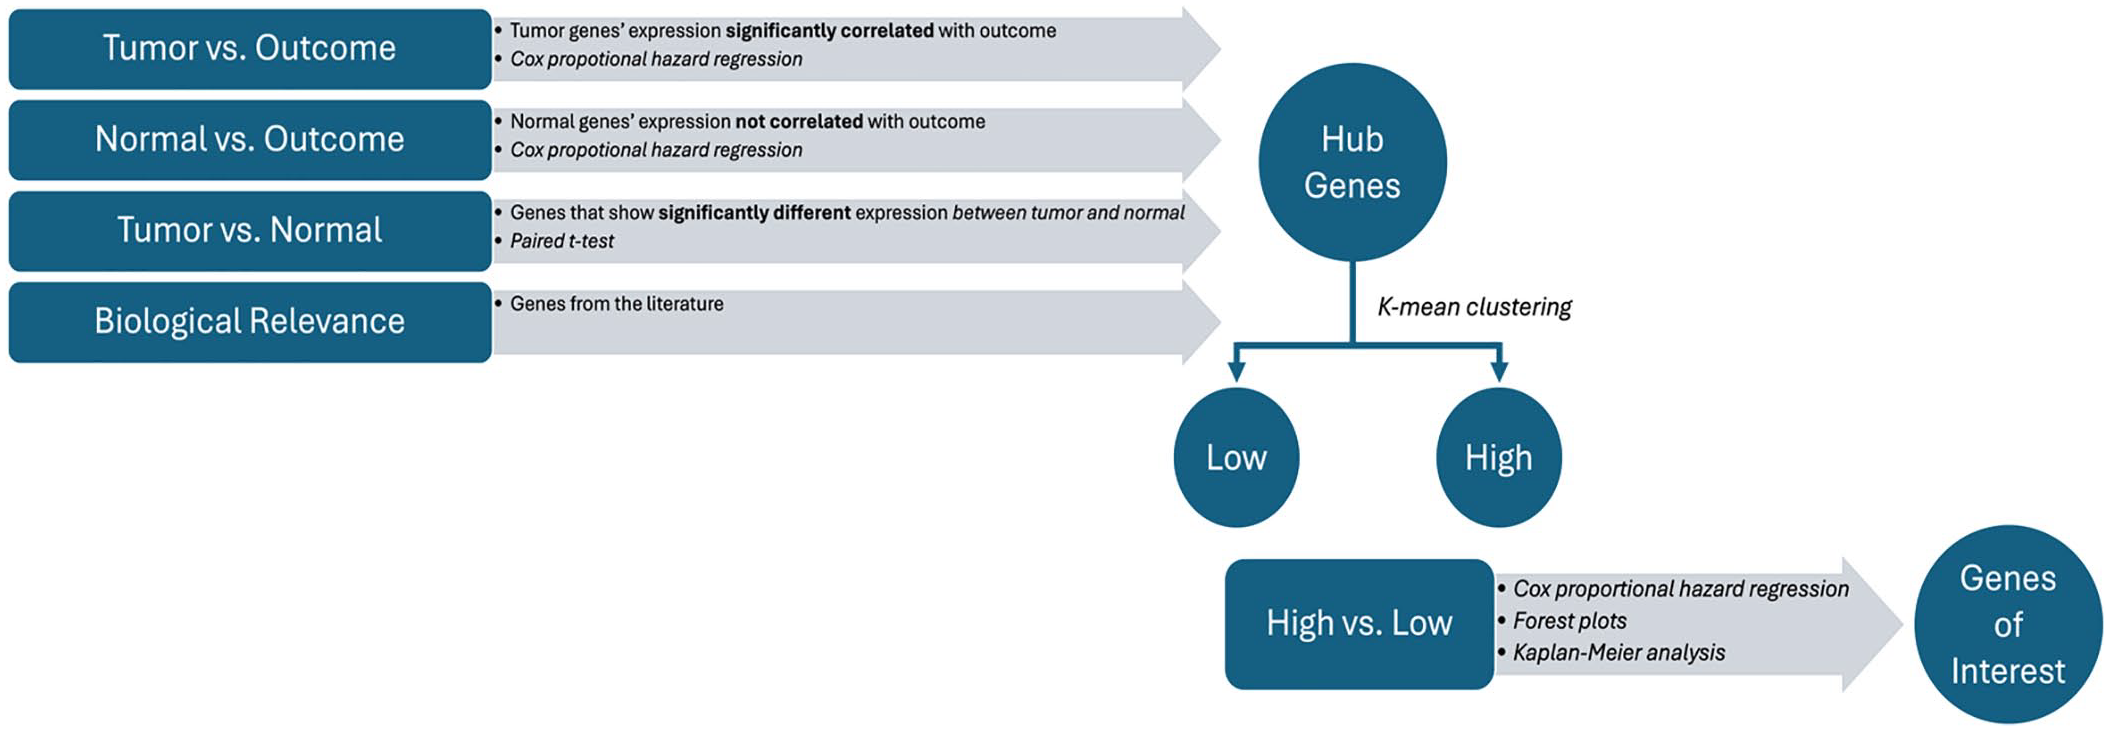
Study design for finding hub genes and test their prognosis value.
We investigated the survival analysis of each of the four selected genes alone and in combination. The patients from the WINTHER trial were classified based on the level of expression of the four genes into “high” and “low” groups using the K-means clustering (K = 2) method. K-means is an unsupervised machine learning algorithm used for the portioning of a dataset into K distinct non-overlapping clusters, minimizing the within-cluster sum of squares. 19 The “high” and “low” groups were then used in the Cox proportional hazard regression model to test the association of these groups with survival (OS). When considering the genes in combination, the patients were classified as “low” if all four genes were classified as “low”. Similarly, the patients were classified as “high” if all four genes were classified as “high”. Patients with a mixture combination of “low” and “high” were classified together in a third group called “others”. The analysis included investigations using the Forest plot and Kaplan–Meier (KM) plot. In the Forest plot, we investigated the association between multiple variables used to subgroup patients from the study with the survival outcomes. Patients were grouped by the variables of sex, site/type of the tumor, and the combined expression of the four genes. Each line in the Forest plot displays the hazard ratio (HR) and CI for an individual subgroup. For each variable, we used the HRs (shown as a square) to indicate the effect of the variable on the risk for an event (progression or death) to occur. HRs greater than 1 indicate increased risk, while HRs less than 1 suggest reduced risk. The CI (indicated as the length of the horizontal lines) indicates the precision of the estimates. Shorter lines indicate more precise estimates, while longer lines suggest less precision.
In the KM analysis, we estimated the survival probabilities over time and compared the survival rates of the patients from the gene expression groups. The log-rank test was used to determine the level of significance of the differences between the survival curves of the groups.
Validation
Validation of the four biomarkers for their survival prognostic potential was completed on independent publicly available datasets using the KM Plotter tool. 20 We used Chip-Seq mRNA datasets from breast cancer patients and RNA-Seq mRNA datasets including lung adenocarcinoma and kidney renal clear cell carcinoma patients. The four biomarkers were analyzed in a multivariable analysis taking the mean expression of the genes while assigning them an equal weight. The survival values that were used were OS. The datasets were taken as a whole, without filtering for histology type, stage, grade, gender, treatment groups, or any other characteristics. Biased arrays were excluded from the analysis. The cutoff for classifying the patients in each dataset into high and low expressers of the biomarkers was used by setting an auto-select best cutoff, which resembles most of the K-mean clustering we implemented in our analysis on the WINTHER dataset.
Results
In continuity with the recently published digital display precision predictor (DDPP) algorithm correlating gene expression with clinical outcomes, 21 we identified the genes whose tumor overexpression (compared to analogous normal) (t-test) significantly correlated with OS in the database of 101 patients with advanced solid tumors from the WINTHER trial, for whom gene expression (whole transcriptome—approximately 22,000 genes) in tumor and analogous normal tissues was available.
The criteria to select the most relevant genes were as follows: (1) higher association between OS and intensity of expression in the tumor based on the Cox proportional hazard regression model; (2) lower or no association between OS and intensity of expression in the normal tissue based on Cox proportional hazard regression model; (3) significant difference in expression between tumor and normal tissues (paired student’s t-test); (4) greater impact on median OS; and (5) biological relevance. Based on these criteria (Figure 1), four genes were selected: PLOD3, ARHGAP11A, RNF216, and CDCA8, as described in Table 1.
Main characteristics of the prognostic genes.

CPC, chromosomal passenger complex; KM, Kaplan–Meier; OS, overall survival; RIP, receptor-interacting protein; TNF, tumor necrosis factor.
Supplemental Figure 1(a)–(d) presents the paired student’s t-test (boxplots) comparing the level of expressions in tumor and normal tissues, separately for each gene: PLOD3 (adjusted p-value = 5.76E−22), ARHGAP11A (adjusted p-value = 1.92E−06), RNF216 (adjusted p-value = 8.06E−19), and CDCA8 (adjusted p-value = 3.76E−10). Supplemental Figure 1(e)–(h) shows the KM survival analysis which was used to visualize the impact of the expression level of the genes selected (high and low) on OS separately for each gene—PLOD3 (KM log-rank test p = 1.95E−06), ARHGAP11A (KM log-rank test p = 6.1E−06), RNF216 (KM log-rank test p = 1.23E−05), and CDCA8 (KM log-rank test p = 7.1E−05). The combined expression profile of the four genes, established by the level of its expression (high vs low), showed the highest significance and correlation with the outcome: OS p = 9.12E−07 and PFS p = 0.009 log-rank test, as shown in Figure 2(a) and (b), respectively. The cutoff low-high of the expression was determined by K-means clustering (K = 2), as described in the “Methods” section.
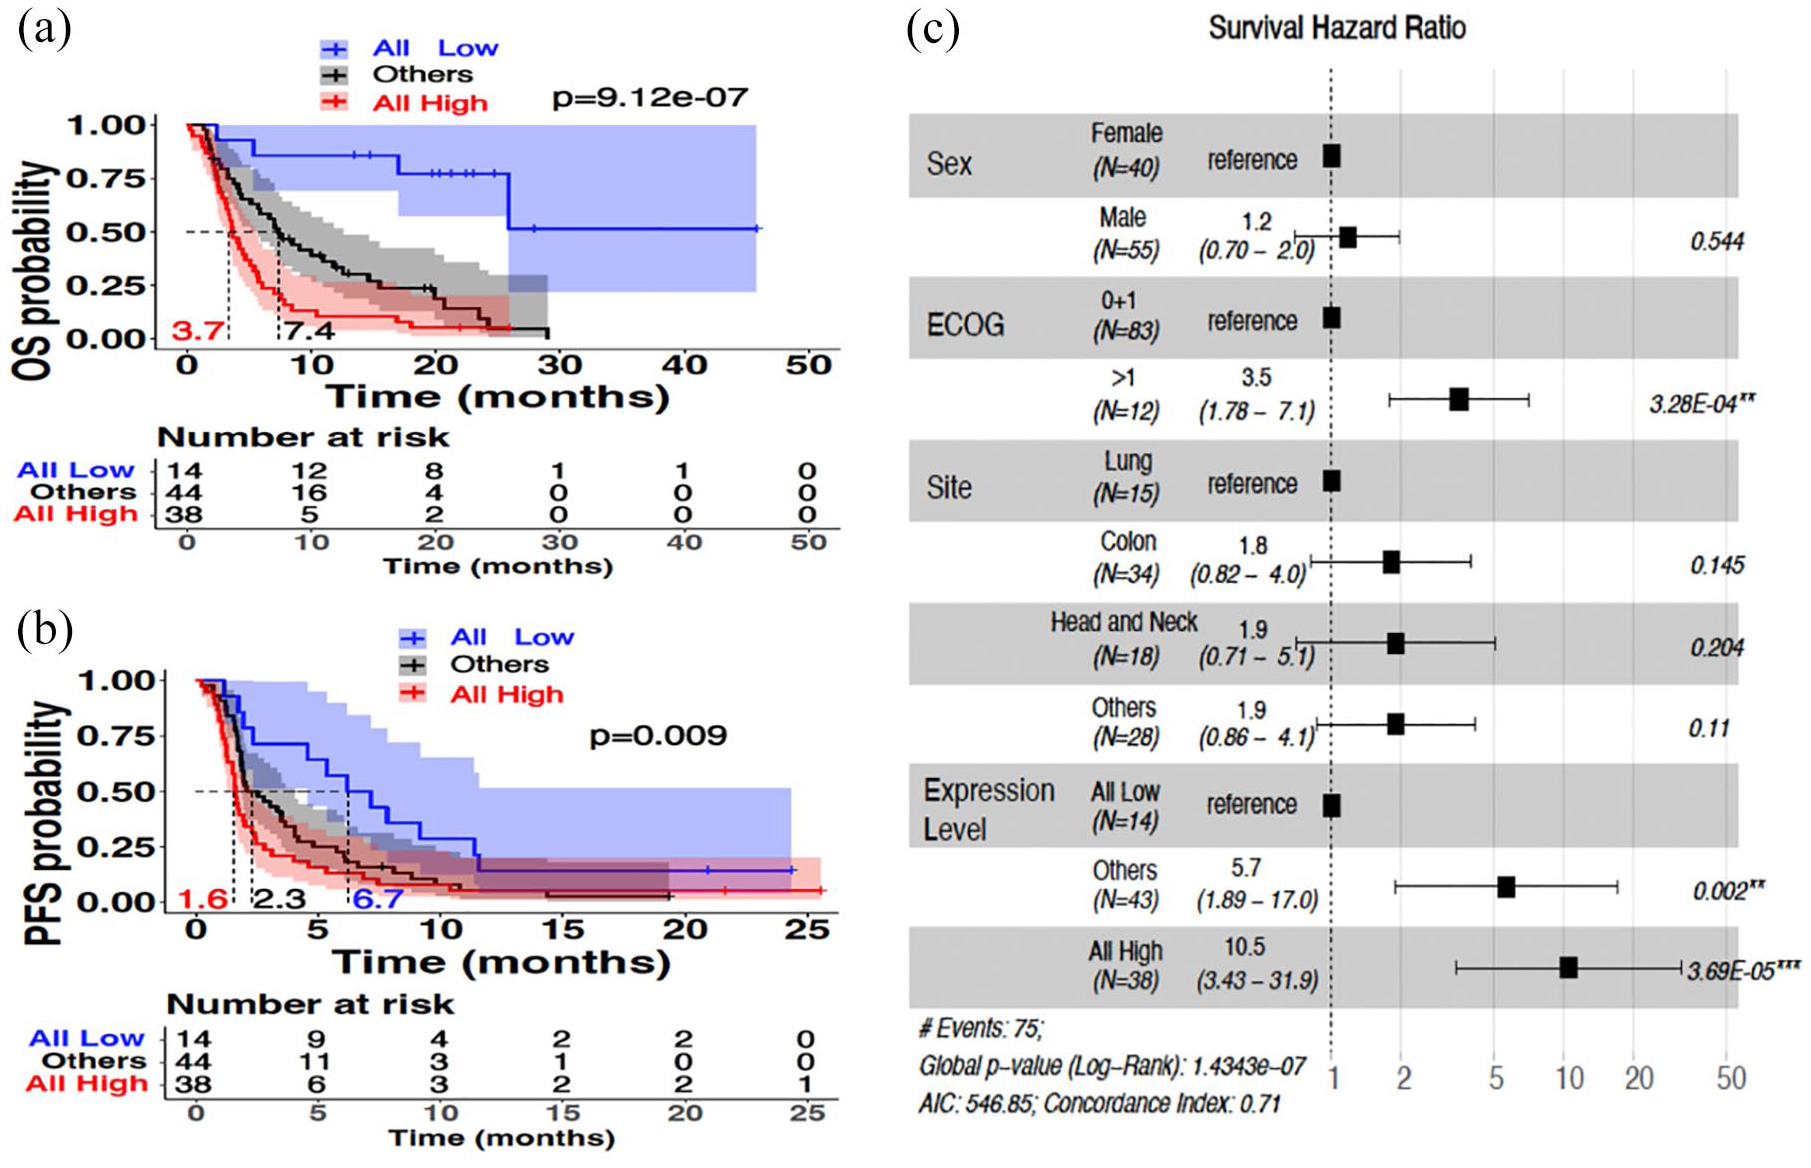
Univariate and multivariate Cox proportional regression hazard survival models on WINTHER dataset. (a) KM shows the OS probability based on the level of expression of the prognostic genes in the tumor tissue (n = 96). Patients with high expression across all four prognostic genes (n = 38, red line) showed a median OS of 3.7 months. The median of the patients with low expression across all the prognostic genes (n = 14, blue line) could not be obtained since at the last time point the survival probability was greater than 50%. All other patients (n = 44, black line) showed a median OS of 7.4 months. (b) KM shows the PFS probability based on the level of expression of the prognostic genes in the tumor tissue. Patients with high expression across all four prognostic genes showed a median PFS of 1.6 months. Patients with low expression across all the prognostic genes showed a median OS of 6.7 months. All other patients showed a median OS of 2.3 months. (c) Forest plot which includes several covariates—sex, ECOG performance status, site of cancer tissue, and level of expression of the prognostic genes in the tumor tissue—demonstrates the survival hazard ratio of each (given as a point estimate along with the 95% CI in brackets). Hazard ratios greater than 1 (shown to the right with respect to the reference for each covariate) indicate better outcomes. p-Values (log-rank) with 95% CIs are shown in the plot for all the covariates included in the model.
The association between conventional clinical and biological characteristics of the patients with OS is illustrated by the Forest Plot for the Cox proportional hazard regression model analysis (Figure 2(c)). This analysis investigated biological sex (male and female), site/type of the tumor: NSCLC, CRC, HN, and others; as well as ECOG status (0 and 1 vs >1), and the combined expression profile of the four genes (each classified into high vs low, as determined for each gene by K-means clustering): the “low” group includes patients in which all four genes classified as low, the “high” group includes patients in which all four genes classified as high, and the “other” group includes patients with all other combinations of a mixture of high and low. The HR of each characteristic with OS is shown in Figure 2(c). Taking ECOG 0 + 1 as a reference compared with ECOG > 1, the HR for high ECOG status was: HR = 3.5 with a 95% CI (1.78–7.1) (p = 3.28E−04). Taking, as a reference, the combined low expression of the four genes, the HR of the combined high expression group in all four genes was 10.5 with a 95% CI (3.43–31.9) (p = 3.69E−05). The site of the tumors was not significantly associated with OS, confirming the agnostic tumor type trend of the analysis. Taken together, high versus low expression of genes PLOD3, ARHGAP11, RNF216, and CDCA8 constitutes an independent prognostic marker, agnostic of tumor type.
Supplemental Figure 2 illustrates the distribution of the site/type of the tumors and of the ECOG performance status of the patients in the WINTHER dataset per risk groups (low risk corresponds to patients who are classified with “low” expression level in all four genes, high risk corresponds to patients who are classified with “high” expression level in all four genes, and intermediate risk corresponds to all other patients).
Supplemental Figure 3 illustrates the enrichment distribution of TP53 (3/14 (21.4%) vs 29/38 (76.3%) in the low- vs high-risk groups; p = 0.0003 (Chi-square)) and RAS mutations in the tumors at high risk (shortest OS) (1/14 (7.1%) vs 16/38 (42.1%) in the low- vs high-risk groups; p = 0.04 (Chi-square)) (highest risk group have high PLOD3, ARHGAP11A, RNF216, and CDCA8). EGFR alterations had very low frequency in all risk levels (4/96 (4%)). The distribution of the mTOR–AkT–PI3K pathway enrichment was shown in 24.8% (24/96) of all patients, mainly in the intermediate risk group (13/44 (29.5%)).
Validation in independent datasets
While the use of tumor and organ-matched normal tissues to determine comparative transcriptomic expression was essential for the identification and ranking of the four genes, once selected, we could perform correlative studies using the only expression in tumor biopsies. Validation of the four biomarkers panel for its survival prognostic potential was completed on independent publicly available datasets. Datasets were identified using the “KM plotter” tool described in the “Methods” section http://kmplot.com/analysis/index.php?p=background. 20
Figure 3 shows the KM survival probability plots in the independent cohorts constituted of patients with NSCLC adenocarcinomas (Figure 3(a)), breast cancers (Figure 3(b)), and renal clear cell carcinomas (Figure 3(c)).

Multivariate analysis of PLOD3, ARHGAP11A, RNF216, and CDCA8 in validation datasets. KM plots (a–d) show the survival probability based on the expression of the prognostic genes in different independent datasets.20,23 The patients in the validation cohorts were classified as “high” or “low” based on the expression of the prognostic genes. The number of patients surviving at each point in time as indicated by the x-axis is presented in the table below each plot. (a) RNA-Seq lung adenocarcinoma dataset. 20 HR = 2.2 (1.51–3.21) with 95% CI (log-rank p-value = 2.6E−05). Median survival in patients with low expression of the four genes is 77.27 months and in patients with high expression in the four genes is 40.97 months. (b) Chip-Seq breast cancer dataset. 20 HR = 1.64 (1.25–2.16) with 95% CI (log-rank p-value = 3.8E–04). Upper quartile survival in patients with low expression of the four genes is 136.8 months and in patients with high expression in the four genes is 63.83 months. (c) RNA-Seq kidney renal clear cell carcinoma dataset. 20 HR = 1.61 (1.19–2.18) with 95% CI (log-rank p-value = 0.0017). Upper quartile survival in patients with low expression of the four genes is 48.77 months and in patients with high expression in the four genes is 28.87 months. (d) KM plot showing the PFS probability in an Agilent microarrays breast cancer dataset. 23 (e) Forest plot multivariate Cox proportional hazard survival model analyses of main clinical biological and transcriptomics variables in an Agilent microarrays breast cancer dataset. 23
The cohort of NSCLC adenocarcinomas (Figure 3(a)) consisted of 504 patients with stage I being 54%, stage II 23%, stage III 17%, and stage IV 6%. The correlation with OS was highly significant: HR = 2.2 (1.51–3.21) with 95% CI (log-rank p-value = 2.6E−05). Median survival in patients with low expression of the four genes is 77.27 months and in patients with high expression in the four genes is 40.97 months. The association between the identified genes and OS was also highly significant in the breast cancer cohort (n = 943, HR = 1.64 (1.25–2.16) with 95% CI (log-rank p-value = 3.8E−04)). Median survival in patients with low expression of the four genes is 136.8 months and in patients with high expression in the four genes is 63.83 months. For renal clear cell carcinoma: (n = 530, HR = 1.61 (1.19–2.18) with 95% CI (log-rank p-value = 0.0017)). Median survival in patients with low expression of the four genes is 48.77 months and in patients with high expression in the four genes is 28.87 months.
It is worthwhile to outline that these validation cohorts are different from WINTHER cohort, 14 as they are tumor specific and include patients with all stages, and a high proportion of stage I, which are usually treated by surgery. Nevertheless, the prognostic signature is significantly associated with OS.
Therefore, we selected another independent validation dataset that focuses on metastatic disease. Figure 3(d) and (e) presents data from a neoadjuvant study in breast cancer in which only PFS was reported. 23 Figure 3(d) shows the KM PFS probability plot, with a significant correlation between the high expression of PLOD3, ARHGAP11A, and CDCA8 (the expression of RNF216 was not available in this dataset), and a shorter PFS (p = 3.5E−05). Figure 3(e) presents the Forest plot of the multivariate Cox regression hazard model showing the independent covariates that correlate with the outcome. The high expression of the three genes is an independent variable significantly associated with shorter PFS: HR: 8.46 (1.13–63.38) with a 95% CI (p = 0.038).
Discussion
The primary goal of any intervention in oncology is to improve OS and/or quality of life. A better understanding of cancer biology has led to the development of targeted therapies specifically designed to modulate an altered molecular pathway in cancer cells or their microenvironment. Despite the identification of molecular targets across cancer types, most targeted therapies were developed per cancer type. 24 Drug development, which in the past only considered the primary origin of the tumor, more recently included molecular targets present in the disease. Lung cancer is a striking example. Whereas EGFR mutations are quite frequent (10%–20% of Caucasian patients and 50% of Asian patients), several other actionable genomic alterations are less frequent, including but not limited to KRAS G12C mutation (13%), ALK translocation (5%), HER2 mutation (3%), MET activation (3%), BRAF V600 mutation (2%), and ROS1 translocation (1%).25–29 Therefore, biomarker strategies are now part of the standard of care. Most approved biomarker strategies include predominantly DNA sequencing and immunohistochemistry. Expanding investigations beyond DNA and integration of transcriptomics is still infrequent. 30 With few exceptions (Oncotype, Mammaprint), there is no consensus on the use of molecular transcriptomic signatures in the clinic, and the reason is mostly related to difficulties in the analytic interpretation of data, due to high interpatient variability.
Many current studies require tumor biopsy for omics interrogation. From the initial description in the BATTLE trial, 31 the use of lung tumor biopsies spread in a few years and became part of standard care, especially for obtaining genomic sequencing of DNA. However, next-generation studies, such as those described herein, may examine transcriptomics and, this has proven more challenging because of patient and organ heterogeneity that introduces analytic noise32,33; moreover, requirements for quality of biopsies are more stringent for transcriptomics (fresh frozen biopsies, a threshold of minimum 40%–50% content of tumor cells, and absence of contamination by surrounding tissue of the metastatic lesions selected for biopsies). In the current study, to address the interpatient variability of basal gene expression, we compared expression in organ-matched normal tissues from the same patient to the expression of genes in the tumor and, in continuation to the recently published novel algorithm DDPP, 21 which demonstrated the feasibility of dual biopsies (tumor and normal tissues) and the development of novel RNA investigation tools that theses biopsies enabled.14,21
Expanding biomarker exploration to transcriptomics enabled us to address the measurement of genetic distance between tumor and normal cells, and use this comparison to prioritize the use of various targeted therapies in the WINTHER clinical trial. 14 Our current study focuses on the identification of novel prognostic biomarkers, across tumor types, and using as a criterion of selection the correlation observed with the outcome (PFS and/or OS). The study was possible using the WINTHER dataset. 14 Using the WINTHER pan-cancer dataset has the potential to enable the identification of common molecular and clinical features that influence prognosis across multiple cancer types.34–37 By understanding common pathways underlying cancer progression and metastasis, universal biomarkers that can serve as targets for therapeutic intervention can be identified and benefit patients across multiple cancer types.38–41
A breakthrough occurred in the history of oncology when, for the first time, the FDA approved an anticancer drug based on a molecular alteration in a tissue-agnostic way. The first tumor-agnostic approval was for pembrolizumab, an immunotherapy mainly acting on T cells in patients with high microsatellite instability or a mismatch repair (MMR) deficiency. 42 More recently, larotrectinib 43 and entrectinib44,45 and also other drugs obtained marketing authorization for tumors with molecular alterations in a tissue-agnostic way. 45 Following this trend of investigating biology agnostic of tumor type, 46 we explored the whole transcriptome to identify novel prognostic biomarkers, through the correlation of their expression and outcome. These genes were selected and ranked after exploring the whole transcriptome. High transcriptomic expression of these genes in tumors, as compared with organ-matched normal tissues, was significantly associated, with each gene independently with shorter OS. When combined, high expression of PLOD3, ARHGAP11, RNF216, and CDCA8 was significantly associated with shorter PFS and OS and may constitute a novel prognostic molecular signature, to identify those patients with the risk of the worst outcome.
It is worthwhile to mention that the collection of the paired tissue samples (tumor and normal-matched tissues), which allowed us to indicate the four genes, is not typically part of standard-of-care procedures. However, once discovered, the expression of the hub genes in the tumor tissue alone can be used to identify patients who might benefit from interceptors of these genes as targets. The data were validated in three independent datasets in NSCLC, breast, and kidney-renal cell carcinomas, beyond the WINTHER pan-cancer dataset that was used for discovery. The fact that the data were validated on heterogeneous independent datasets, which included patients across all disease stages and not just those in the metastatic stage, strengthens the findings. Nevertheless, we also included an independent breast cancer dataset that specifically contained samples from patients in the metastatic stage, to further bolster the robustness of our findings.
The association between high expression of certain genes and poor survival outcomes in cancer is well documented.47–50 Multiple studies have found that genes occupying central “hub” positions within gene regulatory networks tend to be linked to decreased survival in cancer patients.51–53 This indicates the importance of hub genes in cancer progression and patient prognosis. Based on the evidence from the literature, the four genes found in our analysis appear to have essential roles in central hub networks. This central positioning of the genes seems to be a common feature across many different tumor types.
Mutations of the PLOD3 gene generate connective tissue disorders and over-expression promotes lung metastasis via regulation of STAT3.54,55 Our findings that the high PLOD3 expression correlates with shorter OS (Supplemental Figure 1(e)) support its role as a driver of aggressive tumor behavior and suggest it could be a target for therapeutic strategies aimed at inhibiting metastasis. A recent study supports our findings and highlights the potential of PLOD3 as a promising therapeutic target, showing that over-expression of PLOD3 in CRC patients with liver metastasis is significantly associated with poor outcomes. 56 In this study, we expand the findings on a pan-cancer cohort. ARHGAP11A is involved in the regulation of the Rho family of GTPases, which are critical in cell morphology, migration, and invasion. Blockade of ARHGAP11A reverses malignant progression via inactivating Rac1B in hepatocellular carcinoma. 57 Also, the prognosis value of ARHGAP11A alone was shown in clear cell renal cell carcinoma where high expression of the gene was associated with shorter survival. 58 The significant association between high ARHGAP11A expression and shorter OS observed in our pan-cancer study (Supplemental Figure 1(f)) supports its role in tumor progression and metastasis, making it a promising target for therapeutic intervention. RNF216 interacts with receptor-interacting protein and inhibits tumor necrosis factor (TNF)- and IL1-induced NF-kappa B activation. 59 RNF216 contributes to the proliferation and migration of colorectal cancer via suppressing BECN1-dependent autophagy. 60 The association of high RNF216 expression with shorter survival (Supplemental Figure 1(g)) in our results highlights its potential as a prognostic marker and a therapeutic target to inhibit cancer cell proliferation and prolong survival. High expression of CDCA8 was found independent predictor for a poor prognosis in liver cancer. 61 Over-expression of CDCA8 promotes the malignant progression of cutaneous melanoma and leads to poor prognosis. 62 Our results reinforce the significance of CDCA8 in cancer prognosis and suggest that targeting CDCA8 could be a viable approach to controlling tumor growth and improving patient outcomes. The identification of these genes as significantly associated with shorter OS suggests that they play crucial roles in tumor biology and could serve as biomarkers. In addition, while these genes have already shown prognosis values in previous studies in various cancer types, as previously listed, the findings of this study expand their potential in an agnostic way. Targeting these genes could potentially lead to the development of new therapeutic strategies aimed at improving patient survival. For instance, inhibitors of PLOD3, ARHGAP11A, RNF216, and CDCA8 could be developed and tested in clinical trials, alone or in combinations, to assess their efficacy in reducing tumor growth and metastasis.
In addition to being agnostic to the tumor site, as shown in the Forest plot results, the four genes are also agnostic to type and number of previous treatments (median of three previous lines). Although the number of previous lines of treatments is not shown as a biological characteristic in the Forest plot, it was tested and found insignificant.
One limitation is that the dataset size is limited. Increasing the size of the cohort would strengthen the results and reduce any variability that could be linked to ethnic differences between the patients. The findings need to be validated prospectively, especially when it comes to targeting the combination of all four genes.
Conclusion
Taken together, our findings are in line with numerous other observations pointing to a role of PLOD3, ARHGAP11A, RNF216, and CDCA8 in the pathogenesis of different types of solid tumors, suggesting their effects may be agnostic of tumor type. Our data suggest a prognostic value of high expression of these genes, alone and in particular in combination. Moreover, these results confirm and extend accumulating data reflecting the critical importance of assessing transcriptomic data to fully understand tumor biology.30,63–65
Supplemental Material
sj-docx-1-tam-10.1177_17588359241289200 – Supplemental material for Identification of a central network hub of key prognostic genes based on correlation between transcriptomics and survival in patients with metastatic solid tumors
Supplemental material, sj-docx-1-tam-10.1177_17588359241289200 for Identification of a central network hub of key prognostic genes based on correlation between transcriptomics and survival in patients with metastatic solid tumors by Vladimir Lazar, Eric Raymond, Shai Magidi, Catherine Bresson, Fanny Wunder, Ioana Berindan-Neagoe, Annemilaï Tijeras-Rabaland, Jacques Raynaud, Amir Onn, Michel Ducreux, Gerald Batist, Ulrik Lassen, Fin Cilius Nielsen, Richard L. Schilsky, Eitan Rubin and Razelle Kurzrock in Therapeutic Advances in Medical Oncology
Supplemental Material
sj-docx-2-tam-10.1177_17588359241289200 – Supplemental material for Identification of a central network hub of key prognostic genes based on correlation between transcriptomics and survival in patients with metastatic solid tumors
Supplemental material, sj-docx-2-tam-10.1177_17588359241289200 for Identification of a central network hub of key prognostic genes based on correlation between transcriptomics and survival in patients with metastatic solid tumors by Vladimir Lazar, Eric Raymond, Shai Magidi, Catherine Bresson, Fanny Wunder, Ioana Berindan-Neagoe, Annemilaï Tijeras-Rabaland, Jacques Raynaud, Amir Onn, Michel Ducreux, Gerald Batist, Ulrik Lassen, Fin Cilius Nielsen, Richard L. Schilsky, Eitan Rubin and Razelle Kurzrock in Therapeutic Advances in Medical Oncology
Footnotes
References
Supplementary Material
Please find the following supplemental material available below.
For Open Access articles published under a Creative Commons License, all supplemental material carries the same license as the article it is associated with.
For non-Open Access articles published, all supplemental material carries a non-exclusive license, and permission requests for re-use of supplemental material or any part of supplemental material shall be sent directly to the copyright owner as specified in the copyright notice associated with the article.