
Abstract
Background:
Identifying actionable driver mutations via tissue-based comprehensive genomic profiling (CGP) is paramount in treatment decisions for metastatic non-squamous, non-small-cell lung cancer (NSCLC). However, the role of CGP remains elusive in resectable NSCLC. Here, we elucidate the feasibility of CGP in early-stage NSCLC Korean patients and compare the tumor mutational burden (TMB) and mutation landscape using three different platforms.
Methods:
All surgically resected NSCLC samples (N = 96) were analyzed to assess the concordance in TMB calculation and targetable mutations using whole-exome sequencing (WES) and TruSight Oncology 500 (TSO500). In all, 26 samples were analyzed with Foundation One CDx Assay (F1CDx). Programmed death-ligand 1 (PD-L1) expression was evaluated using Vectra Polaris.
Results:
Stage distribution post-surgery was 80% I (N = 77) and 20% II (N = 19). Ninety-nine percent (N = 95) were adenocarcinoma. The median TMB with WES and TSO500 was 1.6 and 4.7 mut/Mb, respectively (p < 0.05). Using all three platforms, the median TMB was 1.9, 5.5, and 4 mut/Mb for WES, TSO500, and F1CDx, respectively (p = 0.0048). Linear regression analysis of TMB values calculated between WES and TSO500 resulted in a concordance correlation coefficient of 0.83. For the PD-L1 tumor proportion score of <1% (negative, N = 18), 1–49% (low, N = 68), and ⩾50% (high, N = 10), the R2 values were 0.075, 0.79, and 0.95, respectively. The R2 values for TMB concordance were variable between the three platforms. Mutation landscape revealed EGFR mutation (51%, N = 49) as the most common actionable driver mutation, comprising L858R (N = 22), E19del (N = 20), and other non-common EGFR mutations (N = 7).
Conclusion:
TSO500 and F1CDx showed robust analytical performance for TMB assessment with TSO500 showing stronger concordance of TMB with high PD-L1 expression. As the paradigm for the management of early-resected NSCLC continues to evolve, understanding TMB and the mutation landscape may help advance clinical outcomes for this subset of patients.
Keywords
Introduction
Lung cancer has the leading incidence and mortality rates of cancer worldwide. The annual report of the Korean National Cancer Registration Statistics lists lung cancer as the third highest reported among all cancers and the first leading cause of cancer-related death in Korea. 1 Non-small-cell lung cancer (NSCLC) is the most prevalent subtype of lung cancer, accounting for 85% of cases. 2 At diagnosis, 20% are diagnosed with advanced or metastatic disease 3 and require systemic treatments, including targeted therapy and immunotherapy. 4 Singh et al. provide evidence-based recommendations updating the 2020 ASCO and Ontario Health (Cancer Care Ontario) guidelines on systemic therapy for patients with stage IV NSCLC without driver molecular alterations. This evidence was based on the identification of NSCLC targets in 31% of cases following comprehensive gene profiling and more than 15% of patients changing their current therapy based on results from comprehensive profiling. National Comprehensive Cancer Network guidelines recommend comprehensive molecular profiling, but often EGFR mutation and ALK rearrangement are the only mutations tested in clinical practice. The list of driver molecular alterations as well as approved targeted therapies in NSCLC patients is expanding to include rare oncogenic mutations such as BRAF V600E, MET exon 14, HER2 mutations, and NTRK and RET fusions. 5 In patients with first-line immune checkpoint inhibitor therapy followed by crizotinib 6 or osimertinib 7 increased the rates of severe immune-related adverse events. There is a potential benefit in detecting molecular alterations earlier with comprehensive genomic profiling (CGP).
For patients with early-stage NSCLC without actionable genomic alterations (AGAs) and programmed death-ligand 1 (PD-L1) expression, efforts are ongoing to validate and optimize techniques, including CGP, to detect early and identify actionable therapeutic targets. CGP is valuable in metastatic NSCLC; however, it is not mandatory for early resectable NSCLC. In lieu of doing a single gene assay repeatedly, CGP is more comprehensive and gives information on co-occurring mutations as well as information on fusions. 8 Samples retrieved from small biopsies with low tissue yield quality can be an issue 9 and CGP is more feasible when tissue yield is an issue.
Over the last decade, lung cancer screening efforts have escalated to identify prognostic factors. Improvements in the survival rate of patients with advanced and metastatic NSCLC are associated with changes in treatment, particularly the introduction of targeted and immunotherapy.10–12
Broad molecular diagnosis to identify driver mutation is necessary for early detection and identifying proper treatment. 13 Over time, next-generation sequencing (NGS) has enabled the detection of various EGFR mutations, and overcome the limitations of single gene assay, including digital droplet polymerase chain reaction. 14 Compared to Europe or the USA,15,16 Korea has a high percentage of EGFR mutations in adenocarcinoma, ranging from 17% to 51%, a finding similar to other Asian countries. 17 In the ADAURA phase III study, adjuvant osimertinib in patients with EGFR-mutated stage IB–IIIA NSCLC after complete tumor resection, with or without adjuvant chemotherapy, demonstrated significant and clinically meaningful overall survival (OS) benefit.18,19 This is the first global study to demonstrate statistically significant disease-free survival (DFS) and OS benefit in early-stage NSCLC. Despite this early promising data, it remains critically important to perform an adequate sequencing of tumor samples to determine the best treatment approach for early-stage NSCLC patients.
For patients with activating mutation, such as EGFR exon 19 deletion or L858R substitution, the targeted agent is the mainstay of first-line treatment. There is, however, a significant unmet need for improved treatments as adjuvant chemotherapy produces only a 4–5% increase in 5-year survival rates. 20 For those without AGAs, immunotherapeutic agents such as anti-PD1 antibodies are adopted. Tumor mutational burden (TMB), a measure of the total number of somatic mutations in a given tumor, became a promising predictive marker to be adopted in clinical practice. 21 For those patients without AGAs, pembrolizumab, for example, an anti-PD1 antibody, is approved for the treatment of patients with unresectable or metastatic solid tumors with high TMB, defined as ⩾10/Mb. 22 Whole-exome sequencing (WES) provides accurate TMB measurement, but it is rarely used in routine clinical practice due to cost, turnaround time, and required amount of DNA input from formalin-fixed, paraffin-embedded (FFPE) tissue. Instead, single-gene panels or multiplex panels are used for CGP in routine cancer testing. TruSight Oncology 500 (TSO500; Illumina, CA, USA) is an NGS comprehensive assay that analyzes multiple variant types and key biomarkers in 500+ genes across DNA and RNA in a single assay. Here, we aimed to validate the TSO500 assay compared to WES in terms of concordance in TMB calculation and identification of targetable mutations in 96 Korean patients with early-stage NSCLC undergoing primary surgery.
Methods
Patient and study design
Data of patients who were diagnosed with resectable NSCLC between October 2011 and April 2020 at Yonsei Cancer Center were collected. Patients who had no prior exposure to treatment including anti-PD-1 agents and targeted therapy, and underwent primary surgery were included. Clinicopathological variables such as sex, histology type, and pathologic staging were collected. Fresh normal and tumor tissues were obtained from NSCLC patients undergoing primary surgery. After resection, 96 samples were collected and isolated from normal blood samples and FFPE tumor specimens. The tumor percentages of FFPE were all over 40%. Written informed consent from the patients was documented before the samples were obtained using protocols approved by the institutional review board at Yonsei Cancer Center.
Libraries preparation and sequencing
WES, TSO500 (Illumina), and Foundation One CDx Assay (F1CDx) (Cambridge, MA, USA) were performed. Genomic DNA (gDNA) was isolated using the DNeasy Blood & Tissue Kits (Qiagen, Inc., Hilden, Germany). The concentration and purity of gDNA were assessed by agarose gel electrophoresis and PicoGreen dsDNA assay (Invitrogen, Waltham, MA, USA). Exome libraries were generated from 96 samples and matching normal blood samples using SureSelect v6 Kit (Agilent Technologies, Santa Clara, CA, USA) and sequenced on NovaSeq 6000 (Illumina). The average read depth of WES data was 191 for tumor and 148 for normal and satisfied the mapping quality (MQ) ⩾ 20 and base quality (BQ) ⩾ 30 cutoffs. TSO500 using 96 tumor samples was sequenced on NextSeq 500 targeting 523 genes, and F1CDx using 26 tumor samples targets 324 genes sequenced on Hiseq 2500 (Illumina).
Mutation call platforms
Sequencing reads were mapped to the human chromosome (hg19). Mutation calling was performed through the pipeline included in Illumina Dragen (v3.10) for WES data, the TSO500 (v2.0) for TSO500, and the internal pipeline for F1CDx. TSO500 sequencing data were analyzed with the TSO500 Local App Version 2.1.0.70 (Illumina). For somatic mutation calling, matched normal and tumor data were used in WES, and only tumor data were used in the others. Somatic mutations were acquired by (i) filtering out germline mutations with allele frequencies >0.01 in the Exome Aggregation Consortium database, (ii) mutation allele frequencies <0.05, and (iii) read depth. For WES and F1CDx, the read depth was set to 100 or higher, and for TSO500, the filtering threshold was set to 50 or higher. Somatic mutation results were annotated with Oncotator. 23
TMB calculation and correlation analysis
TMB values were calculated using the total number of all synonymous and non-synonymous variants filtered by 5% allele frequency and sufficient coverage threshold. TMB was reported as a mutation per coding region (mut/Mb), of which F1CDx used values rounded to the nearest integer. The TMB calculation of WES data used the parameters tmb-vaf-threshold = 0.05 and vc-callability-tumor-thresh = 50 in the TMB calculation function of the DRAGEN built-in pipeline. Correlation analysis was visualized with R packages (scatterplot, ggplot).
Multiplex staining FFPE
Multiplex staining was performed on 4-mm FFPE tissue sections with PD-L1 (Agilent Technologies; clone 22C3, no dilution), pan-cytokeratin (NOVUS; EA1/EA3, dilution 1:200, CO, USA), and the Opal 7-color automation IHC kit (Akoya Biosciences, Marlborough, MA, USA). In the process of the multiplex IHC on the BondRx autostainer (Leica Bioscience, Deer Park, IL, USA), heat-induced epitope retrieval of deparaffinized FFPE sections was performed by citrate (pH 6.0) or Tris/ethylenediaminetetraacetic acid (pH 9.0) buffers. Then, tissue sections were sequentially incubated with primary antibodies, secondary horseradish peroxidase-labeled antibodies, and Opal dyes (Akoya Biosciences) to detect fluorescence, followed by incubation with Spectral DAPI (4′,6-diamidino-2-phenylindole, Akoya Biosciences) for counterstain.
Evaluation of PD-L1 expressions
The images (200× magnification) of whole tissue contents were generated by whole-slide scanning by Vectra Polaris (Akoya Biosciences). Multispectral images (MSI) to be analyzed were defined and selected on the whole tissue images using the Phenochart software, whole slide contextual viewer (Akoya Biosciences). The integral algorithm of inForm® (Akoya Biosciences) as a tissue analysis software was used to convert MSI to numeric data, which consisted of the spatial information, definition of cell components (nuclear, cytosol, and cell membrane), classifications of cell populations, and intensities of each marker. For evaluation of PD-L1 expression, TPS was determined as the number of PD-L1-expression tumor cells (TCs) divided by the total TC counts, multiplied by 100. 24
Statistics
For the concordance of TMB values in each panel, the scatter plot and squared correlation coefficient were calculated using the ggscatter package. The concordance correlation coefficient (CCC) was calculated using the CCC function of the DescTools r package. TMB values were confirmed for normality through the Shapiro–Wilk normality test. Statistical significance was examined using the Wilcox test, a nonparametric statistical test tool. For the three panels, statistical significance was confirmed using the Kruskal–Wallis test.
Results
Of the 96 patients, 44% (N = 42) were male (Supplemental Table S1). This study consisted of early surgically resected lung cancer samples of stages I (80%) and II (20%) Most (n = 95, 99%) patients had histology type of adenocarcinoma, and 47% (N = 45) had EGFR mutations by WES data. In WES data, somatic mutation calling was performed using matched blood samples. None of the samples had sampling issues or QC failures. The median TMB was 4.3 mutations/Mb. PD-L1 expression of <1%, 1–49%, and ⩾50% accounted for 18% (N = 19), 68% (N = 71), and 10% (N = 10), respectively.
Tumor mutational burden
For the 96 samples analyzed using WES and TSO500, the median total TMB calculated by WES was 1.57 mutations/Mb, compared to 4.7 mutations/Mb by TSO500. The median total TMB differed significantly between WES and TSO500 (p = 2.3e−08) [Figure 1(a)]. For the TMB calculated for the 26 samples analyzed using WES, TSO500, and F1CDx, the median total TMB calculated by WES was 1.88 mutations/Mb [Figure 1(b)]. By contrast, the median TMB calculated was 5.5 and 4 mutations/Mb by TSO500 and F1CDx, respectively. There was no significant difference between the three methods of calculating TMB. Individual patient TMB calculations for both data sets are shown in Supplemental Figure S1.
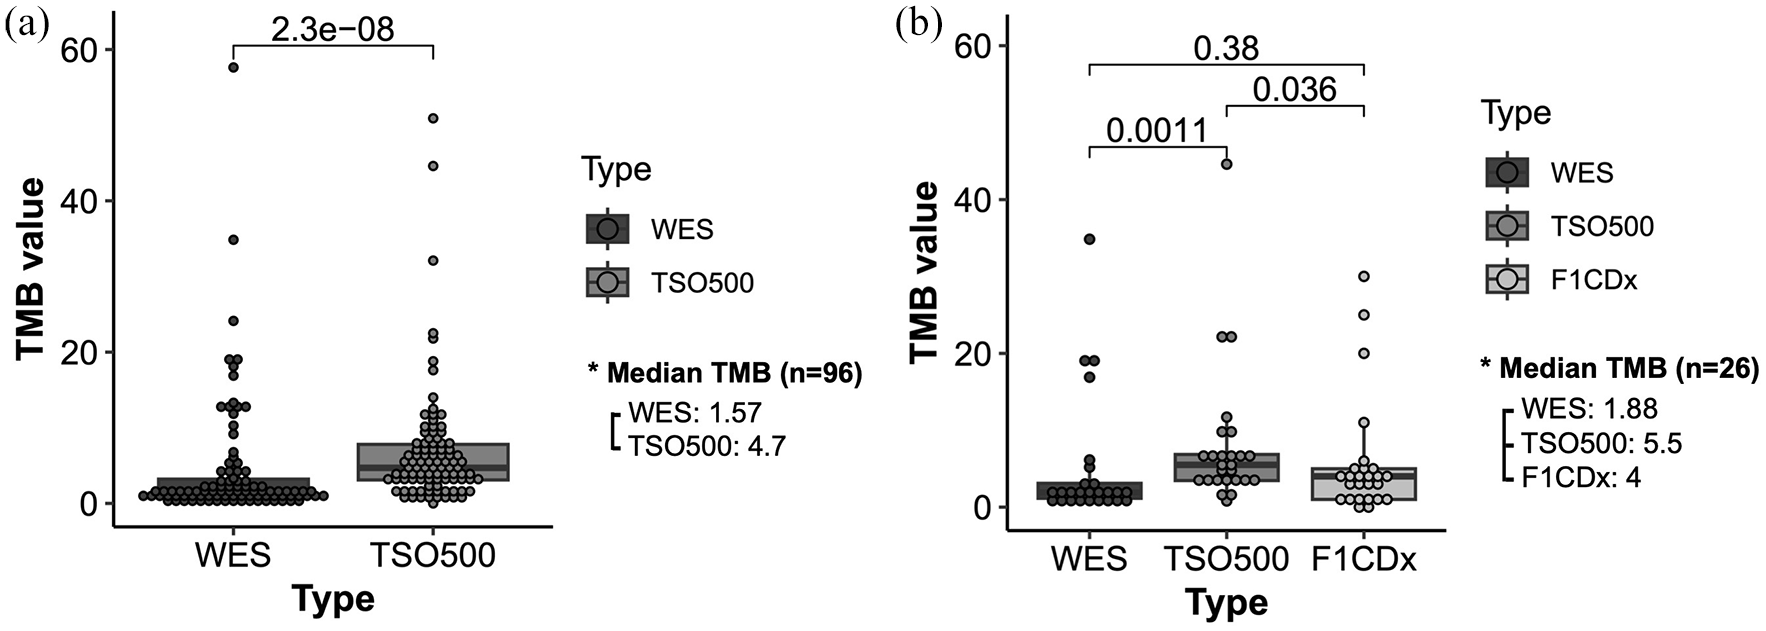
TMB analysis (a) for 96 samples analyzed using WES and TSO500. The median total TMB calculated by WES was 1.57 mutations/Mb, compared to 4.7 mutations/Mb by TSO500. The median total TMB differed significantly between WES and TSO500. (b) 26 samples were analyzed using WES, TSO500, and F1CDx. The median total TMB calculated by WES was 1.88 mutations/Mb. By contrast, the median TMB calculated by TSO500 was 5.5 mutations/Mb and by F1CDx was 4 mutations/Mb. There was no significant difference between the three methods of calculating TMB.
Correlation between three platforms
The analytical performance of TSO500 and F1CDx was compared with the reference standard method [Figure 2(a)]. For 96 samples analyzed using WES and TSO500, the linear regression analysis of TMB values calculated with WES versus TSO500 resulted in R2 = 0.76, with eight measurements (8.3%) outside the 95% limits of confidence for agreement between WES and TSO500.
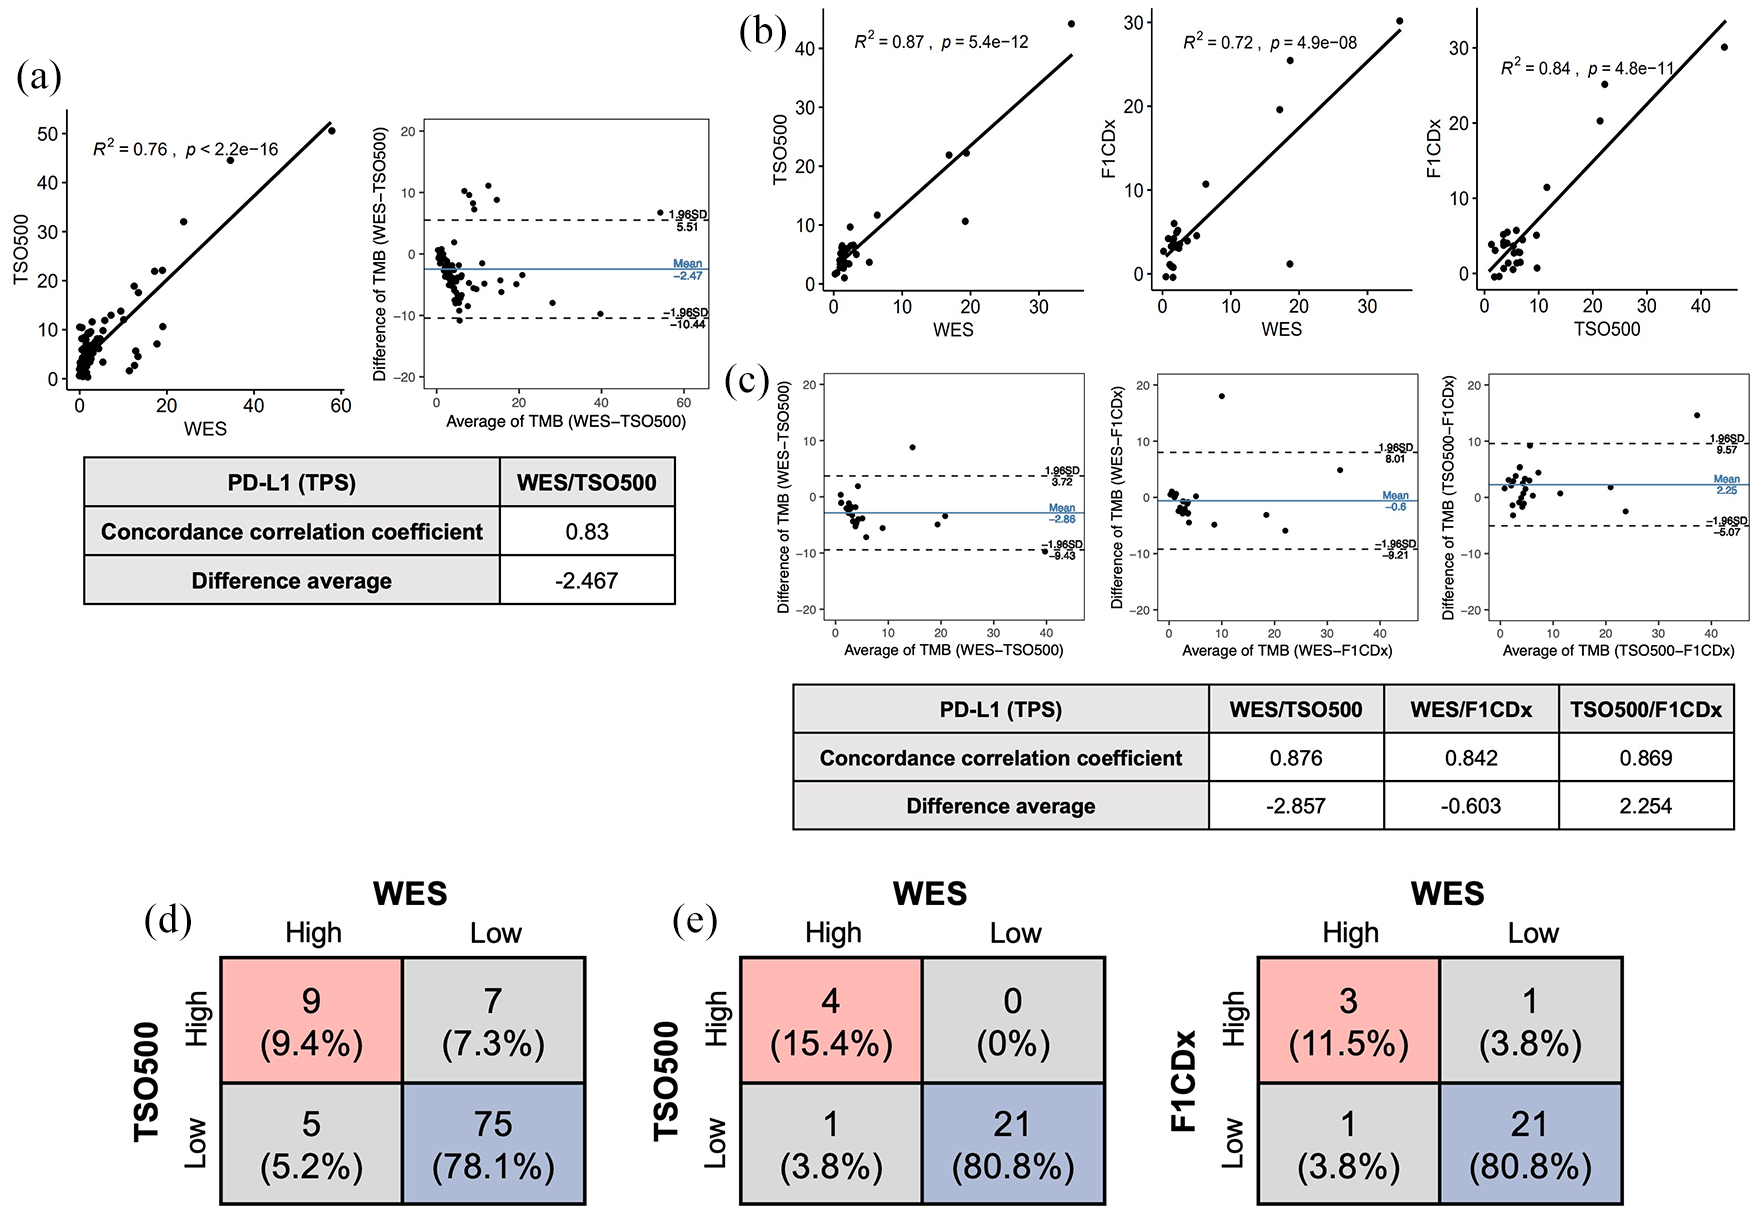
Analytical performance of TSO500 and F1CDx compared with the reference standard method. (a) 96 samples were analyzed using WES and TSO500. (b) 26 samples were analyzed using WES, TSO500, and F1CDx. (c) A Bland–Altman plot demonstrates agreement between the two analytical methods. (d) The concordance rate between WES and TSO500 for high and low TMB is based on the TMB cutoff (threshold = 10) (N = 96). (e) The concordance rate between WES, TSO500, and F1CDx for high and low TMB is based on TMB cutoff (threshold = 10) (N = 26).
For the 26 samples analyzed using WES, TSO500, and F1CDx, a linear regression analysis of TMB values was calculated [Figure 2(b)]. WES versus TSO500 resulted in an R2 = 0.87, while that for WES versus F1CDx was 0.72. The linear regression analysis of TMB values calculated with TSO500 versus F1CDx resulted in a R2 = 0.84. The systemic difference in absolute terms between TSO500 versus F1CDx was 2.254, with one measurement (3.8%) outside the 95% limits of confidence for agreement.
A Bland–Altman plot demonstrates agreement between the two analytical methods [Figure 2(c)]. The CCC values were 0.876 (for WES and TSO500), 0.842 (for WES and F1CDx), and 0.869 (TSO500 and F1CDx). The systemic difference in absolute terms was −2.857, with two measurements (7.7%) outside the 95% limits of confidence for agreement between WES and TSO500, and −0.603 with one measurement (3.8%) outside the 95% limits of confidence for agreement between WES and F1CDx.
The correlation was calculated after samples were categorized as high or low TMB according to the cutoff value of 10 mut/Mb. For 96 samples analyzed using WES and TSO500, 75 patients (78%) were designated in the low TMB group (<10 mut/Mb), and 9 patients (9%) were designated in the high TMB group (⩾10 mut/Mb) using both WES and TSO500 [Figure 2(d)]. Hence, a total of 84 patients (88%) were designated in the same group using WES and TSO500.
Using WES and TSO500, 21 patients were designated in the low TMB group, and 4 patients were designated in the high TMB group [Figure 2(e)]. Hence, a total of 25 patients (96%) were designated in the same group using WES and TSO500. Using WES and F1CDx, 21 patients were designated in the low TMB group, and 3 patients were designated in the high TMB group. Hence, a total of 24 patients (92%) were designated in the same group using WES and F1CDx.
Correlations by PD-L1 expression
We also analyzed the extent of agreement among the tests in subgroups of NSCLC samples separated by PD-L1 expression [Figure 3(a)]. PD-L1 were classified as PD-L1 negative (<1%, N = 18), low (1–49%, N = 68), and high (⩾50%, N = 10), and was analyzed with Vectra Polaris accordingly [Figure 3(b)]. Correlation analysis for WES and TSO500 provided R2 = 0.79 (CCC = 0.845) for tumors with low PD-L1 expression and R2 = 0.95 (CCC = 0.886) for tumors with high PD-L1 expression. However, the R2 value dropped to 0.075 (CCC = 0.22) for WES and TSO500 for tumors with negative PD-L1 expression.

(a) TMB concordance analysis between WES and TSO500 according to PD-L1 expression (negative, low, and high expressions) (N = 96). (b) Vectra Polaris image according to PD-L1 expression (negative, low, and high expressions). PD-L1 expression is defined as negative (<1%), low (1–49%), and high (⩾50%).
For 26 samples analyzed using WES, TSO500, and F1CDx, subgroups of NSCLC samples were separated by PD-L1 expression as PD-L1 negative (defined as <1%, N = 6) or positive (defined as ⩾1%, N = 20) (Supplemental Figure S2). Correlation analyses of tumors negative for PD-L1 expression provided R2 values of 0.21 for WES versus TSO500, 0.47 for TSO500 versus F1CDx, and 0.09 for WES versus F1CDx. In the PD-L1-positive group, the R2 value was 0.87 (WES versus TSO500), 0.86 (TSO500 versus F1CDx), and 0.73 (WES versus F1CDx). The analysis for PD-L1-negative tumors did not show a correlation due to a small number of samples (N = 6).
Mutational landscape
Next, we analyzed the mutational landscape of samples using WES and TSO500 (N = 96) [Figure 4(a)]. The most commonly detected mutation was EGFR mutations (51%, N = 49) with L858R (N = 22), E19del (N = 20), and other mutations (N = 7) defined as non-common EGFR mutations. TP53 was the next common mutation, accounting for (N = 40). A mutational landscape with three panels (N = 26) revealed that compared to WES and F1CDx, TSO500 detected other EGFR mutations [Figure 4(b)]. Overall, EGFR mutations including activating mutations such as L858R and E19del identified via TSO500 were in concordance with that of WES data (Supplemental Table S2).

(a) Top 20 mutation landscapes with 96 patients WES, TSO500, and F1CDx data. (b) Top 20 mutation landscape with 26 patients WES, TSO500, and F1CDx data.
Focusing on the activating EGFR mutation, that is, L858R and E19del, there was no concordance between WES and TSO500 (N = 96) except in four samples [Supplemental Figure S3(A)]. There was one sample (P235) with EGFR L858R mutation that was detected with both WES and TSO500. However, the low mutation allele frequency (MAF) identified with TSO500 resulted in filtering out the result. There were three samples (P244, P224, and P204) with E19del that were only detected using TSO500, but not WES. Using WES, one sample P224 with E19del was subtly detected, one sample (P244) did not reach a read depth of 100, and one sample (P204) had no EGFR mutation, thereby implying the heterogeneity in the distribution of EGFR-mutant TCs within the same sample. Non-common EGFR mutations (N = 7) include exon 20 insertion mutation and several missense mutations (Supplemental Table S3). Although exon 20 insertion mutation was detected in both WES and TSO500 data, the remaining missense mutations were identified more frequently in TSO500 data.
For all three platforms (WES, TSO500, and F1CDx) (N = 26), there were two samples with discrepancies in EGFR mutation results [Supplemental Figure S3(B)] as alluded previously (P244,224).
TMB correlation according to EGFR mutation
For 96 samples analyzed using WES and TSO500, correlation analyses of tumors for WES versus TSO500 provided R2 values of 0.84 (CCC = 0.894) in EGFR-wild type tumors and 0.045 (CCC = 0.145) in EGFR-mutant tumors [Figure 5(a)]. The calculation of TMB did not correlate between different analytical methods in EGFR-mutant tumors.
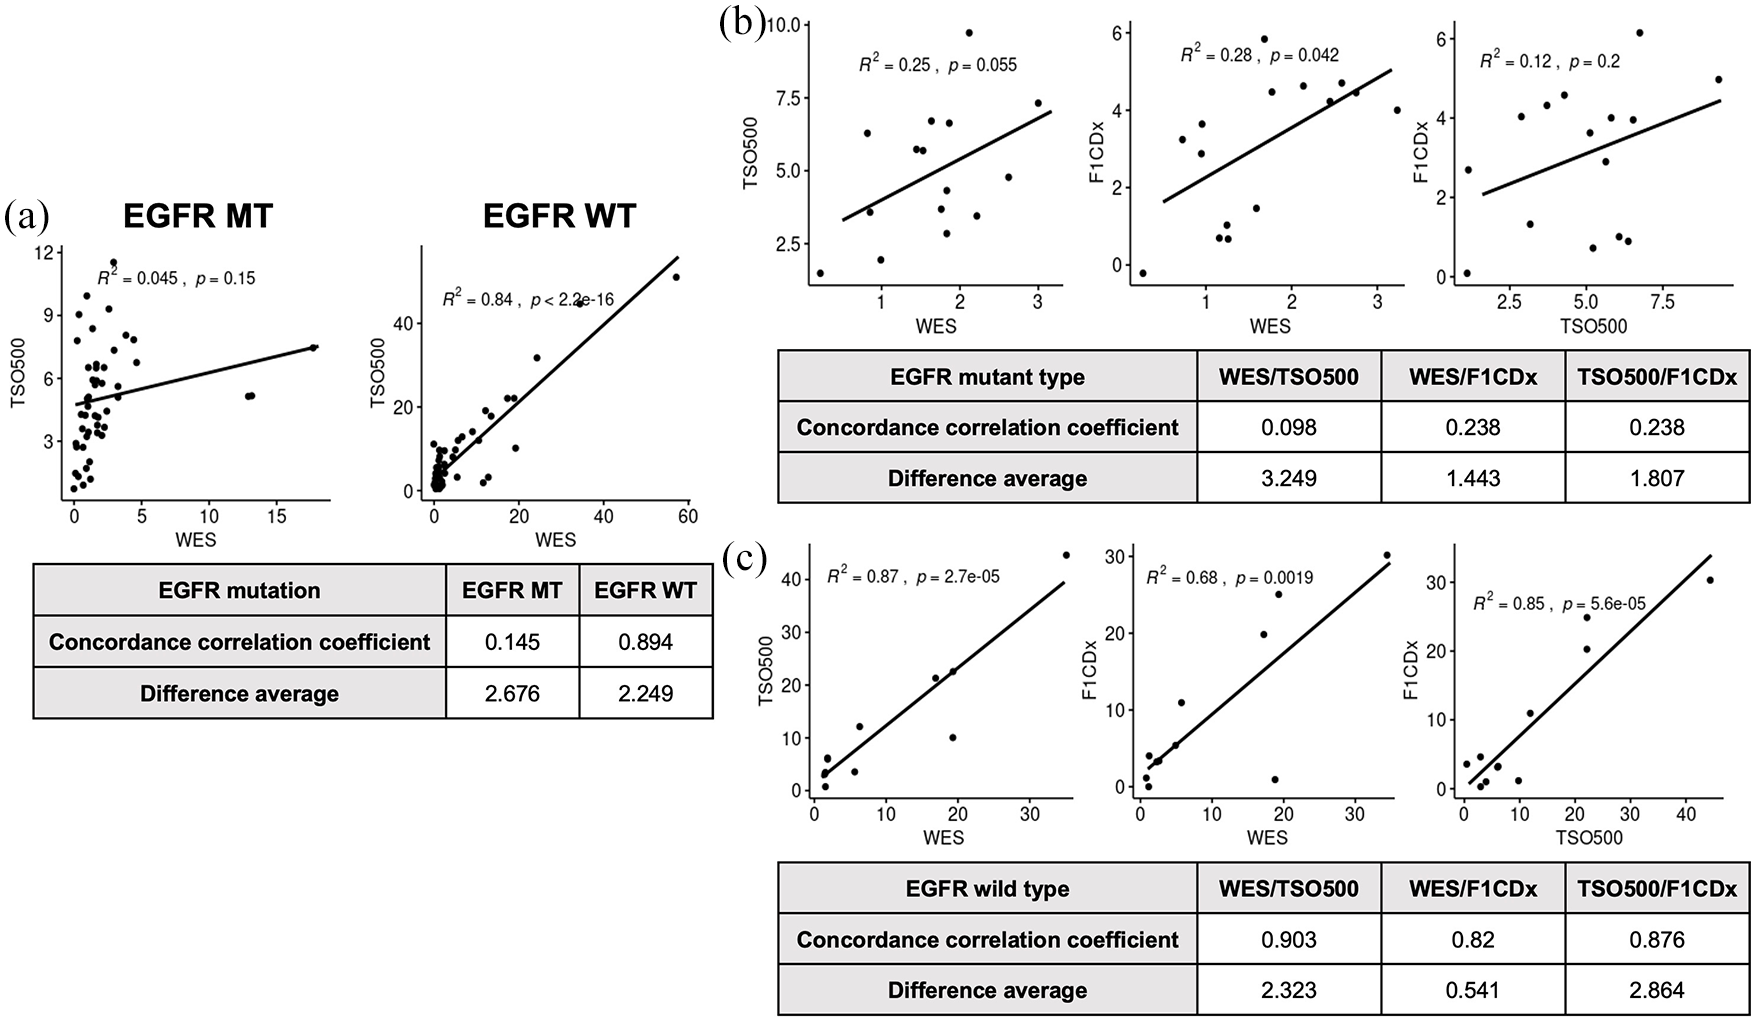
(a) TMB correlation according to EGFR mutation as depicted in correlation analyses of wild-type versus EGFR-mutant tumors for WES versus TSO500 (N = 96). (b) Correlation analyses of EGFR-mutant and (c) EGFR-wild tumors for WES, TSO500, and F1CDx data.
TMB correlation according to both EGFR mutation (N = 15) and EGFR wild (N = 11) was analyzed using WES, TSO500, and F1CDx [Figure 5(b) and (c)]. For EGFR-mutant tumors, correlation analyses provided the R2 values of 0.25 (CCC = 0.098, WES versus TSO500), 0.28 (CCC = 0.238, WES versus F1CDx), and 0.12 (CCC = 0.239, TSO500 versus F1CDx). For EGFR-wild type tumors, correlation analyses provided the R2 values of 0.87 (CCC = 0.903, WES versus TSO500), 0.68 (CCC = 0.82, WES versus F1CDx), and 0.85 (CCC = 0.876, TSO500 versus F1CDx).
Discussion
As the paradigm for the management of early-resected NSCLC continues to evolve, understanding TMB and identifying actionable mutations may help advance clinical outcomes for this subset of patients. Here, both TSO500 and F1CDx showed robust analytical performance for TMB assessment with TSO500 showing stronger concordance of TMB with high PD-L1 expression. Moreover, our data support early clinical utility for the management of early-resected NSCLC patients.
The clinical utility of TMB is supported by the work of Rizvi et al. The authors showed a good correlation between NGS and WES to estimate TMB and the combination of biomarkers, in this case, the combination of TMB and PD-L1 expression to more precisely predict ICIs efficacy in comparison with a single biomarker, TMB, or PD-L1 alone. 25 TMB has conceivable usefulness as a predictive biomarker for immunotherapy efficacy throughout different types of lung cancer. 26 Rizvi et al. 27 demonstrated that the selection of patients with higher TMB values was more accurate resulting in the greatest benefit from the selected therapy.
The determination of TMB may differ across platforms due to variations in performance, gene content, and horizontal coverage and therefore may result in different results leading to incorrect therapeutic choice. 28 Ramos-Paradas et al. 29 compared TMB assessment obtained from two marketed NGS panels TSO500 and Oncomine Tumor Mutation Load versus F1CDx in 96 resected early-stage NSCLC tumors. Both panels exhibited robust analytical performances for TMB assessment, with stronger concordances in patients with negative PD-L1. 29 The TSO500 assay is identical to the one used in this study, and was concluded by the authors to be more robust and reproducible. The authors suggest the TSO500 assay resulted in a lower number of artifacts because it is a hybrid capture panel and also uses UMI which avoids artifacts caused by errors in the polymerase and by incorrect interpretation of deamination. Finally, the pipeline analysis included an automatic algorithm that corrects cases of high deamination as per the manufacturer’s guidelines. 29 In our study, we demonstrated a similar conclusion in that TSO500 and F1CDx showed robust analytical performance for TMB assessment with TSO500 showing stronger concordance of TMB with high PD-L1 expression.
Currently, TMB is not widely used in either metastatic or resectable NSCLC since there are various cutoff points according to various trials/detection tools. 30 Ramos-Paradas et al. used four relevant cutoff values that are predictive in different clinical trials: 10 muts/Mb (Checkmate 227 31 ); 13 muts/Mb (Checkmate 026 32 ); and 16 and 20 muts/Mb (Mystic Trial 27 ). The Checkmate 227 trial is the only trial performed that had patients selected for a primary endpoint based on tumor TMB (⩾10/Mb). In a meta-analysis by Galvano et al., 33 a proven benefit in overall survival in favor of immune-oncology agents in the TMB-high population and monitoring TMB and existing PD-L1 expression level may present an option for first-line management of advanced NSCLC patients. Because PD-L1 and TMB have no concordance, PD-L1 remains an imperfect biomarker. Moreover, due to the current lack of standardization and the differences in methodology and various adjusted cutoffs, it is still unknown whether all therapy paths chosen are equally efficacious across the TMB spectrum in advanced-stage NSCLC patients.
The prognostic value of TMB is still inconclusive. In a recent article published by Wankhede et al., the authors evaluated retrospectively, in a cohort of 2520 early-stage NSCLC patients, the prognostic role of TMB. The report is the first meta-analysis report to pool effect estimates of OS and DFS in early-stage, resected NSCLC patients by TMB levels. In the East-Asian patients, high TMB was associated with shorter DFS but was not apparently associated with non-Asian patients. The authors suggest ethnicity, methods, and sample size are sources for the heterogeneity of DFS. 34 The widespread utilization of TMB assays for prognosis is yet to be determined but standardization and harmonization of TMB assays is a necessary step.
Our findings were based on early-resected NSCLC, including 80% of stage I and 20% of stage II. Currently, neoadjuvant chemoimmunotherapy or adjuvant immunotherapy is a treatment option for early resectable NSCLC regardless of PD-L1 expression or TMB. 35 The PEARLS/KEYNOTE-091 and IMpower010 studies are the pivotal phase III studies in adjuvant treatment for resected NSCLC.35,36 In the PEARLS/KEYNOTE-091 study, pembrolizumab, a PD-1 inhibitor, showed improvement in DFS for surgically resected stage IB–IIA NSCLC (as per the American Joint Committee on Cancer Staging System, AJCC, 7th edition), irrespective of PD-L1 expression. 37 However, there was an absence of clinical benefit of pembrolizumab for patients with PD-L1 TPS of ⩾50% or greater, and the placebo group outperformed in this subset. By contrast, atezolizumab, a PD-L1 inhibitor, showed improvement of DFS with PD-L1 1% or more of TCs with subgroup analysis showing greater magnitude at PD-L1 TC ⩾50% or more in the IMpower 010 study. 36 The discrepancy in the results may be attributed to the different assays used to determine PD-L1 expression and the difference in study design and population. As for neoadjuvant treatment, three cycles of nivolumab, a PD-1 inhibitor with platinum-based chemotherapy has been approved by the FDA on 4 March 2022 based on the improvement of event-free survival in PD-L1-unselected, stage IB–IIIA (N2) (AJCC 7th) in the CheckMate 816. 38
Our mutation landscape revealed EGFR mutation (50%) as the most common actionable driver mutation, comprising L858R, E19del, and other non-common EGFR mutations. CGP is not recommended in the early stages, 33 and data of TMB as well as co-mutations remain sparse. Currently, identifying EGFR mutation in early-resected NSCLC is paramount in guiding treatment options. 4 The ADAURA trial demonstrates a significant DFS as well as an overall survival benefit of adjuvant osimertinib in stage IB–IIIA NSCLC patients after surgical resection with or without standard adjuvant chemotherapy.18,19 However, there was no information on concurrent mutations such as TP53, which confers to a worse prognosis in metastatic EGFR-mutated NSCLC. 39 As the treatment paradigm shifts to include targeted therapies including EGFR TKI at earlier stages, identifying co-mutations may guide treatment options in the future.
Limitations to this study include retrospective data and limited sample size across three different platforms. Nonetheless, our study showed the TMB, PD-L1 expression, and genomic alterations, including both actionable and concurrent mutations in early, resected NSCLC.
Conclusion
Detection of emerging biomarkers has been historically assessed with WGS or WES. Here we show a good correlation between NGS, WES, and TSO500, which showed stronger concordance of TMB in patients with high PD-L1 expression. As clinical trials continually evolve to include early resectable NSCLC, identifying AGAs, co-mutations, PD-L1, and TMB via tissue CGP may broaden the horizon for treatment options.
Supplemental Material
sj-docx-1-tam-10.1177_17588359241240657 – Supplemental material for Analysis of tumor mutational burden and mutational landscape comparing whole-exome sequencing and comprehensive genomic profiling in patients with resectable early-stage non-small-cell lung cancer
Supplemental material, sj-docx-1-tam-10.1177_17588359241240657 for Analysis of tumor mutational burden and mutational landscape comparing whole-exome sequencing and comprehensive genomic profiling in patients with resectable early-stage non-small-cell lung cancer by Su-Jin Choi, Jii Bum Lee, Jae Hwan Kim, Min Hee Hong, Byoung Chul Cho and Sun Min Lim in Therapeutic Advances in Medical Oncology
Footnotes
References
Supplementary Material
Please find the following supplemental material available below.
For Open Access articles published under a Creative Commons License, all supplemental material carries the same license as the article it is associated with.
For non-Open Access articles published, all supplemental material carries a non-exclusive license, and permission requests for re-use of supplemental material or any part of supplemental material shall be sent directly to the copyright owner as specified in the copyright notice associated with the article.