
Abstract
Background:
Somatostatin receptor (SSTR) positron emission tomography (PET) is a cornerstone of neuroendocrine tumor (NET) management. Hybrid PET/magnetic resonance imaging (MRI) is now available for NET-imaging, next to PET/computed tomography (CT).
Objectives:
To determine whether CT or MRI is the best hybrid partner for [68Ga]Ga-DOTATATE PET.
Design:
Monocentric, prospective study.
Methods:
Patients received a same-day [68Ga]Ga-DOTATATE PET/CT and subsequent PET/MRI, for suspicion of NET, (re)staging or peptide receptor radionuclide therapy-selection. The union (PETunion) of malignant lesions detected on PETCT and PETMRI was the reference standard. Concordance of detection of malignant lesions in an organ was measured between PETunion and CT and PETunion and MRI. Seven bins were used to categorize the number of malignant lesions, containing following ordinal variables: 0, 1, 2–5, 6–10, 11–20, >20 countable and diffuse/uncountable. The difference in number of malignant lesions was obtained as the difference in bin level (‘Δbin’) between PETunion and CT and PETunion and MRI with a Δbin closer to zero implying a higher concordance rate.
Results:
Twenty-nine patients were included. Primary tumors included 17 gastroenteropancreatic-NETs, 1 colon neuroendocrine carcinoma, 7 lung-NETs and 2 meningiomas. Patient level concordance with PETunion was 96% for MRI and 67% for CT (p = 0.039). Organ level concordance with PETunion was 74% for MRI and 40% for CT (p < 0.0001). In bone, there was a higher concordance rate for MRI compared to CT, 92% and 33%, respectively (p = 0.016). Overall, a mean Δbin of 0.5 ± 1.1 for PETunion/MRI and 1.4 ± 1.2 for PETunion/CT (p < 0.0001) was noted. In liver, a mean Δbin of 0.0 ± 1.1 for PETunion/MRI and 1.7 ± 1.2 for PETunion/CT was observed (p = 0.0078). In bone, a mean Δbin closer to zero was observed for PETunion/MRI compared to PETunion/CT, 0.6 ± 1.4 and 2.0 ± 1.5, respectively (p = 0.0098).
Conclusions:
Compared to SSTR PET/CT, SSTR PET/MRI had a higher patient and organ level concordance for malignant tumoral involvement and number of malignant lesions, with a clear added value in bone and liver specifically.
Introduction
Somatostatin receptor (SSTR) positron emission tomography (PET) is a widely used imaging modality, specifically visualizing SSTR-expression. There are five subtypes of SSTRs in humans, 1 the most important subtype for theranostic applications being subtype 2. The SSTR is overexpressed in neuroendocrine neoplasms (NENs), which arise from neuroendocrine cells that are present in a range of organs. NENs consist of well-differentiated neuroendocrine tumors (NETs) and poorly differentiated neuroendocrine carcinomas (NECs). 2 Most frequently they arise from the gastrointestinal tract and pancreas (GEP-NENs), followed by the bronchi, unknown primary NET (CUP-NEN) and less frequent primary sites (thymus, breast, etc.).3,4 There are also other tumoral entities with high SSTR-overexpression in humans, for example meningiomas.
At present, SSTR PET with [68Ga]Ga-DOTA-SSA (somatostatin analog, [68Ga]Ga-DOTA-TOC, [68Ga]Ga-DOTA-NOC and [68Ga]Ga-DOTA-TATE) PET/computed tomography (CT) is the gold standard for staging and restaging in NETs, and for peptide receptor radionuclide therapy (PRRT)-selection in NETs and other SSTR-overexpressing tumor types such as meningiomas.2,5–8
Over the last decade, hybrid PET/magnetic resonance imaging (MRI) systems have emerged as a powerful modality for hybrid imaging. 9 PET/MRI scanners have several advantages compared to the current well-established PET/CT. 10 First, MRI has a high spatial resolution and soft-tissue contrast, which results in images with exquisite soft-tissue depiction. Second, various advanced MRI sequences result in the possibility to retrieve both anatomical and functional information on perfusion, diffusion, or metabolism from the images, contrary to CT scans which provide mainly anatomical information. Third, there is an absence of ionizing radiation in the MRI component which is important in the oncological setting when repeated whole-body examinations are required for therapeutic monitoring. Fourth, the simultaneous acquisition of PET and MRI leads to a reduced imaging time compared to stand-alone PET and stand-alone MRI. All these arguments are of great value in oncological patients, such as NET patients, who often have soft-tissue malignant lesions.
More specifically, in the area of gastroenteropancreatic (GEP)-NETs, which frequently metastasize to the liver, there are arguments for preferring PET/MRI over PET/CT. 11 Indeed, diffusion-weighted MRI (DW-MRI) and hepatobiliary phase imaging have shown to be more sensitive than standard MRI sequences and CT for the detection of liver metastases.12–14 Also, the utility of DW-MRI through apparent diffusion coefficient (ADC) values as an early response predictor for PRRT has been advocated. 15
However, the implementation of SSTR PET/MRI in routine clinic for NETs and PRRT-selection is currently hampered due to (i) heterogeneous literature about the choice of acquisition protocol for SSTR PET/MRI, (ii) lack of identification of NET-patients that would have a substantial added benefit of SSTR PET/MRI compared to SSTR PET/CT and (iii) ultimately lack of reimbursement for PET/MRI in several countries. 16
The primary aim of our study was to prospectively investigate whether CT or MRI with diffusion-weighted sequences, is the best hybrid partner for SSTR PET. The best hybrid partner was defined as the one with the highest concordance rate with PET, as double confirmation of lesions on two different imaging modalities strongly increases the likelihood that these lesions are malignant, avoiding the need for additional confirmation. Second, we investigated the influence of interval between injection and scan on [68Ga]Ga-DOTATATE uptake in malignant lesions and background regions, both semi-quantitatively and visually (Krenning score).
Material and methods
Patient selection
Patients were prospectively included when referred to our department for a [68Ga]Ga-DOTATATE PET/CT in the context of suspicion of an SSTR-expressing malignancy, staging and restaging of NEN or determination of eligibility for PRRT. Patients were excluded if they had contra-indications for MRI, were unable to lie still for at least 1 h or had claustrophobia. PET/MRI was performed immediately subsequent to the PET/CT, using the same tracer injection. Patients were retrospectively excluded if they were found to have a non-SSTR-expressing malignancy at follow-up (n = 1) or if insufficient data of the PET/MRI acquisition was available (n = 2). For grading of NETs as grade 1, grade 2 or grade 3 we relied on the classification method proposed in the 2022 WHO Classification of NENs. Specifically for lung NETs, when the mitotic count could not be retrieved from the patient’s medical file, ‘typical carcinoid’ was considered as grade 1 and atypical carcinoid as grade 2. 17 This prospective study was approved by the Ethics Committee Research UZ/KU Leuven (EC Research; study number S58764) and complied with the Declaration of Helsinki. Written informed consent of all patients was obtained.
[68Ga]Ga-DOTATATE synthesis
[68Ga]Ga-DOTATATE was synthesized using 30 µg of DOTATATE (ABX advanced biochemical compounds, Radeberg, Germany) per synthesis according to the previously described procedure for [68Ga]Ga-DOTATOC. 18
PET/CT acquisition
Whole-body PET/CT from mid-thigh to vertex was performed at a mean of 39 ± 7 min after intravenous administration of 142 ± 24 MBq [68Ga]Ga-DOTATATE. Patients were asked to avoid long-acting SSA treatment 4–6 weeks before the scan. Seven PET/CT scans were performed on a Biograph 16 slice Hi-Rez PET/CT scanner (Siemens, Erlangen, Bavaria, Germany) and 22 on a Biograph 40 TruePoint PET/CT scanner (Siemens, Erlangen, Bavaria, Germany). Image acquisition was initiated with a contrast-enhanced high-dose CT scan [unless an intravenous contrast agent was contra-indicated (n = 4) or if the patient had a recent diagnostic CT (n = 1)] with the following parameters: slice thickness of 2.0 and 5.0 mm, pitch 0.75, 120 kV, 85 mAs on Biograph 16 and slice thickness of 1.5 and 5.0 mm, pitch 0.8, 120 kV, 85 mAs on Biograph 40. For the one patient who underwent a low-dose CT, only 5.0 mm slices were reconstructed. No specific breathing protocol was used during acquisition of CT images (free-breathing CT).
After CT images had been acquired, a PET acquisition took place at 4–6 min per bed position (5–6 bed positions per patient), dependent on the injected activity and the weight of the patient. Biograph 16 PET images were iteratively reconstructed using an ordered subsets expectation maximization (OSEM) algorithm (five iterations, eight subsets) and a post-reconstruction Gaussian smoothing kernel of 6 mm full width at half maximum (FWHM). Biograph 40 PET images were iteratively reconstructed using a manufacturer provided 3D OSEM algorithm with detector response modelling (3 iterations, 21 subsets) and a post-reconstruction Gaussian smoothing kernel of 4 mm FWHM. Reconstructed PET images from both PET/CT scanners were corrected for decay, scatter and attenuation.
PET/MRI acquisition
A whole-body PET/MRI from mid-thigh to vertex was performed, using a SIGNA 3T 5-ring TOF (time-of-flight) PET/MRI scanner (GE Healthcare, Milwaukee, WI, USA). Subject positioning and acquisition protocol were started as soon as possible after their PET/CT scan, at a mean of 67 ± 17 min after the start of acquisition of the PET/CT and at a mean of 105 ± 17 min after tracer injection. The PET/MRI acquisition consisted of a TOF PET scan of 5 min per bed position (5–6 bed positions per patient) with simultaneous recordings of axial DW-MRI images, followed by T1- and T2-weighted imaging. Detailed acquisition parameters of the MRI sequences (DWI, T1 and T2) can be found in Supplemental Information (see also Jentjens et al. 19 ).
PET data were reconstructed using iterative reconstruction MLEM (maximum likelihood estimation method) TOF methods, using 3 iterations, 28 subsets and Gaussian post-reconstruction smoothing kernel of 5 mm FWHM. Reconstructed PET images were corrected for decay, scatter and attenuation. Detailed description of the MRI-based attenuation correction can be found in Supplemental Information.
Visual image analysis
PETCT, PETMRI, CT and MRI were analysed using a dedicated software platform for multimodal image analysis (MIM version 7.1.5; MIM Software Inc., Cleveland, OH, USA).
Per patient a total of 21 organs (brain, heart, lung, pleura, esophagus, stomach, small intestine, colon, anorectum, peritoneum/mesenterium/omentum, pancreas, kidney, liver, spleen, adrenal gland, bone, muscle, breast, supradiaphragmatic lymph nodes, infradiaphragmatic lymph nodes and other) were evaluated for the presence and number of lesions. In addition, we retrospectively combined the lymph node stations to the organ ‘all lymph nodes’ by combining the organs ‘supradiaphragmatic lymph nodes’ with ‘infradiaphragmatic lymph nodes’.
For PET analysis, lesions were considered as any [68Ga]Ga-DOTATATE uptake above location-specific background levels and were classified on a five-point Likert scale: 1 = benign, 2 = most likely benign, 3 = equivocal, 4 = most likely malignant, 5 = malignant. Seven bins were used to categorize the number of lesions per organ, containing the following ordinal variables: ‘0’, ‘1’, ‘2–5’, ‘6–10’, ‘11–20’, ‘>20, countable’ and ‘diffuse/uncountable’. Confluent lesions were considered as diffuse/uncountable.
Visual analysis of the PET images was performed by two nuclear medicine physicians [board-certified nuclear medicine physician with 6 years of experience (NAB) and a nuclear medicine physician in training with 4 years of experience (GL)], independently from each other and blinded to clinical information. The corresponding CT was available for anatomical correlation when scoring PETCT and the corresponding MRI was available for anatomical correlation when scoring PETMRI. Results from both readers were compared and when there was discrepancy in the scoring of the organs, an attempt was made to obtain consensus between the two readers by joint assessment of the images. If no consensus could be obtained, a third nuclear medicine physician [board-certified nuclear medicine physician with more than 15 years of experience with SSTR PET (CMD)] was consulted to make the final decision. PETCT scans were scored first, followed by PETMRI scan scoring a minimum of 2 months later to avoid recall bias. For further analyses, PETunion was defined as the union of the result of the PETCT and the PETMRI.
CT scans were scored by a board-certified radiologist with 6 years of experience (SG), blinded to the PET images and clinical data to prevent bias, using the aforementioned Likert scores and bin categories. MRI scans were scored by a board-certified radiologist with more than 15 years of experience (VV), blinded to the PET images and clinical data to prevent bias, using the aforementioned Likert scores and bin categories. The DWI sequences, complemented by the T1- and T2-weighted sequences wherever needed, were used for visual analysis.
For the statistical analyses, the five-point Likert scale was simplified as follows: benign (Likert 1 and 2), equivocal (Likert 3) and malignant (Likert 4 and 5).
Tracer uptake image analysis
The spatial resolution of the Biograph 16 PETCT, Biograph 40 PETCT and Signa PETMRI were homogenized due to the fact that spatial resolution significantly affects standardized uptake values (SUV). Biograph 16 PETCT has the lowest resolution, therefore the homogenization was executed by applying a Gaussian post filter of 6.2 mm to Biograph 40 PETCT and 6.7 mm to Signa PETMRI to match the Biograph 16 PETCT resolution.
We delineated malignant lesions present in PETunion. Delineation was done separately for PETCT and PETMRI using the PET Edge® tool in MIM version 7.1.5 (MIM Software Inc., Cleveland, OH, USA). Per affected organ, a maximum of two lesions with the highest SUVmax on PETCT were delineated, afterwards the corresponding malignant lesions on PETMRI were found and delineated. Confluent and infracentimetric lesions (underestimation of the SUV due to partial volume effect) were excluded for delineation. Further, five background regions (‘bloodpool’ via descending thoracic aorta, ‘lumbar spine’ via bone with preference for L4, ‘liver’, ‘spleen’ and ‘muscle’ via the gluteus maximus muscle) were delineated with the 3D Brush tool or the Circular Contour tool in MIM version 7.1.5, separately on the PETCT and PETMRI images. In detail, bloodpool was drawn by a circular 1 cm region-of-interest (ROI) on 10 consecutive slices, lumbar spine by a circular 2 cm ROI on three consecutive slices, liver by a 3 cm sphere, spleen by a 1.5 cm sphere and muscle by a circular 2 cm ROI on five consecutive slices. Tumor-to-background ratios (TBRs) were calculated by dividing the SUVmax of a lesion by the SUVmean of the relevant background region (liver for liver lesions, bone for bone lesions, spleen for spleen lesions, muscle for muscle lesions and muscle for all other lesions). 20 In patients for whom no healthy liver (n = 2) or bone tissue (n = 2) could be delineated, the mean background value of all the other patients was used instead to determine TBRs. 21
Moreover, a Krenning score modified for SSTR PET 22 was determined separately for each patient on PETCT and PETMRI. The Krenning score was based on a visual evaluation of the degree of tracer uptake of the most dominant component of the disease relative to the physiological tracer uptake in the liver and spleen. In two patients with an absent spleen, the Krenning 4 score was determined as the dominant component of the disease having a higher degree of tracer uptake compared to the organ with highest SSTR-expression in that patient (excretion organs such as kidneys were not included).
Statistical analysis
Statistical analyses were performed using SAS software version 9.4 of the SAS System for Windows (SAS, Cary, NC, USA). Data visualization was performed using GraphPad Prism version 9.5.0 for Windows (GraphPad Software, San Diego, CA, USA). In all statistical analyses, PETunion was considered the reference standard to determine concordance. As such, analyses were performed on all PETunion cases positive for malignancy.
The qualitative patient level concordance between PETunion and the hybrid partner (CT or MRI) was compared using the McNemar test.
The qualitative organ level concordance between PETunion and the hybrid partner (CT or MRI), was determined as a binary variable and presented as frequencies and percentages. A log-binomial regression model was used, with estimation based on generalized estimating equations to account for clustering of organs within a patient. The qualitative organ level concordance was repeated per organ, for the organs with observations in 10 patients or more and additionally for the lung. The statistical comparison was performed using the McNemar test.
The quantitative organ level concordance between PETunion and the hybrid partner (CT or MRI), was determined as a numerical variable delta bin (Δbin), obtained as the difference between the bin level of PETunion and the hybrid partner (CT or MRI). A positive value indicates that the hybrid partner reported a lower number of lesions compared to PETunion, a negative value indicating the opposite. A linear mixed model was used, modelling random effects to account for clustering of organs within patients. In addition, the quantitative organ level concordance was repeated per organ, for the organs with observations in nine patients or more and additionally for the lung. The statistical comparison was performed using the Wilcoxon signed rank test. Additionally, we performed the quantitative organ level concordance analyses by considering the bins ‘>20, countable’ and ‘diffuse/uncountable’ as one bin ‘>20, countable or diffuse/uncountable’. However, this additional analysis resulted in no significant difference compared to the initial quantitative organ level analyses, therefore these results are not shown in this manuscript.
We also performed three subgroup analyses for qualitative and quantitative organ level concordance: (i) after excluding the five patients who underwent a suboptimal CT [low-dose CT (n = 1) or high-dose CT without intravenous contrast (n = 4)], (ii) after excluding the two patients with meningioma and (iii) after excluding both the five patients undergoing a suboptimal CT (n = 5) and the two patients with meningioma (n = 2).
It must also be noted that in the quantitative organ level concordance analyses, the result of one patient accounting for six organs, was censored due to fact that malignant lesions in this patient could not be properly counted on PETunion, caused by the combination of a low SSTR-expressing tumor and confluent lesions on PETunion. In total, we defined two patients with low SSTR-expressing tumors as having a mean SUVmax <5 at the patient level (excluding small lesions that get influenced by partial volume effect), determined on both PETCT and PETMRI.
The comparison of the lesion and patient level tracer uptake of malignant lesions was performed by calculated SUVmax and TBR for PETCT and PETMRI. For the lesion level comparison, a linear mixed model was used, modelling random effects to account for data clustering within patients. The difference between PETCT and PETMRI was modelled as the response variable and the fixed effects part of the model only contained an intercept as an estimate of the mean difference between PETCT and PETMRI. For the patient level comparison, we calculated one mean value of SUVmax and TBR by calculating the mean of all delineated malignant lesions per patient, and a two-tailed paired t-test was performed and a Pearson correlation coefficient was estimated. The comparison of the patient level tracer uptake of background regions was performed by calculating SUVmean for PETCT and PETMRI. A two-tailed paired t-test was performed and a Pearson correlation coefficient was estimated.
Only descriptive statistics are available for the comparison of the Krenning score between PETCT and PETMRI, given that the Krenning scores in our sample were identical on PETCT and PETMRI. As such, no statistical test was performed.
Overall, results are reported with a 95% confidence interval (CI) and a p-value of <0.05 was considered statistically significant.
Results
Patient characteristics and scan details
Patient characteristics and scan details are given in Table 1. Twenty-nine patients with a median age of 62 years, were prospectively included in this study. [68Ga]Ga-DOTATATE PET was performed for following clinical indications: 3 suspicion of NET, 7 staging of NET, 15 restaging of NET, 1 restaging of NEC and 3 PRRT-selection. The primary SSTR-expressing tumor included nine small-intestine NETs, six pancreatic NETs, two colon NETs, one colon NEC, seven lung NETs, two meningiomas and in two patients no SSTR-expressing tumor was found. Tumor grade comprised 13 grade 1 and 9 grade 2 NETs, 1 NEC and in 2 patients the tumor grade was unavailable.
Patient and scan characteristics.

IQR, interquartile range; MBq, megaBequerel; min, minutes; MRI, magnetic resonance imaging; NEC, neuroendocrine carcinoma; NEN, neuroendocrine neoplasm; NET, neuroendocrine tumor; PET: positron emission tomography; PRRT, peptide receptor radionuclide therapy; SD, standard deviation; SSTR, somatostatin receptor.
Tumor grade could not be deducted from the medical history and the result of pathologic examination was not available.
In 28 patients, a high-dose CT scan was performed as part of the hybrid PET/CT scan, and in 24 patients, a contrast agent was administered intravenously. Intravenous administration of a contrast agent was withheld in four patients due to contrast allergy. One patient received a low-dose CT without administration of intravenous contrast agent, as per protocol. The mean effective dose (ED) for the PET part of the examination was 3.27 ± 0.54 mSv. The estimated mean ED for a high-dose CT (n = 28) in our population was 6.50 ± 1.25 mSv. Thus, the contribution of the high-dose CT to the total dose of the SSTR PET/CT examination in our study is 67%.
Lesion detection
Qualitative patient level concordance
Twenty-four patients (83%) had malignant tumoral involvement on PETunion. Concordance of CT and MRI with PETunion on a patient level was 96% for MRI and 67% for CT (p = 0.039).
Qualitative organ level concordance
A total of 72 organs with malignant tumoral involvement were observed in the 24 patients with malignant tumoral involvement on PETunion. Organs with malignant tumoral involvement on PETunion in at least 10 patients included bone, liver, infradiaphragmatic lymph nodes and supradiaphragmatic lymph nodes (Figure 1). Of the 72 organs with malignant tumoral involvement on PETunion, (i) CT observed malignant lesions in 29 organs, equivocal lesions in 6 organs, benign lesions in 3 organs and 34 organs with no abnormality; (ii) MRI observed malignant lesions in 53 organs and 19 organs with no abnormality (Figure 2). As such, organ level concordance with PETunion was 74% and 40% for MRI and CT, respectively (p < 0.0001, Table 2). In bone, there was a higher organ level concordance for MRI compared to CT [92% and 33%, respectively (p = 0.016)]. No statistically significant difference in organ level concordance between CT and MRI was observed for the organs lung, liver, supradiaphragmatic lymph nodes, infradiaphragmatic lymph nodes and all lymph nodes.

Qualitative organ level concordance.

Hybrid image correlate of organs with malignant tumoral involvement on PETunion.
Qualitative organ level concordance between malignant tumoral involvement on PETunion and CT or MRI.

p-Values in bold are statistically significant.
ID, infradiaphragmatic; MRI, magnetic resonance imaging; N, number of malignant organs on PETunion; n, number of the concordant malignant organs on CT or MRI; PET, positron emission tomography; SD, supradiaphragmatic.
Quantitative organ level concordance
Table 3 and Figure 3 show the difference in score of number of malignant lesions per organ (i.e. Δbin) to determine the quantitative organ level concordance between number of malignant lesions on PETunion and on CT or MRI. In total, a mean Δbin closer to zero was observed for PETunion/MRI compared to PETunion/CT [0.5 ± 1.1 and 1.4 ± 1.2 respectively (p < 0.0001)]. In liver, a mean Δbin of 0.0 ± 1.1 for PETunion/MRI and 1.7 ± 1.2 for PETunion/CT was observed (p = 0.0078). In bone, a mean Δbin of 0.6 ± 1.4 for PETunion/MRI and 2.0 ± 1.5 for PETunion/CT was noted (p = 0.0098). No statistically significant difference in bin score between PETunion/MRI and PETunion/CT was observed for lung, supradiaphragmatic lymph nodes or infradiaphragmatic lymph nodes. When comparing Δbin for all lymph nodes, a mean Δbin of 0.6 ± 1.2 for PETunion/MRI and 1.3 ± 1.1 PETunion/CT was noted (p = 0.063).
Difference in score of number of malignant lesions per organ (Δbin) as a measure of quantitative organ level concordance between number of malignant lesions on PETunion and on CT or MRI.

p-Values in bold are statistically significant. One of the 24 patients with malignant tumoral involvement on PETunion was excluded from the analyses (cfr. material and methods for more detail).
Δbin, bin level of PETunion minus bin level of CT or MRI; IQR, interquartile range; N, number of involved organs included in the analyses; PET, positron emission tomography; SD, standard deviation.

Quantitative organ level concordance.
Subgroup analyses of the qualitative and quantitative organ level concordance
All five patients who were excluded because of a suboptimal CT protocol [low-dose CT (n = 1) or high-dose CT without intravenous contrast (n = 4)] had organs with malignant tumoral involvement on PETunion (Supplemental Tables 1 and 2). A total of 49 organs with malignant tumoral involvement on PETunion were observed in 19 patients. CT detected malignant tumoral involvement in 21 of the 49 organs positive on PETunion, whereas MRI detected malignant tumoral involvement in 36 of the 49 organs positive on PETunion. This resulted only in a slightly higher organ level concordance with PETunion for CT compared to the main analysis (43% versus 40%, respectively). In the qualitative per organ analysis bone remains the only organ in which concordance with PETunion for detection of malignant organ involvement is significantly higher with MRI than with CT (100% versus 25% respectively, p = 0.031). However, in the subanalysis of the quantitative organ level concordance, the difference in bin score between PETunion/MRI and PETunion/CT was no longer significant in bone (mean Δbin of 0.9 ± 1.7 versus 2.0 ± 1.8 respectively, p = 0.078), whereas in liver this difference remained statistically significant (mean Δbin of 0.0 ± 1.3 versus 1.8 ± 1.2 respectively, p = 0.031). Subgroup analysis after excluding the two patients with meningioma showed similar results as the main analysis (Supplemental Tables 3 and 4). Results of the subgroup analysis after excluding the five patients with suboptimal CT and the two patients with meningioma, were in line with the results of the first subgroup analysis (after excluding five patients with suboptimal CT, Supplemental Tables 5 and 6).
Qualitative organ level mismatch: PET negative and CT or MRI positive
Supplemental Table 7 gives an overview of match/mismatch malignant tumoral-involved organs stratified by modality and organ. Twenty-three organs in 15 patients were scored positive for malignancy by MRI and negative for malignancy by PETunion. The 15 patients included the 5 patients who had no malignancy on PETunion and 2 patients who had low SSTR-expressing tumors.
Eight organs of seven patients were scored positive for malignancy by CT and negative for malignancy by PETunion. These seven patients included one of the five patients who had no malignancy on PETunion and none of the two patients with low SSTR-expressing tumors.
Lesion and background tracer uptake
In total, 111 malignant lesions in 24 patients were analysed via semi-quantification (Table 4, Figure 4). At the lesion level, both SUVmax and TBR were significantly higher on PETMRI compared to PETCT [mean difference 1.64 (95% CI 0.51–2.77), p = 0.0063 and 8.24 (95% CI 3.43–13.0), p = 0.0017, respectively]. The mean SUVmax in the tumor at the patient level was significantly higher on PETMRI compared to PETCT, 19.8 ± 17.4 versus 18.4 ± 17.3, respectively (p = 0.027). Further, the mean TBR at the patient level was significantly higher on PETMRI compared to PETCT, 30.9 ± 29.9 versus 24.1 ± 25.9, respectively (p = 0.0047). Background regions with low tracer uptake (i.e. bloodpool, lumbar spine and muscle), showed a significantly lower SUVmean on PETMRI compared to PETCT. For the background regions with high tracer uptake (i.e. liver and spleen, due to physiological SSTR-expression), a significantly higher uptake was seen for spleen on PETMRI compared to PETCT (29.2 ± 11.1 versus 27.0 ± 10.3, respectively, p = 0.0003). However, no significant difference in tracer uptake could be seen for liver between PETMRI and PETCT (7.22 ± 2.35 versus 7.33 ± 2.46, respectively, p = 0.50).
Mean SUV on patient level in malignant tumoral lesions (SUVmax) and background regions (SUVmean) on PETCT and PETMRI.

p-Values in bold are statistically significant.
SD, standard deviation; TBR, tumor-to-background ratio.
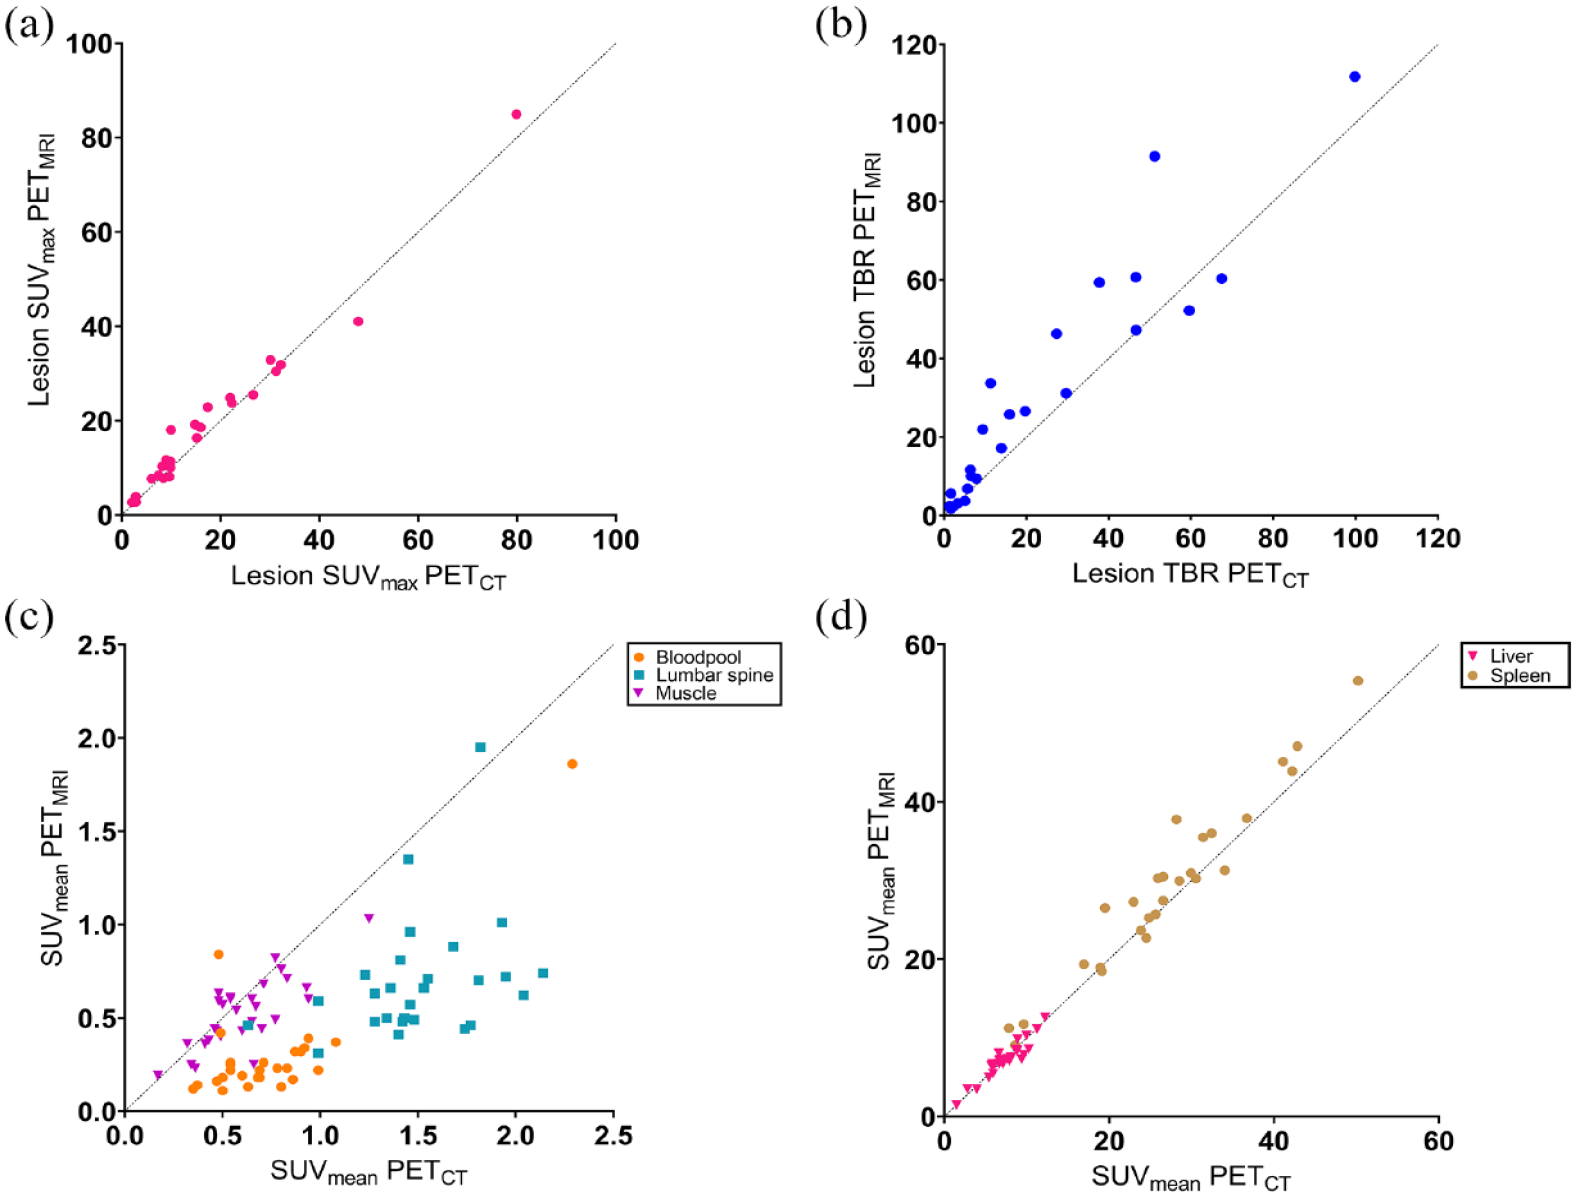
Scatter plot of tracer uptake on PETCT and PETMRI. (a) Relationship between mean SUVmax of malignant tumoral lesions on PETMRI and PETCT, on a patient level. (b) Relationship between mean TBR of malignant tumoral lesions between PETMRI and PETCT, on a patient level. (c) Relationship between SUVmean of background regions bloodpool, lumbar spine and muscle between PETMRI and PETCT. (d) Relationship between SUVmean of background regions liver and spleen between PETMRI and PETCT.
Krenning score
The Krenning score was identical on PETCT and PETMRI in all 29 patients: score 0 in 5 patients, score 1 in 2 patients, score 2 in 4 patients, score 3 in 8 patients and score 4 in 10 patients.
Discussion
SSTR PET is a cornerstone of modern NET management and is used for staging, restaging and PRRT-selection. Over the last decade SSTR PET/MRI has become available for hybrid imaging of SSTR-expressing tumors, next to the well-established SSTR PET/CT. In our study, we aimed to determine whether CT or MRI with DWI is the best hybrid partner for [68Ga]Ga-DOTATATE PET. The best hybrid partner was defined as the one with the highest concordance rate with PET, as double confirmation of lesions on two different imaging modalities strongly increases the likelihood that these lesions are malignant, avoiding the need for additional confirmation. In addition, we investigated the influence of interval between injection and scan on [68Ga]Ga-DOTATATE uptake in malignant lesions and background regions.
Most publications comparing SSTR PET/CT with SSTR PET/MRI are performed by a same-day tracer injection with PET/CT preceding PET/MRI. 16 In our study, we defined PETunion as the union of malignant lesions on PETCT and PETMRI, and used it as the reference standard for CT and MRI. There is a twofold reasoning for using PETunion as the reference standard instead of PETCT and PETMRI separately. First, we wanted to investigate if CT or MRI was the best hybrid partner for PET, independent of differences (i) in PET-scanners and (ii) interval between injection-start PET acquisition. Current guidelines state that the uptake time for [68Ga]Ga-DOTATATE is 40–90 min. 23 In our study the interval between injection and start of acquisition of PETCT and PETMRI, was 39 ± 7 and 105 ± 17 min, respectively. Second, our study revealed that, both SUVmax and TBR were significantly higher on PETMRI compared to PETCT. Based on these results, it could be hypothesized that PETMRI, acquired at a later time point, could reveal more malignant lesions compared to PETCT given the higher SUVmax and TBR. However, the interval between PETCT and PETMRI acquisition was 67 ± 17 min, which is almost one half-life of gallium-68 (half-life = 68 min). Therefore, the PET/MRI images could have more image noise, making it more difficult to distinguish lesions. Using PETunion neutralizes any bias in lesion detection from one camera over the other.
In our study, concordance with PETunion was significantly higher for MRI compared to CT, quantitatively for liver and both quantitatively and qualitatively for bone. These findings are in line with other studies in which a benefit of hybrid SSTR PET/MRI compared to SSTR PET/CT is shown, specifically for bone and liver lesions. 24 Liver metastases of NETs can show hypervascularity on arterial phase imaging, which is the reason why, usually in stand-alone setting, a dynamic CT or MRI is performed in this patient population by acquiring images in multiple phases after intravenous administration of a contrast agent. This may aid in identification of NET-lesions based on the differences in enhancement between the various phases.25,26 In our study, CT was acquired only in the portovenous phase after the intravenous administration of contrast, which is the standard clinical practice in our centre. However this could lead to a reduced sensitivity on CT. In addition, also no contrast was administered during the acquisition of the MRI-sequences.
In the liver, we found a mean Δbin closer to zero for PETunion/MRI compared to PETunion/CT (0.0 ± 1.1 versus 1.7 ± 1.2, respectively, p = 0.0078). In two patients MRI detected a higher number of liver metastases compared to PETunion. We hypothesize that the significant difference in favor of PETunion/MRI, is ultimately caused by the DWI. It is known that DWI may visualize small sub-centimetre liver lesions below the detection limits of [68Ga]Ga-DOTATATE PET, which is also caused by the relatively high physiological liver uptake. Other tracers such as SSTR antagonists or [ 18 F]AlF-NOTA-octreotide detect more liver lesions when compared to SSTR agonists labelled with gallium-68.20,27,28 This shows the strength of DW-MRI in this patient population. In addition, a recent meta-analysis by Choi et al., 24 revealed a higher pooled detection rate of SSTR PET/MRI for liver metastasis than SSTR PET/CT (93.5% versus 76.8%) and a 15.3% added value of SSTR PET/MRI for detecting liver metastasis in comparison with PET/CT. Remarkably, MRI does not underperform compared to CT in terms of detection of malignant lung lesions. This could be explained by the higher sensitivity of MRI for the detection of malignant versus benign lung lesions, due to inherent differences in tissue contrast based on T2 relaxation that cause CNR values (carrier-to-noise ratio) in T2-based MR sequences to be significantly higher for malignant than for benign lesions. In addition, DWI MRI via qualitative and quantitative parameters (such as ADC) can help in the detection and differentiation of lung lesions.29,30
Five patients in our study did not undergo a high-dose CT with intravenous contrast as part of the PET/CT protocol [low-dose CT (n = 1) or high-dose CT without intravenous contrast (n = 4)]. Inclusion of these patients could penalize CT as a hybrid partner for PETunion. Therefore a subanalysis of the qualitative and quantitative organ level concordance between PETunion and CT or MRI was performed after excluding these five patients. Results were in line with the results of the primary analysis, with the exception that MRI lost its statistically significant advantage over CT for the quantitative concordance with PETunion in bone. Presumably this can be explained by the loss of statistical power due to lower event numbers. Indeed, we do not expect that adding intravenous contrast to a CT protocol increases the accuracy of CT in detecting malignant bone lesions.
Given the difficulty to define a gold standard for imaging studies, we designated the best hybrid partner for [68Ga]Ga-DOTATATE PET as the one with the highest concordance rate of PETunion findings. However, it is well-known that high-grade NETs or NECs have lower SSTR-expression. In these specific cases, the best hybrid partner would also be the one that can complement the PET imaging by detecting malignant lesions with low SSTR-expression. Two patients in our study had a low SSTR-expressing tumor defined by a mean SUVmax of <5 on PETCT and PETMRI on a patient level. The MRI in these two patients identified six additional organs positive for malignancy that were negative for malignancy on PETunion. On the contrary, CT did not identify any additional organs as malignant. This reinforces the strength of MRI as a hybrid partner for SSTR PET in patients with low SSTR-expressing tumors. In addition, other factors are important in determining the best hybrid partner, such as economical (purchase cost and reimbursement), technical and logistical factors, as well as patient comfort. These factors were not examined in our study.
Both at the lesion and patient level, we found a significantly higher SUVmax and TBR on PETMRI compared to PETCT. Given the fact that we homogenized the PET data of PETMRI and PETCT for the comparison of [68Ga]Ga-DOTATATE uptake, these results are most likely caused by PETMRI being performed at a later time point compared to PETCT (interval tracer injection-start acquisition: 39 ± 7 min for PETCT and 105 ± 17 min PETMRI). Indeed, it is inherent to the [68Ga]Ga-DOTATATE tracer due to its mechanism of action being binding to the SSTR at the membrane of cells with subsequent internalization. Further, comparison of background regions without physiological SSTR-expression, that is, bloodpool, lumbar spine and muscle, revealed a significantly lower SUVmean on PETMRI. The uptake determined at bloodpool, lumbar spine and muscle is caused by tracer activity in the systemic circulation, which is lower at later time points due to sequestering of SSTR-bound tracer and excreted tracer. Moreover, we also investigated background regions with high physiological SSTR-expression, that is, liver and spleen. The tracer uptake between PETCT and PETMRI was not significantly different for liver, but to the contrary it was significantly higher for spleen in favor of PETMRI. Our results for the background regions lumbar spine, liver and spleen are in line with Sandström et al., 31 who investigated the biodistribution of [68Ga]Ga-DOTATATE in terms of SUV in 10 NET-patients, performed at multiple time points post-injection (45 min dynamic and 3 whole-body PET/CT scans at 1, 2 and 3 h).
In addition, we performed a comparison of the Krenning score on PETCT and PETMRI and found that the Krenning score was identical in all 29 patients on both scans. This means that in our patient sample, there is no influence of time on the Krenning score. Our results are in line with Menon et al., 32 who investigated 32 metastasized NET-patients receiving a [68Ga]Ga-DOTATATE PET/CT at 1–1.5 h (early) and 2.5–3 h (delayed) post-injection and who also did not find a difference in Krenning score between the early and the delayed timepoint.
Our study has some limitations. First, we used PETunion as a reference standard, without histological validation or systematic long-term clinical follow-up. Therefore, it is possible that lesions were false positive on PETunion. However, we believe that the number of false-positive lesions on PETunion is limited due to the fact that both PETCT and PETMRI were read out separately by two nuclear medicine physicians with knowledge of the most common pitfalls in SSTR PET imaging. 33 Second, our patient cohort is heterogeneous given the type of primary tumor and grade of NET, in that way representing a typical patient cohort that would be evaluated during clinical routine practice. Third, over time, MRI sequences, whole-body attenuation correction methods and processing on the GE Signa MRI have improved. For the latter, in the currently used version, intensity differences in DWI images on the different slabs make evaluation of whole-body DWI images more cumbersome. 19 Fourth, we did not perform region-specific MRI sequences or dynamic CT or MRI acquisitions.
Conclusion
Compared to SSTR PET/CT, SSTR PET/MRI with DWI had a higher patient and organ level concordance for malignant tumoral involvement and number of malignant lesions, with a clear added value in bone and liver specifically.
Supplemental Material
sj-docx-1-tam-10.1177_17588359231189133 – Supplemental material for Intra-individual qualitative and quantitative comparison of [68Ga]Ga-DOTATATE PET/CT and PET/MRI
Supplemental material, sj-docx-1-tam-10.1177_17588359231189133 for Intra-individual qualitative and quantitative comparison of [68Ga]Ga-DOTATATE PET/CT and PET/MRI by Géraldine Lens, Niloefar Ahmadi Bidakhvidi, Vincent Vandecaveye, Steven Grauwels, Annouschka Laenen, Wies Deckers, Ronald Peeters, Raphaëla C. Dresen, Jeroen Dekervel, Chris Verslype, Kristiaan Nackaerts, Paul M. Clement, Eric Van Cutsem, Michel Koole, Karolien Goffin, Koen Van Laere and Christophe M. Deroose in Therapeutic Advances in Medical Oncology
Footnotes
Acknowledgements
The authors are grateful to the study participants, and to Kwinten Porters, Jef Van Loock, Stefan Ghysels, Kris Byloos and Guido Putzeys for their contribution to the scanning and data handling. CMD is a senior clinical investigator at the Research Foundation-Flanders (FWO). NAB is a PhD fellow at the Research Foundation-Flanders (FWO), project number 1SB8923N.
Declarations
Supplemental material
Supplemental material for this article is available online.
References
Supplementary Material
Please find the following supplemental material available below.
For Open Access articles published under a Creative Commons License, all supplemental material carries the same license as the article it is associated with.
For non-Open Access articles published, all supplemental material carries a non-exclusive license, and permission requests for re-use of supplemental material or any part of supplemental material shall be sent directly to the copyright owner as specified in the copyright notice associated with the article.