
Abstract
Background:
Only a fraction of patients with esophageal squamous cell carcinoma (ESCC) show tumor responses to anti-programmed cell death protein 1 (PD-1) therapy. The predictive value of single biomarkers for prognosis is limited, and a more comprehensive approach that incorporates multiple factors may improve the prognostic prediction. Here, we conducted a retrospective study to develop a combined immune prognostic index (CIPI) for predicting clinical outcomes of ESCC patients treated with anti-PD-1 therapy.
Design and methods:
We performed a pooled analysis of two multicenter clinical trials comparing immunotherapy versus chemotherapy as second-line treatment in ESCC patients. The discovery cohort comprised patients who received anti-PD-1 inhibitors (N = 322) and the control cohort comprised patients who received chemotherapy (N = 307). The validation cohort included patients with pan-cancers treated with PD-1/programmed cell death ligand-1 inhibitors, except for ESCC (N = 110). Multivariable Cox proportional hazard regression was used to assess the prediction value of variables on survival.
Results:
In the discovery cohort, neutrophil-to-lymphocyte ratio, serum albumin, and liver metastasis were independently associated with overall survival (OS) and progression-free survival (PFS). We integrated the three variables into CIPI and found that CIPI could categorize patients into four subgroups (CIPI 0 to CIPI 3) with distinct OS, PFS, and tumor responses. The CIPI was also predictive of clinical outcomes in the validation cohort, but not in the control cohort. Furthermore, patients with CIPI 0, CIPI 1, and CIPI 2 were more likely to benefit from anti-PD-1 monotherapy than chemotherapy, while patients with CIPI 3 did not benefit from anti-PD-1 monotherapy over chemotherapy.
Conclusions:
The CIPI score was a robust biomarker for prognostic prediction in ESCC patients treated with anti-PD-1 therapy and was immunotherapy specific. The CIPI score may also be applicable for prognostic prediction in pan-cancers.
Keywords
Introduction
In the past few years, immune checkpoint inhibitors (ICIs) have ushered in a new era of cancer treatment, demonstrating promising and durable antitumor effects across cancer types. 1 Among the most aggressive malignancies, esophageal cancer ranks seventh in terms of incidence (604,000 new cases) and sixth in terms of mortality (544,000 deaths), according to the latest global cancer statistics in 2020. 2 Esophageal squamous cell carcinomas (ESCCs) account for approximately 90% of all esophageal cancers in low-income countries. Traditional chemotherapy has limited efficacy for advanced ESCCs, and ICIs have markedly prolonged the overall survival (OS) of patients. 3 However, only 10−20% of patients with ESCC show objective responses to ICIs. Therefore, it is necessary to develop prognostic prediction biomarkers to select patients who may respond to immunotherapy.
Programmed cell death ligand-1 (PD-L1) expression, tumor mutation burden (TMB), and microsatellite instability have been validated as predictive biomarkers for clinical outcomes of anti- programmed cell death protein 1 (PD-1) therapy. 4 However, several limitations, such as lack of tissue samples, tumor heterogeneity, and low positive rate, remain intractable.5–7 Although potential predictors of anti-PD-1 therapy for ESCC, based on peripheral blood tests or baseline characteristics, such as neutrophil-to-lymphocyte ratio (NLR), lactate dehydrogenase (LDH), and the number of metastatic organs, have been reported,8–10 these indicators have not been widely used in clinical practice to predict the efficacy of ICIs. Moreover, the accuracy of predicting immunotherapy efficacy using a single predictive biomarker such as PD-L1 expression is limited. For example, in the KEYNOTE-181 study, the objective response rate (ORR) was only 22% even in ESCC patients with a PD-L1 combined positive score (CPS) ⩾10. 11 Strategies that combine two or more factors as a composite predictive biomarker might be more powerful for efficacy prediction. Higgs et al. 12 reported that the ORR was 27% in patients with PD-L1+ and was 33% in patients with IFN-γ+; the ORR was as high as 46% in patients with PD-L1+ and IFN-γ+.
To date, few studies have explored the combined biomarkers for predicting clinical outcomes of anti-PD-1 therapies in ESCC patients. In addition, although anti-PD-1 monotherapy has been shown to significantly improve OS in second-line treatment of ESCC patients compared to chemotherapy, the Kaplan–Meier survival analysis often reveals a phenomenon of curve crossing between the anti-PD-1 therapy group and chemotherapy group.11,13,14 This suggests that some patients may benefit more from chemotherapy than anti-PD-1 therapies. Strategies to identify patients who will benefit from either anti-PD-1 therapies or chemotherapy are still lacking.
Therefore, we conducted this retrospective study to identify potential prognostic prediction biomarkers based on peripheral blood testing and baseline characteristics, and to construct a combined immune prognostic index (CIPI) for prognosis prediction of ESCC patients receiving anti-PD-1 therapy.
Materials and methods
Study design and patients
This retrospective study comprised of patients with locally advanced or metastatic ESCC who were enrolled in the phase III ESCORT (NCT03099382) 13 and phase II ORIENT-2 (NCT03116152) 15 randomized, open-label clinical trials. Eligible patients in both studies were aged 18–75 years; had a histological or cytological diagnosis of ESCC; had advanced, recurrent, or distant metastatic disease; had progressed on or were intolerant to previous first-line chemotherapy; and had an Eastern Cooperative Oncology Group (ECOG) performance status of 0 or 1. Patients in the ESCORT study were randomized to receive either camrelizumab or chemotherapy, while patients in the ORIENT-2 study were randomized to receive either sintilimab or chemotherapy.
Patients who had received at least one dose of anti-PD-1 therapy were included in the discovery cohort to identify potential predictive biomarkers. To ascertain the specificity of the biomarkers for ICIs, patients who had received at least one dose of chemotherapy in both trials were included in the control cohort. Subsequently, a validation cohort consisting of pan-cancer patients, other than ESCC, who were treated with PD-1/PD-L1 inhibitors, was included to verify the findings. The validation cohort comprised of patients who enrolled in three clinical trials (NCT03101488, NCT02937116, and NCT02576509) conducted at the Department of Gastrointestinal Oncology, the Fifth Medical Centre, Chinese PLA General Hospital between October 2016 and July 2020.
Data collection
Data concerning baseline demographics, clinicopathological characteristics, molecular features, baseline blood test results (obtained within 7 days before the first treatment), tumor responses, and survival status were extracted from the electronic medical records. The NLR was defined as the absolute neutrophil count divided by the absolute lymphocyte count, and the platelet–lymphocyte ratio (PLR) was defined as the absolute platelet count divided by the absolute lymphocyte count.
Statistical analysis
Continuous variables were compared using the t test and categorical variables were compared using the chi-square test. The correlations between variables were analyzed using Spearman’s rank test. The receiver operating characteristic (ROC) curve was used to determine the specificity and sensitivity of different thresholds of continuous variables for survival, and the optimal cutoff values were identified by the maximum of the Youden index. Survival analysis was determined using the Kaplan–Meier method, and significant differences were compared using the log-rank test. Variables with a p value less than 0.2 were included in the final Cox proportional hazard regression model to evaluate their association with survival. The bootstrap resampling procedure (1000 replications) was used to validate the robustness of predictive model. All tests of significance used two-sided p values at the p < 0.05 level. The analyses were performed using GraphPad Prism v8.0 (GraphPad Software, Inc., San Diego, California, USA) and SAS software v9.4 (SAS Institute Inc., Cary, North Carolina, USA).
Results
Patient characteristics
A total of 629 patients with locally advanced or metastatic ESCC from the two clinical trials were included. The discovery cohort included 322 patients who had received anti-PD-1 therapy and the control cohort included 307 patients who had received chemotherapy (Supplemental Table S1). Overall, 563 patients (89.5%) were male, and the median age was 60 years (range: 36–74). A total of 468 patients (74.4%) had a body mass index of 18.5–24.9 kg/m2, and 494 patients (78.5%) had an ECOG performance status scale of 1. Furthermore, 382 patients (60.7%) had ⩾2 metastatic organs, and 162 patients (25.8%) had liver metastases. PD-L1 expression was positive [tumor proportional score (TPS]) ⩾1%] in 38.0% of patients, negative (TPS < 1%) in 52.1% of patients, and not available in 9.9% of patients. No significant difference was observed in terms of baseline demographics and clinical characteristics between the discovery cohort and control cohort.
Identification of a CIPI for ICIs-treated patients
First, we identified the optimal cutoffs of several continuous variables, including NLR, PLR, serum albumin (ALB), and LDH, by ROC curve analysis to categorize patients into two subgroups in the discovery cohort (4.0 for NLR, 145 for PLR, 43 g/L for ALB, and 220 U/L for LDH; Supplemental Figure 1a). Univariate analysis showed that NLR, PLR, ALB, LDH, and liver metastasis (LM) were associated with OS and PFS (Supplemental Figures 2 and 3). However, no correlation between PD-L1 expression and OS or PFS was observed.
Multivariate Cox proportional hazard regression showed that only NLR, ALB, and LM were independent prognostic factors for both OS and PFS in the discovery cohort (Table 1). This finding was further validated with a resampling bootstrap procedure (1000 replications), which replicated all analyses on each bootstrapped sample to assess the robustness of the model and obtained consistent results. In addition, the three variables were also correlated with tumor responses. Patients with NLR ⩽ 4, ALB > 43 g/L, and without LM were associated with a higher ORR (NLR: 23.6% versus 15.7%, p = 0.0929; ALB: 27.0% versus 15.3%, p = 0.0153; LM: 23.7% versus 8.3%, p = 0.0045) and a higher disease control rate (DCR; NLR: 58.0% versus 39.6%, p = 0.0017; ALB: 55.7% versus 45.5%, p = 0.0889; LM: 58.9% versus 20.8%, p < 0.0001; Supplemental Figure 4).
Multivariate Cox proportional hazard regression for OS and PFS in the discovery cohort (bootstrap procedure validation).
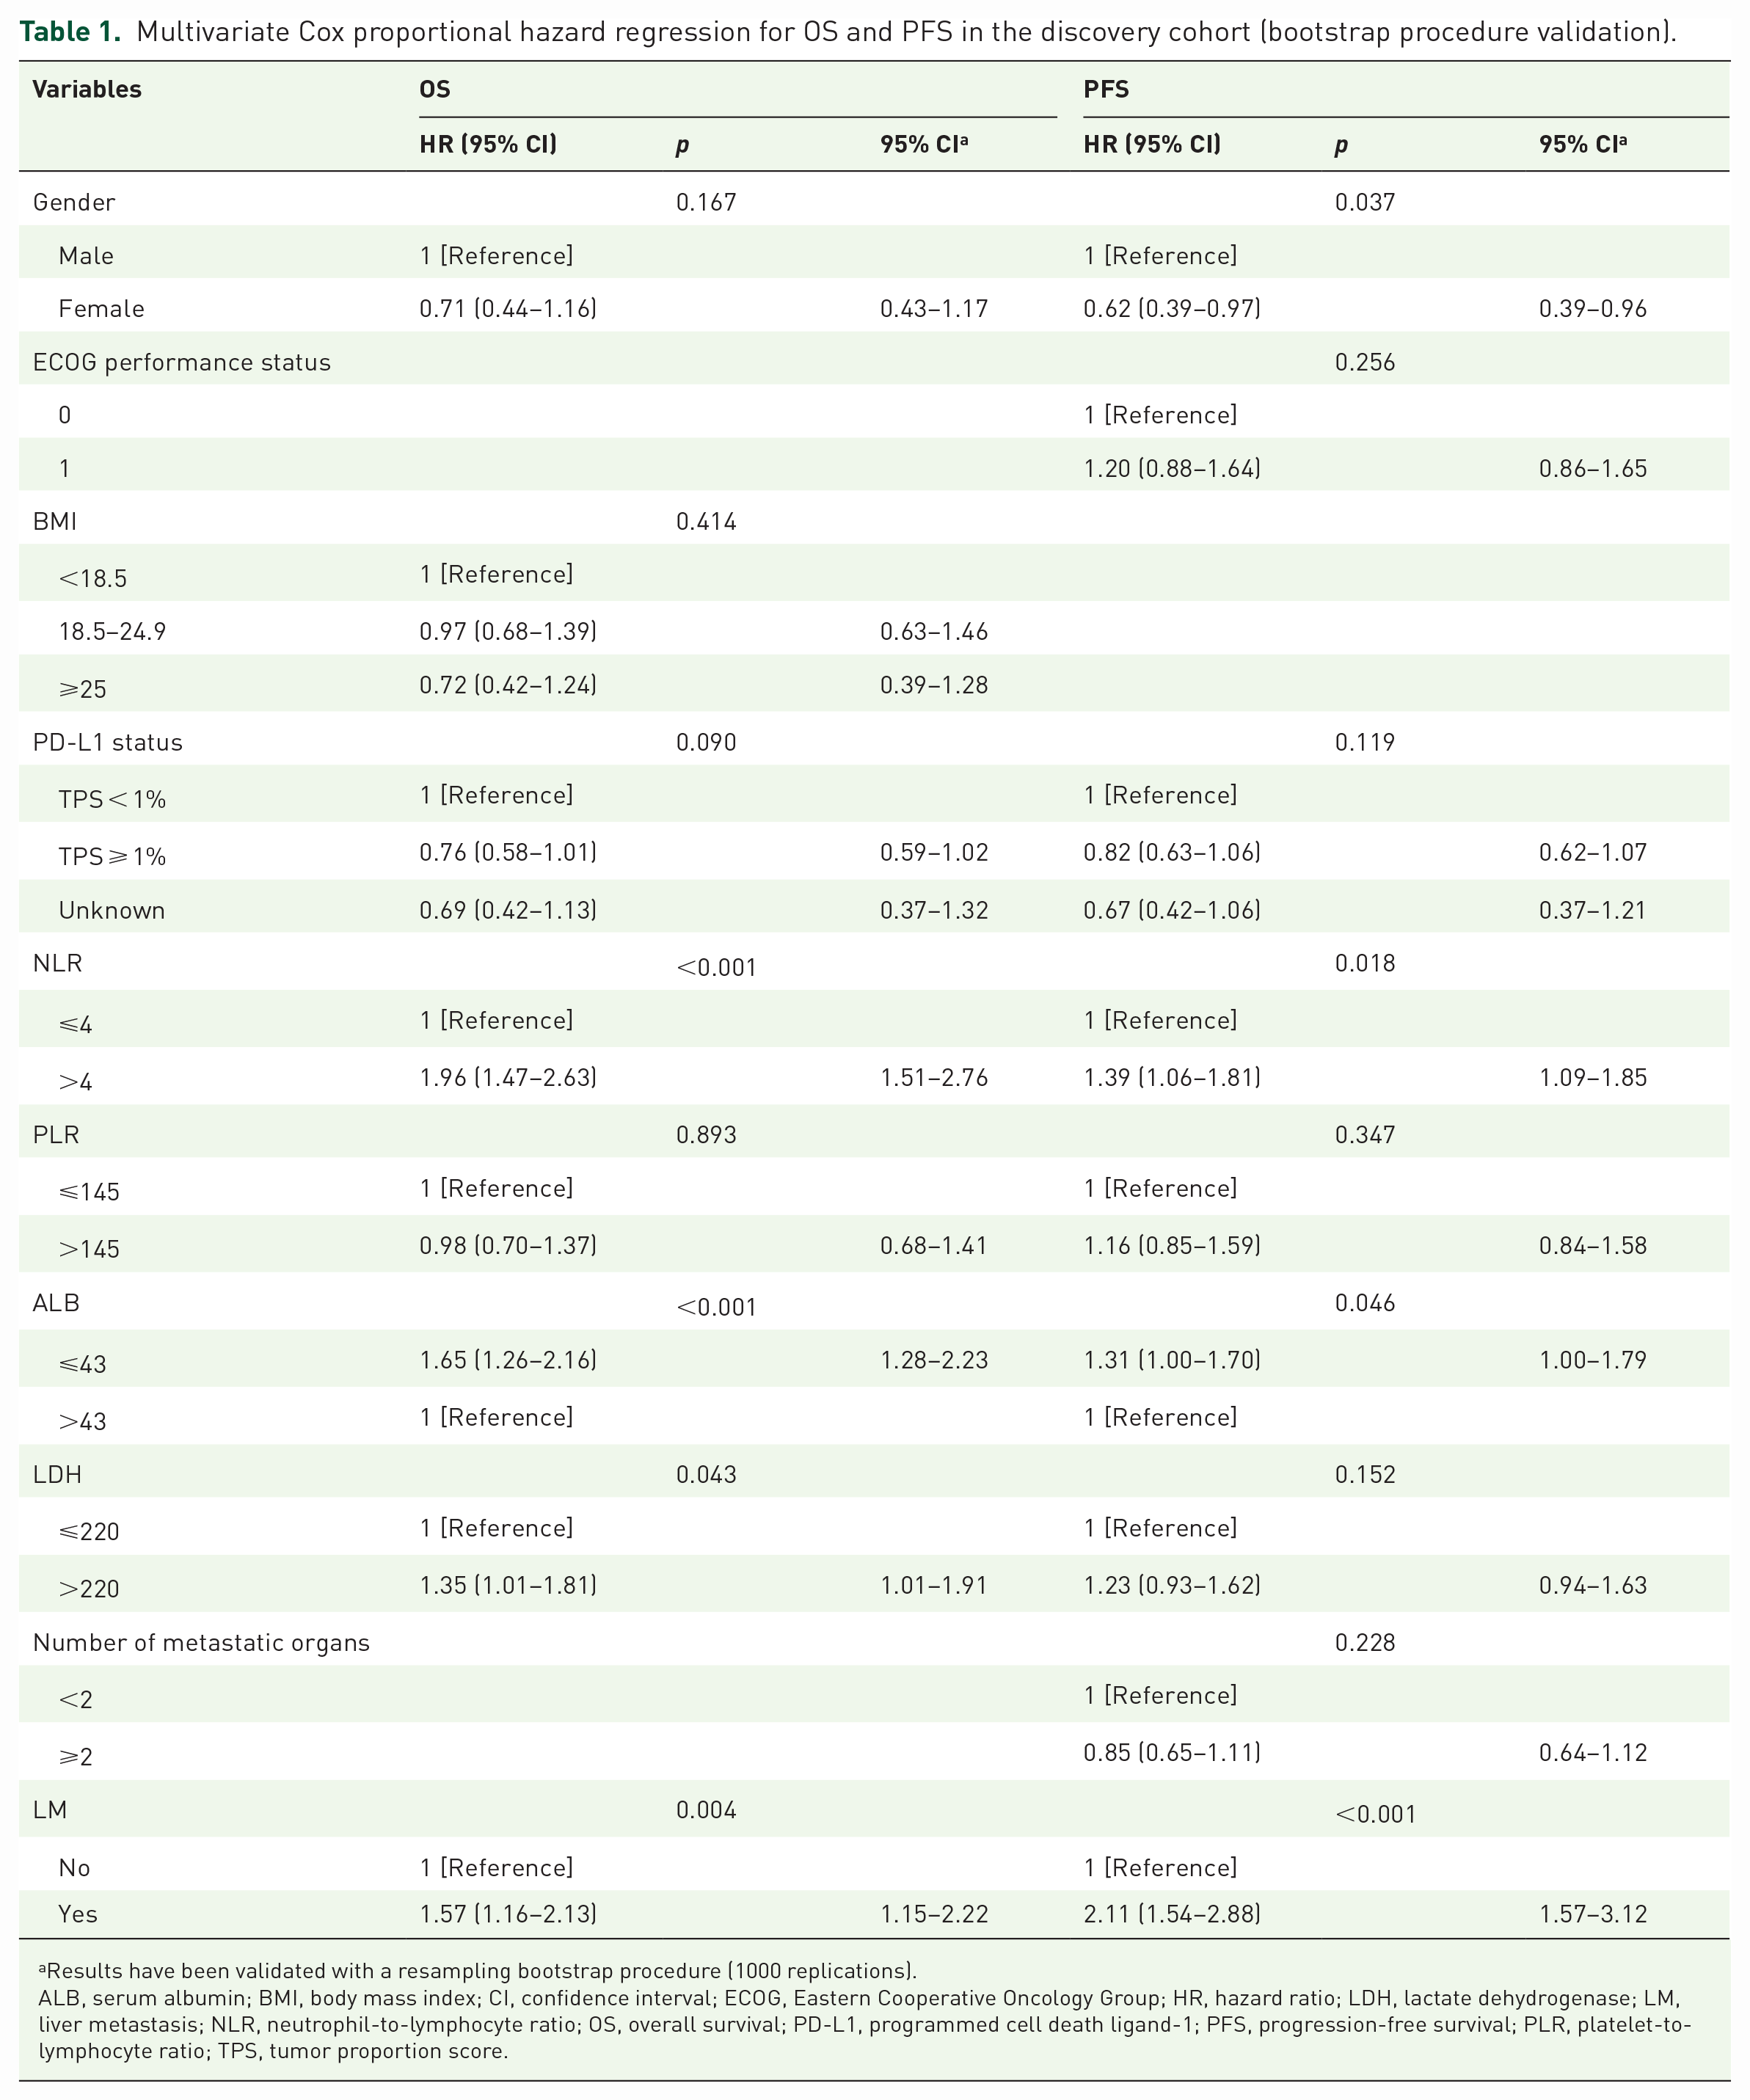
Results have been validated with a resampling bootstrap procedure (1000 replications).
ALB, serum albumin; BMI, body mass index; CI, confidence interval; ECOG, Eastern Cooperative Oncology Group; HR, hazard ratio; LDH, lactate dehydrogenase; LM, liver metastasis; NLR, neutrophil-to-lymphocyte ratio; OS, overall survival; PD-L1, programmed cell death ligand-1; PFS, progression-free survival; PLR, platelet-to-lymphocyte ratio; TPS, tumor proportion score.
Next, we evaluated the correlation among the NLR, ALB, and LM. No significant correlation was observed between NLR and ALB (p = 0.6739) or NLR and LM (p = 0.7688). In addition, although the ALB levels were statistically different between patients with and without LM, the median levels were similar (42 g/L versus 40 g/L, p = 0.0032). However, when ALB was used as a categorical variable, it was no longer associated with LM (p = 0.1598; Supplemental Figure 5). Therefore, it can be considered that none of the three variables were correlated with each other.
Subsequently, an integrated CIPI was constructed based on independent prognostic factors for both OS and PFS. The CIPI score was calculated using the following criteria: NLR ⩽ 4: 0 score, NLR > 4: 1 score; ALB > 43 g/L: 0 score, ALB ⩽43 g/L: 1 score; without LM: 0 score, with LM: 1 score. All patients in discovery cohort were stratified into four subgroups (CIPI 0, CIPI 1, CIPI 2, and CIPI 3), with a higher CIPI score assumed to be associated with a poorer prognosis. Among the 322 patients in the discovery cohort, 54 patients (16.8%) were CIPI 0, 127 patients (39.4%) were CIPI 1, 114 patients (35.4%) were CIPI 2, and 27 patients (8.4%) were CIPI 3. The clinical characteristics of patients from the four subgroups are summarized in Supplemental Table 2. Significant differences were observed in both OS and PFS among the subgroups, with the CIPI 0 subgroup exhibiting the best prognosis and the CIPI 3 subgroup showing the worst prognosis (median OS: 15.5 months versus 9.7 months versus 6.0 months versus 3.1 months, p < 0.0001; median PFS: 4.2 months versus 2.8 months versus 1.8 months versus 1.5 months, p < 0.0001; Figure 1(a) and (b)). In addition, the CIPI score was negatively correlated with tumor responses. Patients with CIPI 0 had the highest ORR and DCR, while patients with CIPI 3 had the lowest ORR and DCR (ORR: 35.8% versus 21.6% versus 13.0% versus 4.5%, p = 0.0019; DCR: 73.6% versus 56.0% versus 37.0% versus 13.6%, p < 0.0001; Figure 1(c) and (d)).
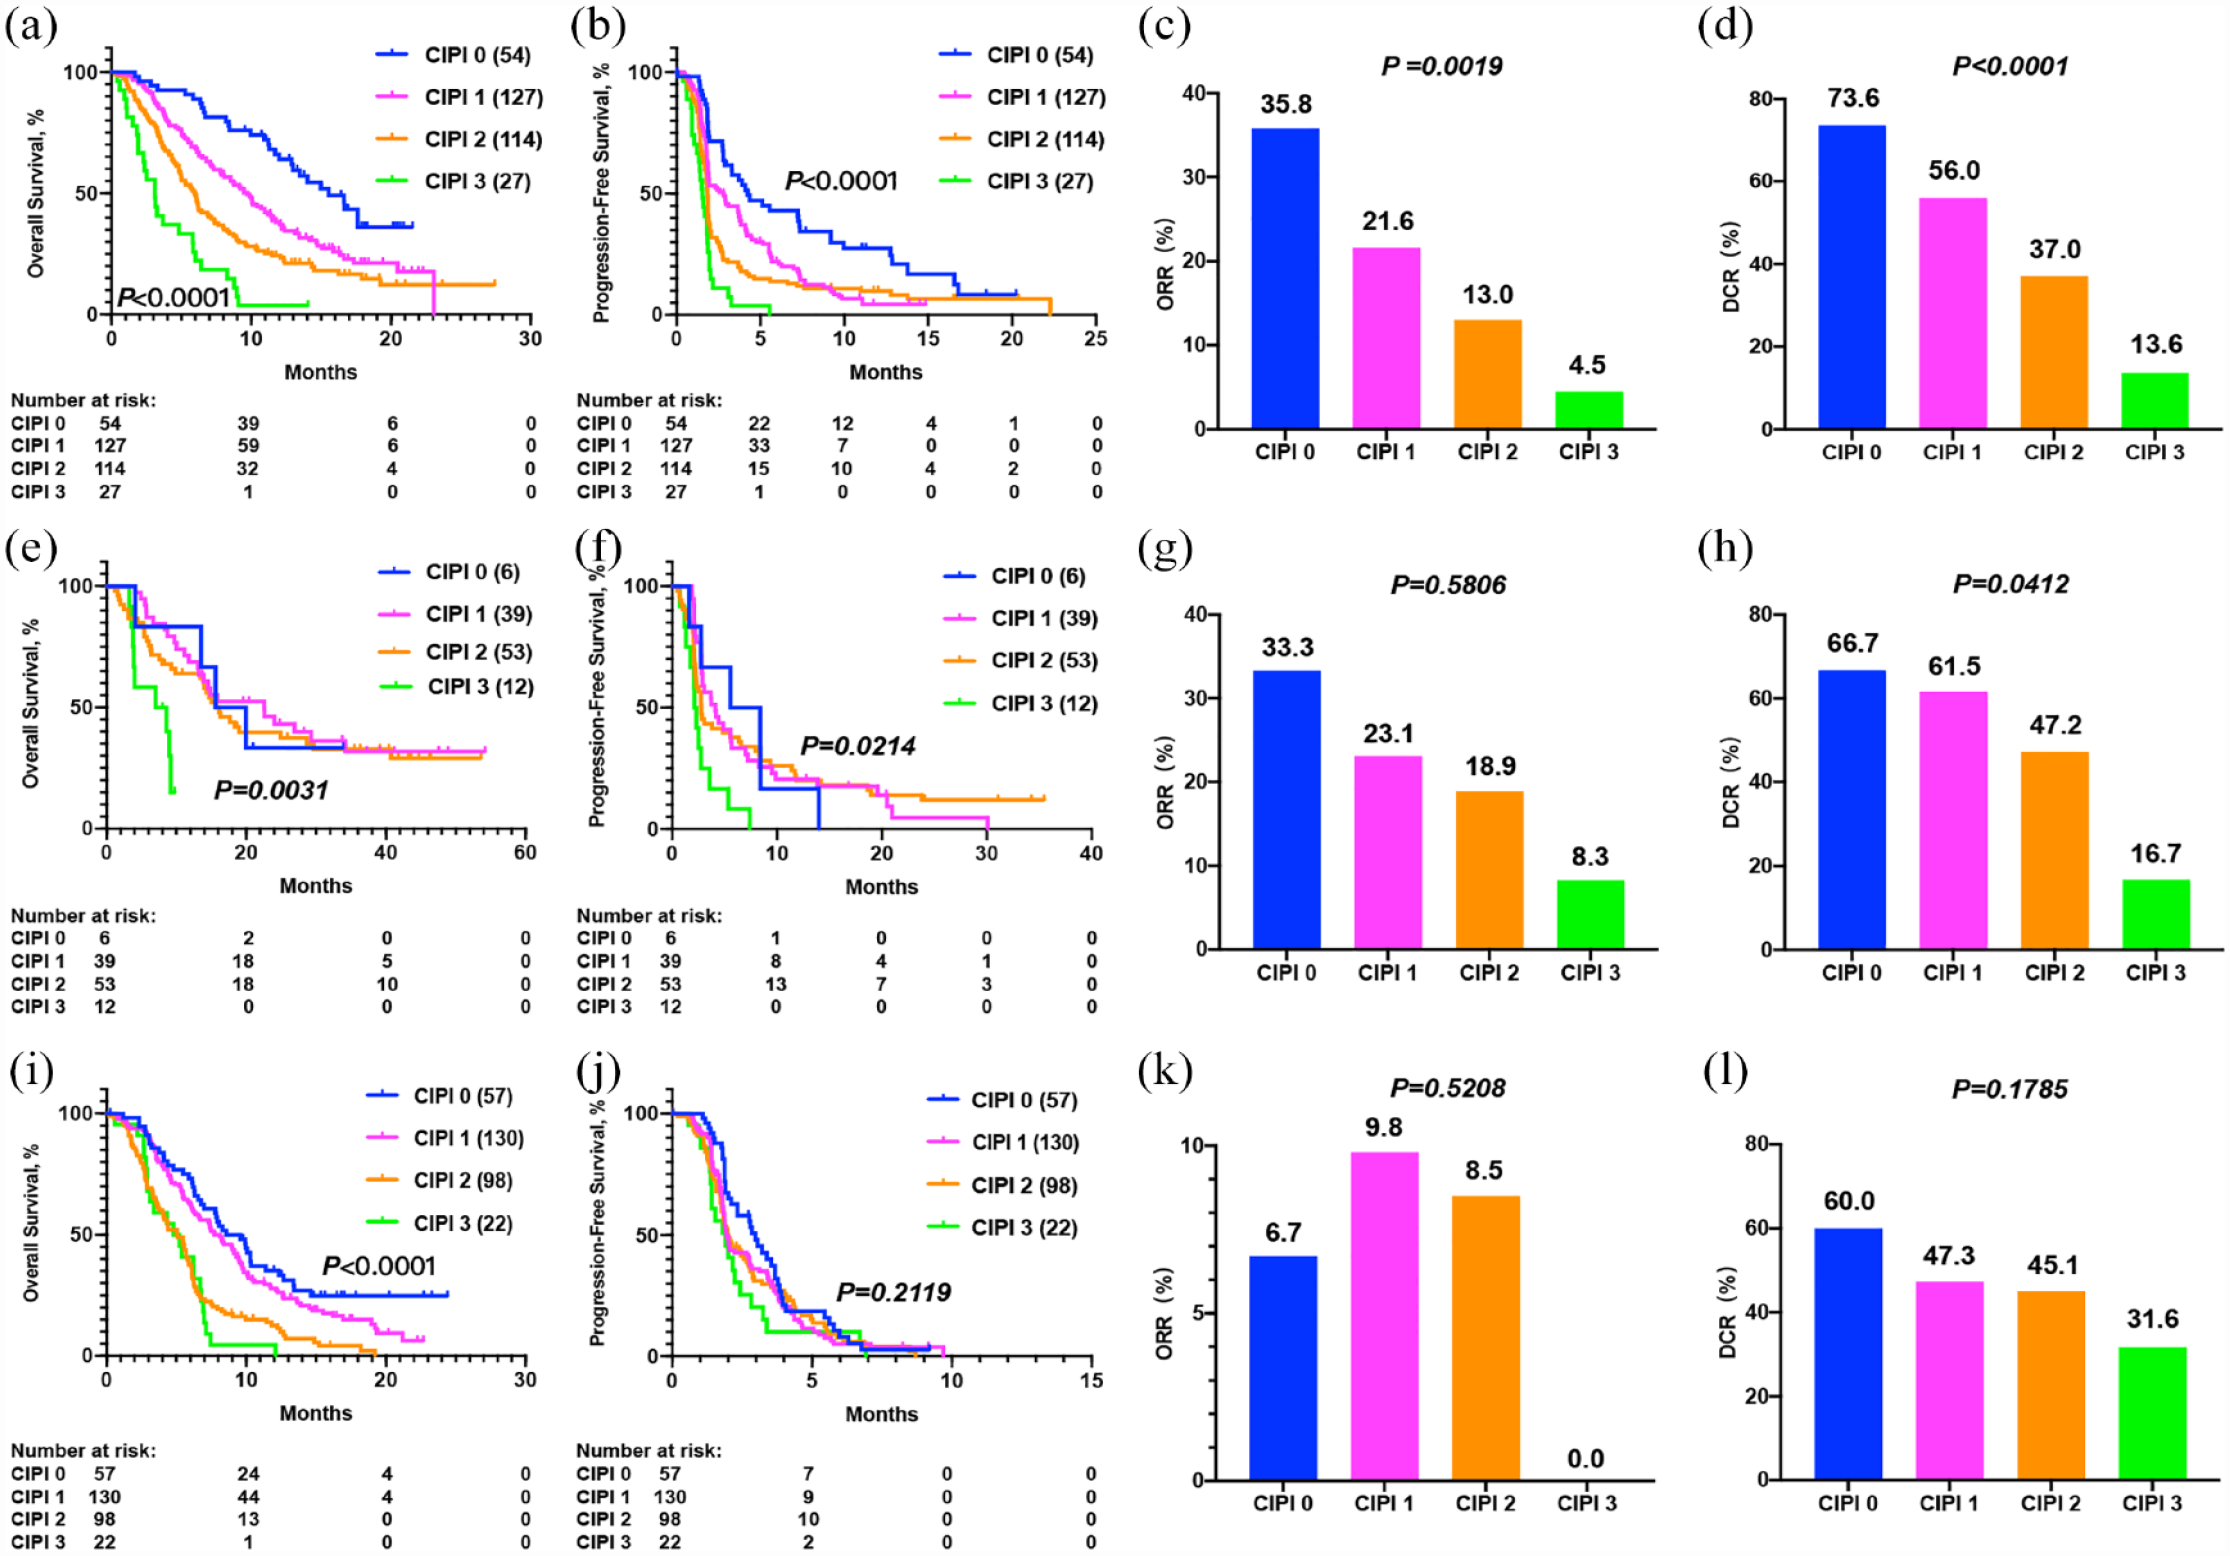
The performance of CIPI score for clinical outcomes prediction. (a) OS, (b) PFS, (c) ORR, and (d) DCR in patients with different CIPI scores in the discovery cohort. (e) OS, (f) PFS, (g) ORR, and (h) DCR in patients with different CIPI scores in the validation cohort. (i) OS, (j) PFS, (k) ORR, and (l) DCR in patients with different CIPI scores in the control cohort.
CIPI score can stratify survival benefits in pan-cancer cohort
The validation cohort consisted of 110 ICIs-treated patients with pan-cancer other than ESCC, including five cases of gastric cancer, 18 cases of colorectal cancer (CRC), 30 cases of hepatocellular carcinoma, nine cases of cholangiocarcinoma, five cases of pancreatic cancer, 21 cases of neuroendocrine neoplasm, and 22 cases of other tumors. The demographics and clinical characteristics of the validation cohort are shown in Supplemental Table 3.
Since the three factors in CIPI score (NLR, ALB, and LM) reflect the systemic immune status, we hypothesized that this model could be extrapolated to pan-cancers. Therefore, we use the CIPI score to stratify patients in the validation cohort, of which six patients (5.4%) had CIPI 0, 39 patients (35.5%) had CIPI 1, 53 patients (48.2%) had CIPI 2, and 12 patients (10.9%) had CIPI 3. A significant difference in prognosis was observed among the different CIPI subgroups. Although patients with CIPI 0 did not have the longest OS which was possibly due to the limited sample size, patients with CIPI 3 had the shortest OS and PFS (median OS: 17.8 months versus 22.6 months versus 15.7 months versus 7.8 months, p = 0.0031; median PFS: 7.0 months versus 3.9 months versus 2.8 months versus 2.2 months, p = 0.0214). Multivariate Cox proportional hazard regression confirmed this result (Supplemental Figures 6 and 7, and Supplemental Table 4). Meanwhile, the CIPI score was negatively correlated with tumor responses. Patients with CIPI 0 had the highest ORR and DCR, while patients with CIPI 3 had the lowest ORR and DCR (ORR: 33.3% versus 23.1% versus 18.9% versus 8.3%, p = 0.5806; DCR: 66.7% versus 61.5% versus 47.2% versus 16.7%, p = 0.0412; Figure 1(e)–(h)). This finding suggested that the CIPI score may serve as a potential prognostic biomarker in pan-cancer patients treated with ICIs.
CIPI score cannot stratify survival benefits in chemotherapy cohort
To determine the specificity of the CIPI for ICIs, we assessed its performance in patients who had received chemotherapy. Of the 307 patients in the control group, 57 patients (18.6%) were CIPI 0, 130 patients (42.3%) were CIPI 1, 98 patients (31.9%) were CIPI 2, and 22 patients (7.2%) were CIPI 3.
Results showed that although there was a significant difference in OS among the four subgroups (p < 0.0001), no significant difference in OS was observed between CIPI 0 and CIPI 1 (median OS: 9.1 months versus 8.1 months, p = 0.1207) or CIPI 2 and CIPI 3 (median OS: 5.0 months versus 5.0 months, p = 0.4048; data were not shown). In addition, no significant difference in PFS was observed among the four CIPI subgroups (p = 0.2119). The ORR or DCR among the CIPI subgroups was also similar (ORR: 6.7% versus 9.8% versus 8.5% versus 0%, p = 0.5208; DCR: 60.0% versus 47.3% versus 45.1% versus 31.6%, p = 0.1785; Figure 1(i)–(l)). These results indicated that the CIPI score was specific to ICIs and could not predict clinical outcomes of chemotherapy.
Next, we sought to identify variables that were associated with clinical outcomes of chemotherapy. We determined the optimal cutoffs of several continuous variables, including NLR, PLR, ALB, and LDH, by ROC curve analysis to categorize patients into two subgroups in the chemotherapy cohort (4.0 for NLR, 186 for PLR, 41 g/L for ALB, and 163 U/L for LDH; Supplemental Figure 1(b)). Univariate survival analysis showed that ECOG score (p = 0.0001), NLR (p < 0.0001), PLR (p < 0.0001), ALB (p < 0.0001), number of metastatic organs (p = 0.0002), and LM (p = 0.0084) were associated with OS, while ECOG score (p = 0.0012), NLR (p = 0.0489), PLR (p = 0.0075), LDH (p = 0.0262), and number of metastatic organs (p = 0.0080) were associated with PFS (Supplemental Figures 8 and 9). However, there were no differences in terms of OS and PFS according to PD-L1 expression. Multivariate Cox proportional hazard regression showed that only ECOG score was independently associated with both OS and PFS (Supplemental Table 5). These results may explain why the CIPI score, which is constructed of NLR, ALB, and LM, was not associated with clinical outcomes of chemotherapy.
CIPI score can further identify patients who benefit from either PD-1 inhibitor or chemotherapy
As there was no significant difference in baseline characteristics between the discovery cohort and the chemotherapy cohort, their survival differences could be compared directly. Overall, the median OS was significantly longer in the discovery cohort than that in the control cohort (median OS: 8.1 months versus 6.2 months, p = 0.0003), while the median PFS was 1.9 months in the discovery cohort compared with 2.0 months in the chemotherapy cohort (p = 0.0064) (Supplemental Figure 10). In patients with negative expression of PD-L1 (173/322, 53.7%), the median OS of anti-PD-1 treatment was similar to that of chemotherapy (median OS: 7.1 months versus 6.4 months, p = 0.1231; Supplemental Figure 11), which suggested that a proportion of patients did not benefit from anti-PD-1 treatment compared with chemotherapy.
Subsequently, we studied the survival benefits of different CIPI subgroups from anti-PD-1 treatment compared with chemotherapy. In the CIPI 0, CIPI 1, and CIPI 2 subgroups, anti-PD-1 treatment significantly improved both OS and PFS compared to chemotherapy (median OS: 8.7 months versus 6.4 months, p = 0.0001; median PFS: 2.0 months versus 2.0 months, p = 0.0015), nevertheless, such improvement was not observed in the CIPI 3 subgroup (median OS: 3.1 months versus 5.0 months, p = 0.6399; median PFS: 1.5 months versus 1.9 months, p = 0.0692) (Figure 2 and Supplemental Figure 12). Of the 27 patients with CIPI 3 in discovery cohort, 9 (33.3%) had PD-L1-positive expression, indicating that not all patients with PD-L1-positive expression were suitable for anti-PD-1 therapy.
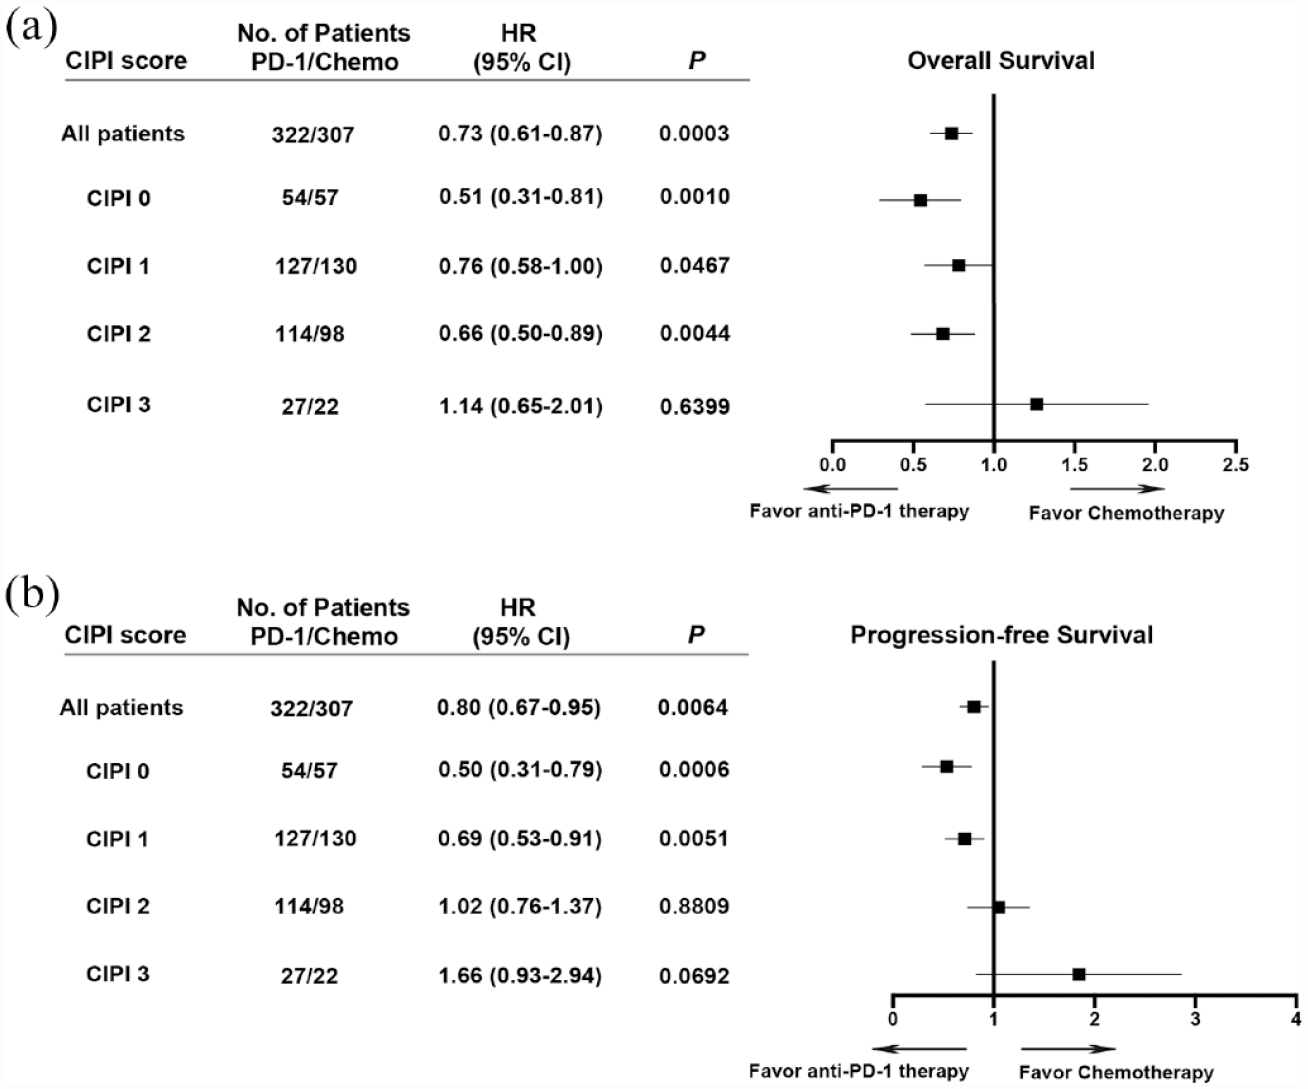
Prediction of (a) OS or (b) PFS benefits from anti-PD-1 therapies compared to chemotherapy using CIPI score.
Discussion
Our study demonstrated that the NLR, ALB, and LM were independently associated with clinical outcomes in ESCC patients treated with anti-PD-1 therapy. A CIPI score comprised of these three factors can further facilitate patient stratification for prognostic prediction. In addition, the CIPI score could be used to identify patients who may not benefit from anti-PD-1 monotherapy and for whom chemotherapy may be indispensable.
Multiple predictive biomarkers for clinical outcomes of anti-PD-1 therapy in ESCC patients have been developed. 16 To our knowledge, this is the first study to combine NLR, ALB, and LM as a comprehensive biomarker panel for predicting clinical outcomes of anti-PD-1 therapy in ESCC patients. In fact, NLR is usually regarded as an indicator of systemic inflammation state. Chronic, dysregulated, and persistent inflammation is associated with an increased risk of cancer and promotes tumorigenesis at all stages.17,18 As such, managing inflammation can help retard tumor progression. Long-term use of aspirin has been shown to reduce distant metastasis and overall mortality of tumors, particularly in gastrointestinal cancer. 19 NLR has been recognized as a predictive biomarker for clinical outcomes of anti-PD-1 therapy because it is in association with increased neutrophils and decreased T-cell infiltration in the tumor microenvironment.20,21 Neutrophils play a critical role in promoting tumor angiogenesis and tumor cell invasion, and further drive T-cell immunosuppression.22,23 Therefore, it can be assumed that NLR directly reflects the immunosuppressive tumor microenvironment. In addition, an increase in NLR is related to older age, greater tumor burden, and advanced stage.24–26
ALB generally reflects nutritional and inflammatory status. In the presence of inflammatory conditions, activated pro-inflammatory cytokines, such as tumor necrosis factor (TNF) and interleukin-6, can inhibit the generation of ALB. 27 Meanwhile, TNF can increase the permeability of capillaries, resulting in the loss of ALB. 28 ALB catabolism significantly promotes tumor growth, and a lower level of ALB indicates the severity and duration of gastrointestinal cancer. 29 Several studies have revealed that the reduction in ALB is associated with poor prognosis in cancer patients treated with traditional therapies, and ALB can serve as a prognostic biomarker of the clinical outcomes of ICIs in patients with non-small-cell lung cancer.28,30 The increased mortality associated with hypoalbuminemia may be due to the severity of the underlying disease, declined immunity to infection, and adverse events related to changes in drug bioavailability. 31 Infusion of ALB may play a potential role in immune recovery through binding to prostaglandin E2. 32 It is well established that eating difficulty usually causes malnutrition and cachexia in ESCC patients. In addition, inappetence and increased consumption caused by multiple therapies such as chemotherapy, radiotherapy, and surgery will further aggravate malnutrition. Therefore, appropriate infusion of ALB may be beneficial for ESCC patients.
There is mounting evidence suggesting that the presence of LM is related to poor clinical outcomes in patients undergoing anti-PD-1 therapy.33,34 The presence of hepatic immune tolerance may lead to a systemic immune desert, resulting in drug resistance to anti-PD-1 therapy. Lee et al. 35 found that Treg regulated the systemic immunity and immunotherapeutic response in the presence of LM, and inducing Treg inactivation could reverse the immunosuppressive state. Yu et al. 36 also showed that patients with LM exhibit decreased peripheral T-cell numbers and diminished tumoral T-cell diversity and function. Additional studies revealed that macrophages in the liver tumor microenvironment induce systemic immune tolerance by inducing T-cell clearance. Therefore, LM can serve not only as a biomarker for predicting clinical outcomes of anti-PD-1 therapy, but also as a theoretical basis for developing strategies that combine ICIs with other therapies for cancer.
Our study confirmed that NLR, ALB, and LM were independently associated with clinical outcomes in ESCC patients treated with anti-PD-1 therapy. Moreover, integrating these factors into the CIPI can further improve the accuracy of predicting efficacy of ICIs. In our study, no correlation between PD-L1 expression (TPS score) and clinical outcomes was observed, which is consistent with the findings of the ATTRACTION-3 trial. 14 In the KEYNOTE-181 trial, the OS of ESCC patients with a PD-L1 CPS of ⩾10 was only 3 months longer than that of PD-L1 CPS < 10. 11 Thus, although PD-L1 expression is widely accepted as a biomarker for guiding patient selection for anti-PD-L1 therapy, it may not be consistently effective across all patient populations. The combined prediction model may be superior to single biomarkers in predicting clinical outcomes of anti-PD-L1 therapy, as has been confirmed in many studies. For example, Chowell et al. 37 developed a machine learning model that integrated genomic, demographic, and clinical data to predict ICI response, and demonstrated that this model outperformed TMB alone. Besides, inexpensive, accessible, and non-invasive features are potential advantages of the CIPI score compared to previous prediction model. Moreover, in our study, the three factors in CIPI reflect systemic immune status, suggesting that it could serve as a prognostic predictive biomarker across multiple tumor types, and this has been validated in the pan-cancer cohort. Even though patients with a CIPI score of 0 did not achieve the longest OS among subgroups of pan-cancers, the results are still meaningful, particularly in this cohort with limited samples, multiple tumor types, different drugs, and different treatment lines. However, our findings require further validation in a larger cohort.
Besides, the CIPI score is specific to ICIs because of its failure in predicting the clinical responses of chemotherapy, and only a moderate prognostic value for OS was observed. NLR and ALB reflect a systemic inflammation state, which is always related to prognosis regardless of therapeutic regimen. However, LM was no longer an independent prognostic factor of OS in the chemotherapy cohort, which reduced the prognostic value of the CIPI. Moreover, none of the three variables was an independent prognostic factor of PFS in the chemotherapy cohort. One study reported a weak correlation between ORR and OS when evaluating whether ORR can serve as a potential surrogate endpoint for OS in immunotherapy trials, indicating that the OS benefit was not always consistent with clinical responses. 38 Meanwhile, ECOG score can be used as a prognostic biomarker for chemotherapy in ESCC patients, and patients with an ECOG of 0 had a superior survival from chemotherapy than those with an ECOG of 1. Multiple studies have indicated that ECOG score is associated with clinical outcomes in cancer patients.39,40 However, most studies pool patients with ECOG of 0 and 1 together, while few studies evaluated the differences in clinical outcomes between patients with ECOG of 0 versus 1. A previous study showed that patients with metastatic CRCs and an ECOG of 0 had a better prognosis than those with an ECOG of 1. 41 The tolerance to chemotherapy is closely related to ECOG performance status, especially in patients with gastrointestinal cancer. Therefore, distinguishing between ECOG scores of 0 or 1 may be clinically meaningful for patients receiving chemotherapy. However, in our study, no correlation between ECOG score and clinical outcomes was observed in patients with anti-PD-1 therapy.
The concept of ‘chemo-free’ has arisen in light of the rapid development of immunotherapy, but it is crucial to acknowledge that chemotherapy still plays an important role in cancer treatment. 42 Not all patients benefit more from anti-PD-1 monotherapy than chemotherapy. CheckMate-026 study demonstrated that anti-PD-1 therapy led to a longer PFS than chemotherapy in patients with high TMB; on the other hand, anti-PD-1 therapy resulted in a shorter PFS than chemotherapy in patients with TMB-low or medium. 43 The KEYNOTE-181 study showed that pembrolizumab prolonged OS compared with chemotherapy in the sub-cohort with PD-L1 CPS ⩾ 10 as second-line therapy for advanced esophageal cancer, which only represents 34% of the study population. 11 In our study, 53.7% of the population with PD-L1-negative expression could hardly derive any additional benefits from immunotherapy relative to chemotherapy, while those selected by CIPI score only account for 8.4%. In addition, CheckMate-648 study 44 showed that a significantly crossover in survival curve and similar ORR (28% versus 27%) between anti-PD-1 antibody in combination with anti-cytotoxic T lymphocyte-associated antigen-4 antibody and chemotherapy for ESCC patients treated in first line, and the potential predictive role of CIPI score in this population requires further investigation. Patients who cannot benefit from anti-PD-1 monotherapy may be associated with an immunosuppressive microenvironment. Multiple tumor promoting mechanisms ultimately lead to the establishment of ‘cold tumor’, which may require combinatorial strategies to achieve clinical benefit. 45 Overall, personalized therapy for cancer patients is more valuable than ‘chemo-free’. Interestingly, PD-L1-positive expression was observed in 37.8% of patients who were not suitable to receive anti-PD-1 monotherapy, suggesting that patients cannot be recommended to receive anti-PD-1 monotherapy solely based on PD-L1-positive expression. Comprehensive prediction models that integrate different types of data are critical in future.
In conclusion, we demonstrated that the CIPI score could predict clinical outcomes of anti-PD-1 therapy in patients with ESCC, and this scoring system could be extrapolated to pan-cancers. In addition, we demonstrated that CIPI score can be used for identifying patients who are unlikely to benefit from anti-PD-1 therapy. The novel prognostic indicators developed in this study may contribute to personalized treatment of cancer patients.
Supplemental Material
sj-docx-1-tam-10.1177_17588359231174869 – Supplemental material for A combined immune prognostic index in esophageal squamous cell carcinoma patients treated with anti-PD-1 therapy
Supplemental material, sj-docx-1-tam-10.1177_17588359231174869 for A combined immune prognostic index in esophageal squamous cell carcinoma patients treated with anti-PD-1 therapy by Shoujian Ji, Chuanhua Zhao, Rongrui Liu, Yan Wang, Qing Yang, Hua Yang and Jianming Xu in Therapeutic Advances in Medical Oncology
Footnotes
Acknowledgements
We thank the investigators and patients for participating those trials in our study. We appreciate the efforts of professional staff in Innovent Biologics, Inc. and Jiangsu Hengrui Medicine Co. Ltd.
Declarations
Supplemental material
Supplemental material for this article is available online.
References
Supplementary Material
Please find the following supplemental material available below.
For Open Access articles published under a Creative Commons License, all supplemental material carries the same license as the article it is associated with.
For non-Open Access articles published, all supplemental material carries a non-exclusive license, and permission requests for re-use of supplemental material or any part of supplemental material shall be sent directly to the copyright owner as specified in the copyright notice associated with the article.