
Abstract
Background and aims:
Hepatic arterial infusion chemotherapy (HAIC) using the FOLFOX regimen (oxaliplatin plus fluorouracil and leucovorin) is a promising option for large hepatocellular carcinoma (HCC). However, post-HAIC prognosis can vary in different patients due to tumor heterogeneity. Herein, we established two nomogram models to assess the survival prognosis of patients after HAIC combination therapy.
Methods:
A total of 1082 HCC patients who underwent initial HAIC were enrolled between February 2014 and December 2021. We built two nomogram models for survival prediction: the preoperative nomogram (pre-HAICN) using preoperative clinical data and the postoperative nomogram (post-HAICN) based on pre-HAICN and combination therapy. The two nomogram models were internally validated in one hospital and externally validated in four hospitals. A multivariate Cox proportional hazards model was used to identify risk factors for overall survival (OS). The performance outcomes of all models were compared by area under the receiver operating characteristic curve (AUC) analysis with the DeLong test.
Results:
Multivariable analysis identified larger tumor size, vascular invasion, metastasis, high albumin–bilirubin grade, and high alpha-fetoprotein as indicators for poor prognosis. With these variables, the pre-HAICN provided three risk strata for OS in the training cohort: low risk (5-year OS, 44.9%), middle risk (5-year OS, 20.6%), and high risk (5-year OS, 4.9%). The discrimination of the three strata was improved significantly in the post-HAICN, which included the above-mentioned factors and number of sessions, combination with immune checkpoint inhibitors, tyrosine kinase inhibitors, and local therapy (AUC, 0.802 versus 0.811, p < 0.001).
Conclusions:
The nomogram models are essential to identify patients with large HCC suitable for treatment with HAIC combination therapy and may potentially benefit personalized decision-making.
Lay summary
Hepatic arterial infusion chemotherapy (HAIC) provides sustained higher concentrations of chemotherapy agents in large hepatocellular carcinoma (HCC) by hepatic intra-arterial, result in better objective response outperformed the intravenous administration. HAIC is significantly correlated with favorable survival outcome and obtains extensive support in the effective and safe treatment of intermediate advanced-stage HCC. In view of the high heterogeneity of HCC, there is no consensus regarding the optimal tool for risk stratification before HAIC alone or HAIC combined with tyrosine kinase inhibitors or immune checkpoint inhibitors treatment in HCC. In this large collaboration, we established two nomogram models to estimate the prognosis and evaluate the survival benefits with different HAIC combination therapy. It could help physicians in decision-making before HAIC and comprehensive treatment for large HCC patients in clinical practice and future trials.
Keywords
Introduction
Hepatocellular carcinoma (HCC) accounts for the majority of primary liver cancer cases, and is the third leading cause of cancer-associated mortality globally and causes considerable mortality and morbidity in China.1–3 With few physical examinations and insufficient radiological surveillance, patients are diagnosed with large HCC (diameter: >5 cm) in advanced stage at the first visit. 4 Management of large HCC has always been a great challenge regardless of tumor stage (Barcelona Clinic Liver Cancer, BCLC). Even with the application of transarterial chemoembolization (TACE), there are many reports related to TACE resistance for large tumors.5,6 Hepatic arterial infusion chemotherapy (HAIC), as an effective and safe transcatheter chemotherapy, provides sustained higher concentrations of chemotherapy agents in tumors than intravenous chemotherapy. A randomized phase III trial provided strong evidence: HAIC with infusion fluorouracil, leucovorin, and oxaliplatin (FOLFOX) yielded better responses and survival benefits than TACE in large unresectable HCC. 5
Currently, there is no consensus regarding the optimal tool for risk stratification before HAIC treatment in large HCC, which may lead to failure in clinical trials due to suboptimal patient selection. Clinically, the BCLC staging system plays important roles in prognostic prediction and treatment decision-making and mainly depends on the largest diameter of HCCs and the number of HCCs detected on computed tomography (CT). 7 However, different prognostic outcomes were found in patients within the same BCLC stage after treatment with equivalent HAIC schemes with the FOLFOX regimen due to a wide range of tumor heterogeneity.8–12 Since anatomical features alone are far from sufficient to predict the prognosis of HAIC, an increasing number of scholars are exploring the risk factors related to HAIC treatment in large HCC.13–15
In addition, HAIC combined with targeted chemotherapy or immune checkpoint inhibitors (ICIs) is recommended for advanced HCC in clinical practice.16–19 For example, Shi Ming et al. demonstrated that the combination of HAIC and sorafenib was superior to sorafenib alone for the treatment of advanced HCC patients with portal vein invasion. 12 In addition, several previous studies used sequential local treatments after HAIC, such as surgical resection and thermal ablation, to manage large HCCs.20,21 However, uncertainty remains regarding whether aggressive treatment strategies are needed for all advanced carcinomas. Therefore, Qiang et al. attempted to investigate several predictive methods to distinguish low-risk patients with locoregionally advanced nasopharyngeal carcinoma receiving induction chemotherapy, for whom concurrent chemoradiotherapy was sufficient.
A prognostic model that only requires preoperative clinical parameters could help interventional radiologists select optimal HAIC candidates. In this multicenter study, we employed large cohorts from different hospitals to develop and validate prognostic nomogram models for patients with large HCC treated with HAIC based on readily accessible clinical variables. The two developed nomogram models were as follows: one with clinical variables available before HAIC enabling the preoperative prediction of overall survival (OS); the other with HAIC combined with other treatments, including targeted tyrosine kinase inhibitors (TKIs), ICIs, and sequential local treatment. These nomograms could divide large HCC patients into high-risk, middle-risk and low-risk groups based on the cutoff value of the overall score and could elucidate the survival benefits of combination therapy in different risk groups.
Materials and methods
This retrospective, multi-institutional study protocol was approved by the Institutional Review Boards of all participating institutions and was conducted in accordance with the principles of the 1964 Helsinki Declaration. The requirement for informed consent was waived due to the retrospective nature of this study.
Study design
Between February 2014 and December 2021, a total of 5210 patients with HCC who underwent initial HAIC were reviewed in five hospitals (Sun Yat-sen University Cancer Center, Guangdong Provincial People’s Hospital, The First Affiliated Hospital of Sun Yat-sen University, The Third Affiliated Hospital of Sun Yat-sen University, and Chinese Academy of Medical Sciences Cancer Hospital). Some patients in this study were enrolled from previous clinical trials (NCT03164382). HCC was diagnosed according to the guidelines of the American Association for the Study of Liver Diseases and the European Association for the Study of the Liver. The inclusion criteria were as follows: (i) age 18–80 years; (ii) Eastern Cooperative Oncology Group performance score < 2; (iii) Child-Turcotte-Pugh (CTP) grade A or B; and (iv) largest tumor diameter > 5 cm. The exclusion criteria were as follows: (i) history of other malignancies; (ii) combination with other treatments such as surgery and TACE before HAIC; (iii) inadequate blood or bone marrow (leukopenia count < 3.0 × 10⁹/L, platelet count < 50×109/L, and hemoglobin < 8.0 g/L); and (iv) less than 6 months of follow-up after initial HAIC. The HAIC procedure, modified FOLFOX6 regimen, and criteria for protocol treatment discontinuation are detailed in the Supplemental Information (E1.1–1.4). To improve the survival benefit, systemic metastasis should be controlled and tumor burden should be reduced. Therefore, after HAIC several patients received ICIs, TKIs, and sequential local treatments, including surgery, radiofrequency ablation, microwave ablation and stereotactic radiotherapy (Supplemental Table S1-S).
Follow-up and definition of survival outcomes
All patients were reviewed at the last follow-up date (30 June 2022). Serum alpha-fetoprotein (AFP), des-γ-carboxy prothrombin and contrast-enhanced CT (CECT) images were reexamined 1 and 3 months after HAIC at approximately 3- to 6-month intervals. New therapeutic interventions would be implemented once recurrent lesions were identified based on CECT or tumor markers. OS was defined as the period from the date of initial HAIC to the date of the patient’s death or the last follow-up.
Clinical data collection and selection
In all, 32 clinical variables were collected for risk factor analysis of OS, as shown in the Supplementary Information (E.1.5). Missing values were replaced by the median value for continuous variables, and a random forest algorithm was used for categorical variables. Subsequently, the significant risk factors were included in univariate and multivariate Cox proportional hazards regression models. The correlation matrix was used to assess the related variables for collinearity and identify plausible interaction terms, including interactions between different risk factors. No significant interactions were found.
Development and validation of nomograms
Backward stepwise selection was employed with the Akaike information criterion to evaluate clinical variables for the multivariable Cox proportional hazards regression models. The significant variables were incorporated to predict the 1-, 3- and 5-year OS rates before and after HAIC treatment. The regression coefficients were implemented for each individual observation to define the linear predictors in the nomograms [18628454]. The area under the receiver operating characteristic curve (AUC) and 95% confidence interval (CI) were calculated to assess the performance of the prognostic models using bootstrapping with 1000 bootstrap intervals. The time-dependent AUC and integrated Brier score (IBS) were used to evaluate the prognostic accuracy and estimate the prediction of error curves at different time points [10877287, 23628227, and 31934830]. The DeLong test was employed to evaluate and compare the model’s performance.
Statistical analysis
All statistical analyses were performed using R (version 4.2.0, Foundation for Statistical Computing, Vienna, Austria). Continuous variables are presented as the mean ± standard deviation or the median with interquartile range (IQR). The latter had highly skewed distributions. Survival curves were calculated using the Kaplan‒Meier method and compared using the log-rank test. Univariate and multivariate Cox regression analyses were applied to calculate the hazard ratios (HRs) and corresponding 95% CIs of variables and identify independent prognostic factors. The predictive performance of these models was measured by Harrell’s C-index and compared using the method in a previous study. A two-tailed p value of less than 0.05 was considered statistically significant.
Results
Risk factors associated with OS after HAIC
The patient enrollment process of this study is shown in Figure 1. A total of 1082 patients (112 females and 970 males; mean age, 50.8 ± 10.2 years) were finally screened in our study. The primary cohort was divided into a training cohort (n = 659) and an internal test cohort (n = 163) at a ratio of 8:2. Correspondingly, two external test cohorts were developed (n = 125 and n = 135). The baseline characteristics of all cohorts are summarized in Table 1. The baseline characteristics were different between the HAIC alone group and the HAIC combination therapy group (Supplemental Tables S1–3). During a median follow-up time of 30.2 months (IQR, 7.4–52.6 months), 389, 99, 54, and 89 patients died in the training cohort, internal test cohort, and two external test cohorts. The cumulative 1-, 3-, and 5-year OS rates were 63.1%, 42.0%, and 40.9%, respectively, in the training cohort. In univariate analysis, seven clinical variables were found to be associated with poor OS before HAIC in the primary cohort (Supplemental Tables S4 and 5). Multivariate analysis showed that higher platelets–albumin–bilirubin (PALBI) grade, multiple tumors, AFP level greater than 400 ng/mL, vascular invasion, and metastasis were the independent risk factors for poor OS (Table 2). In this case, combinations of TKIs, ICIs, and sequential local treatment after HAIC were also independent factors, which could significantly improve the OS of HCC patients after HAIC (Table 2).

Enrollment pathway of large HCC patients who underwent HAIC.
Comparisons of baseline characteristics of HCC patients undergoing HAIC in different cohorts.

AFP, alpha-fetoprotein; AJCC, American Joint Committee on Cancer; ALBI, albumin–bilirubin; BCLC, Barcelona Clinic Liver Cancer; BMI, body mass index; CLIP, Cancer of the Liver Italian Program; HAIC, hepatic arterial infusion chemotherapy; HBV, hepatitis B virus; HCC, hepatocellular carcinoma; HCV, hepatitis C virus; HongKong, Hong Kong Liver Cancer; ICI, immune checkpoint inhibitors; IQR, interquartile range; JSH, Japan Society of Hepatology; LY, lymphocyte; NEU, neutrophil; NLR, neutrophil-to-lymphocyte ratio; PALBI, platelets–albumin–bilirubin; PIVKA, protein induced by vitamin K absence-II; PS, performance status; TKI, tyrosine kinase inhibitor.
Multivariable Cox regression analysis of predictors of OS for HCC patients undergoing HAIC in the development cohort.

Cox regression analyses are used to calculate the HRs and 95% CIs based on OS. Covariables that are significant in univariable Cox regression analysis (p < 0.05) are included in the multivariable analysis, which were noted in Supplemental Tables 1 and 2.
AFP, alpha-fetoprotein; CI, confidence interval; HAIC, hepatic arterial infusion chemotherapy; HCC, hepatocellular carcinoma; HRs, hazard ratios; ICI, immune checkpoint inhibitors; OS, overall survival; PALBI, platelets–albumin–bilirubin; TKI, tyrosine kinase inhibitor.
Development and validation of HAIC nomograms
We developed two nomogram models integrating independent risk factors in the training cohort. For HCC patients before HAIC, the prognostic model was named the pre-HAIC nomogram (pre-HAICN). Meanwhile, the post-HAIC prognostic model was named the post-HAIC nomogram (post-HAICN). The prediction model for patients who had not received HAIC treatment was the pre-HAICN model, which was developed based on clinical variables including PALBI grade, multiple tumors, AFP, vascular invasion and tumor metastasis (Figure 2(a) and (b)). The post-HAICN model for patients who had received HAIC combination therapy was based on clinical variables including PALBI grade, multiple tumors, AFP, vascular invasion, metastasis, HAIC sessions, sequential local treatment, and combination with TKIs and ICIs (Figure 2(c) and (d)). Patients who received one individualized grade and higher total points of the assigned number had a worse OS. The two nomograms were also verified in one internal test cohort and two external test cohorts. To add clinical convenience, a user-friendly online application of the two HAIC-related nomograms was developed and uploaded on our website (for pre-HAICN: https://prehaicnomogramforhcc.shinyapps.io/DynNomapp/; for post-HAICN: https://prehaicnomogramforhcc.shinyapps.io/postHAICN/).

Development of prognostic models. (a) The pre-HAIC nomogram (pre-HAICN) was established using diagnostic factors for patients who had not received HAIC treatment and had preoperative HAIC data. (b) The website for the pre-HAICN is available at https://prehaicnomogramforhcc.shinyapps.io/DynNomapp/. (c) The post-HAIC nomogram (post-HAICN) was established using multiple factors for patients who had undergone HAIC treatment and had both preoperative and post-HAIC data. (d) The website for post-HAICN is available at https://prehaicnomogramforhcc.shinyapps.io/postHAICN/.
Survival risk stratification
To facilitate the clinical practice of these HAICN models, we divided the HCC patients into three risk groups according to the risk scores of the nomogram models: high-risk group, middle-risk group, and low-risk group. We identified the cutoff values in the training cohort and verified them in the internal and external test cohorts. This pragmatic visualization of the risk level could help in deciding the strategy of HAIC treatment for HCC patients. According to the risk scores from both nomogram models, the 5-year OS of patients in the low-risk group was better than that of patients in the middle- and high-risk groups of all cohorts (log-rank test, p < 0.05) (Figure 3(a)–(d)). The Kaplan–Meier curves showed that the statistical HR value for the risk groups post-HAICN was significantly higher than that pre-HAICN (Figure 3(e)–(h)). Subgroup analysis was performed to evaluate the performance of these risk groups in different BCLC stages. In BCLC stages 2 and 3, all patients in the high-risk group had worse OS than those in the low-risk group (log-rank test, p < 0.05) (Supplemental Figures 1 and 2).
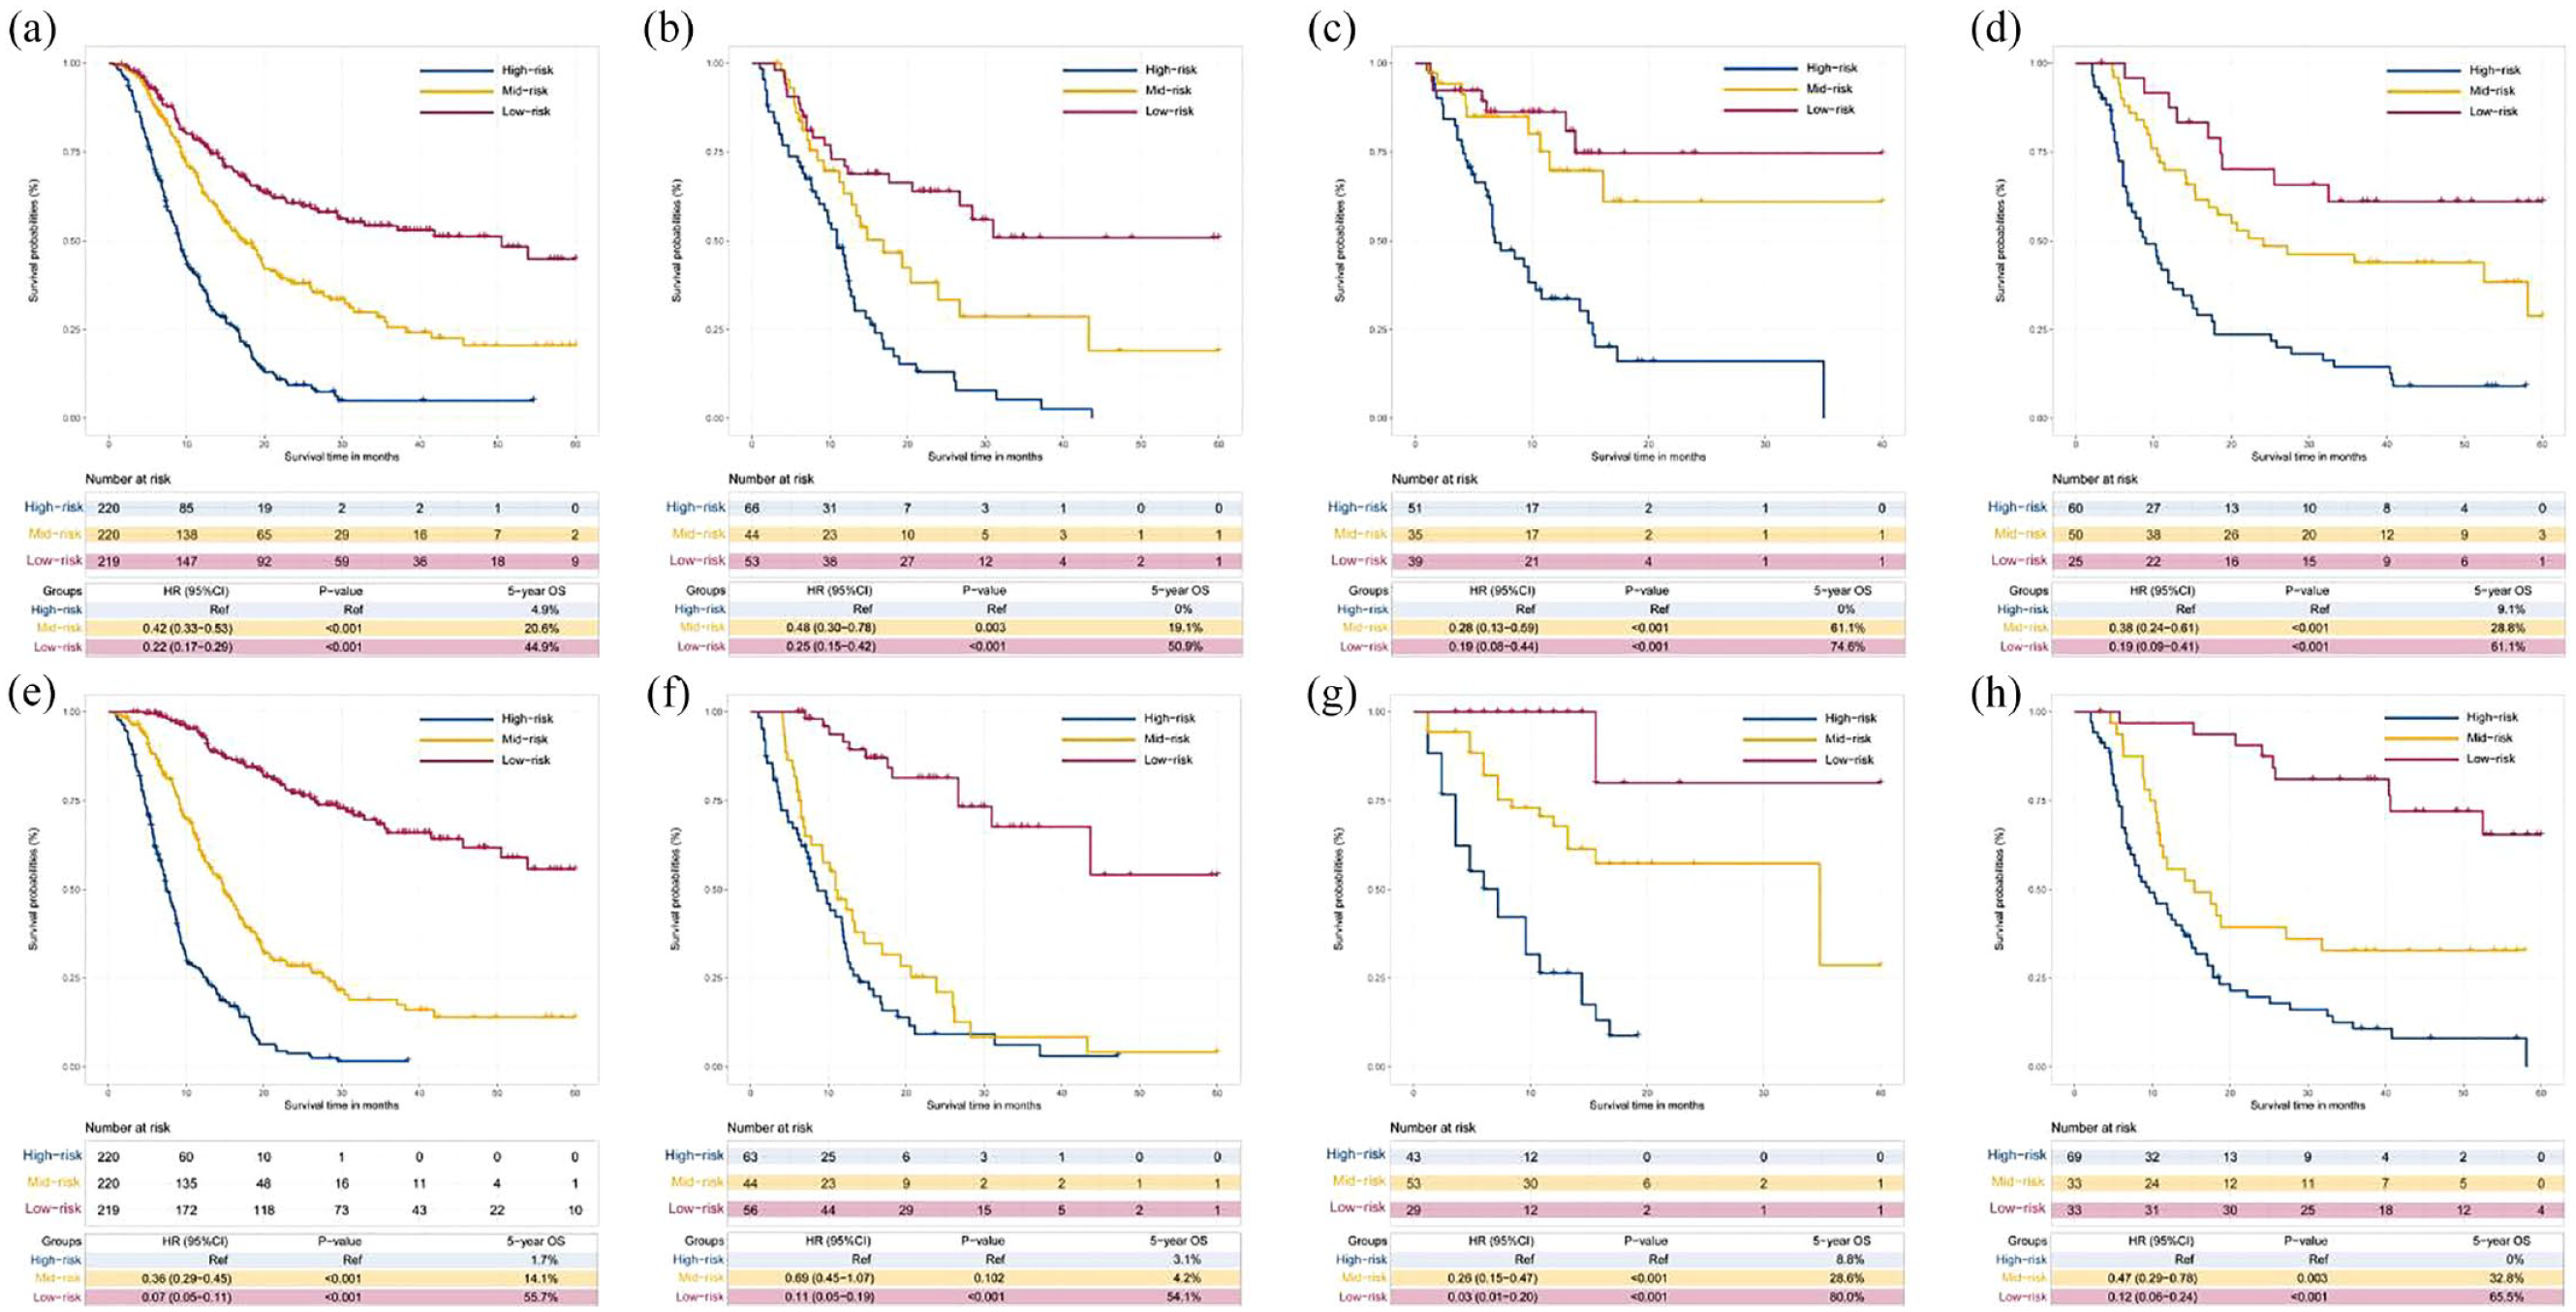
Comparing the survival among different risk level groups based on the two prognostic models. According to the risk scores from the pre-HAIC nomogram (pre-HAICN), the HCC patients were divided into high-, middle- and low-risk groups (a–d). KM curves for the OS of HCC patients in these three risk level groups in (a) the training cohort, (b) the internal test cohort, (c) the first external test cohort, and (d) the second external test cohort based on the pre-HAICN. KM analysis of the risk scores for OS among the high-, middle- and low-risk groups based on the post-HAIC nomogram (post-HAICN) in (e) the training cohort, (f) the internal test cohort, (g) the first external test cohort, and (h) the second external test cohort based on the post-HAICN.
Comparison of the predictive accuracy of different tumor stages and nomograms
To evaluate the discrimination ability of the two nomograms, we evaluated the prognostic performance of the post-HAICN and pre-HAICN models, albumin–bilirubin (ALBI) grade, PALBI grade, and other staging systems (BCLC, Japan Society of Hepatology, American Joint Committee on Cancer, tumor-node-metastasis system, Cancer of the Liver Italian Program, Korean stage, and Hong Kong stage). The post-HAICN model yielded the best discriminatory ability, with C index values of 0.784 (95% CI: 0.773–0.795) in the training cohort, 0.773 (95% CI: 0.747–0.799) in the testing cohort, 0.816 (95% CI: 0.789–0.843) in the first external test cohort and 0.749 (95% CI: 0.724–0.774) in the second external test cohort (Table 3, Supplemental Tables 6–9). The C-index values of the pre-HAICN model were 0.690 (95% CI: 0.675–0.705) in the training cohort, 0.675 (95% CI: 0.643–0.707) in the testing cohort, 0.701 (95% CI: 0.664–0.738) in the first external test cohort, and 0.693 (95% CI: 0.666–0.720) in the second external test cohort. Its prognostic accuracy was higher (p < 0.05) than that of the other staging systems.
Prognostic performance of pre-HAIC nomogram (pre-HAICN) compared with other models and staging systems for HCC patients.
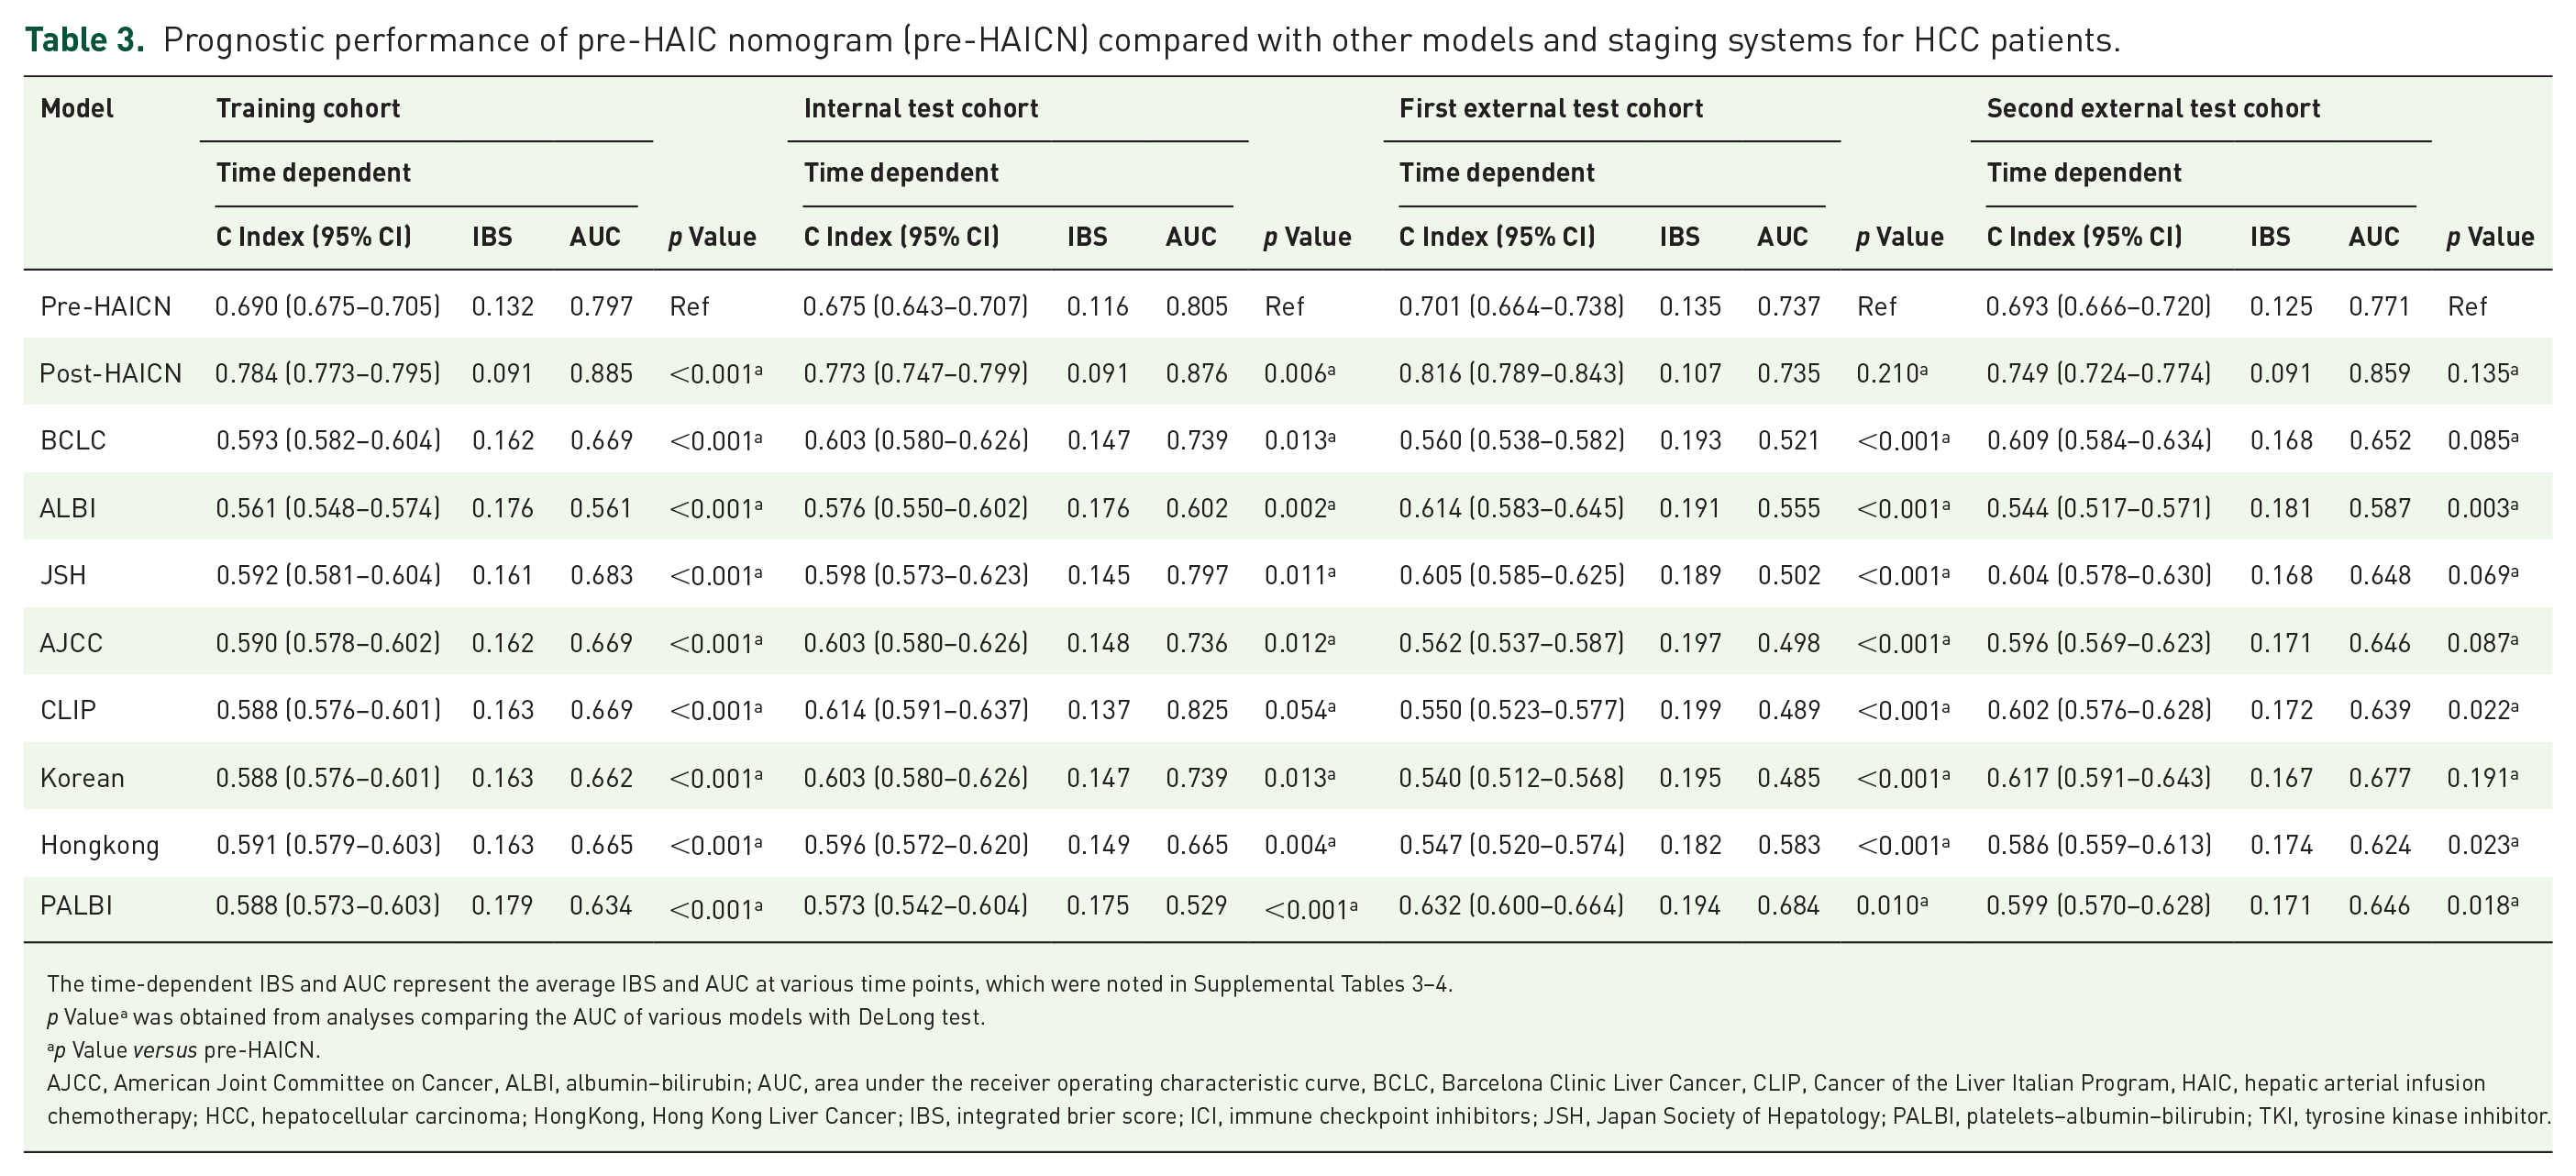
The time-dependent IBS and AUC represent the average IBS and AUC at various time points, which were noted in Supplemental Tables 3–4.
p Valuea was obtained from analyses comparing the AUC of various models with DeLong test.
p Value versus pre-HAICN.
AJCC, American Joint Committee on Cancer, ALBI, albumin–bilirubin; AUC, area under the receiver operating characteristic curve, BCLC, Barcelona Clinic Liver Cancer, CLIP, Cancer of the Liver Italian Program, HAIC, hepatic arterial infusion chemotherapy; HCC, hepatocellular carcinoma; HongKong, Hong Kong Liver Cancer; IBS, integrated brier score; ICI, immune checkpoint inhibitors; JSH, Japan Society of Hepatology; PALBI, platelets–albumin–bilirubin; TKI, tyrosine kinase inhibitor.
Subsequently, we compared the AUCs and IBSs among the post-HAICN, pre-HAICN, and other staging systems (Table 3, Supplemental Tables). We evaluated the relationship between the OS rates and the predicted probabilities in all models and staging systems. The bootstrapped calibration curves plotted with 1-, 3- and 5-year OS were well matched with the idealized 45° line for both the post-HAICN and pre-HAICN (Figure 4(a)–(h)). We found that both the post-HAICN and pre-HAICN had improved OS predictions compared with the other staging systems (Figure 4(i)–(l)). Moreover, the prediction error curves showed that both the post-HAICN and pre-HAICN had more precise prognostication of OS than the other systems in all cohorts (Figure 4(m)–(p)).

Discriminatory performance and prediction error of all models and systems in all cohorts. Calibration plots for the pre-HAIC nomogram (pre-HAICN) in predicting 1-, 3- and 5-year OS in (a) the training cohort, (b) the internal test cohort, (c) the first external test cohort, and (d) the second external test cohort. Calibration plots for the post-HAIC nomogram (post-HAICN) in predicting 1-, 3- and 5-year OS in (e) the training cohort, (f) the internal test cohort, (g) the first external test cohort, and (h) the second external test cohort. Thick dashed line: observed; solid thin line: optimism-corrected. Graphs show the ROC curves of all models and systems in predicting the OS of HCC patients in (i) the training cohort, (j) the internal test cohort, (k) the first external test cohorts, and (l) the second external test cohorts. IBS plots noted the prediction error of all models and systems in (m) the training cohort, (n) the internal test cohort, (o) the first external test cohort, and (p) the second external test cohort.
Different survival benefits of HAIC combination therapy in the high-, middle- and low-risk groups based on the nomograms
To investigate the clinical assessment of these risk level subgroups, we evaluated the role of HAIC combination therapy in the high-, middle- and low-risk subgroups based on the pre-HAICN by comparing the survival curves. The results showed that patients who underwent sequential local treatment had better OS than patients who did not in the high-risk (HR: 0.41, 95% CI: 0.27–0.64, p < 0.001), middle-risk (HR: 0.25, 95% CI: 0.15–0.41, p < 0.001) and low-risk groups (HR: 0.10, 95% CI: 0.06–0.18, p < 0.001) (Figure 5(a)–(c)). Patients treated with TKIs or ICIs after HAIC had better OS than patients treated with HAIC alone in the high-risk (HR: 0.26, 95% CI: 0.16–0.43, p < 0.001), middle-risk (HR: 0.26, 95% CI: 0.13–0.48, p < 0.001), and low-risk groups (HR: 0.20, 95% CI: 0.09–0.45, p < 0.001). In addition, patients treated with TKIs plus ICIs after HAIC showed a better prognosis than patients treated with TKIs or ICIs alone after HAIC in the high-risk (HR: 2.45, 95% CI: 1.38–4.36, p = 0.002) and middle-risk groups (HR: 1.97, 95% CI: 1.07–3.98, p < 0.001) (Figure 5(d) and (e)). This suggested that the combination of TKI and ICI would improve prognosis in HCC patients with high and middle risk. However, there was no significant difference in the OS of the low-risk group (HR: 1.05, 95% CI: 0.27–4.09, p = 0.939) (Figure 5(f)). Subsequently, we investigated the different survival benefits of HAIC sessions in HCC patients. In the high- and middle-risk groups, the number of HAIC sessions was positively related to better survival outcomes (Figure 5(g) and (h)). Patients who underwent 4–9 HAIC sessions had better survival than those who underwent 1–3 HAIC sessions. However, in the low-risk group, more HAIC sessions did not indicate meaningfully prolonged OS (Figure 5(i)).

Different survival benefits of HAIC combination therapy in different risk groups based on the pre-HAICN. Comparing the OS between HCC patients who received local treatment after HAIC and those who did not receive local treatment after HAIC in (a) the high-risk group, (b) the middle-risk group, and (c) the low-risk group based on the pre-HAICN. KM curves for the OS of HCC patients treated with TKIs or/plus ICIs after HAIC and those not treated with TKIs or ICIs after HAIC in (d) the high-risk group, (e) the middle-risk group, and (f) the low-risk group. Investigating the survival benefit of different numbers of HAIC sessions in HCC patients in (g) the high-risk group, (h) the middle-risk group, and (i) the low-risk group.
Discussion
This study developed and validated two classic prognostic models for OS prediction after initial HAIC treatment in large HCC based on a massive amount of clinical information pre- and post-HAIC from 1082 HCC patients in five high-volume institutions in China. Two external test cohorts from four hospitals were used to verify the robustness of the two models. To the best of our knowledge, our proposed nomograms are the first noninvasive method for predicting the prognosis of large HCC patients. The two prognostic models provided better prognostic prediction ability (C-index = 0.784 for post-HAICN; C-index = 0.690 for pre-HAICN; p < 0.05 for all), lower prediction error (IBS = 0.091 for post-HAICN; IBS = 0.132 for pre-HAICN), and better clinical usefulness than ALBI, PALBI, and common staging systems. They could also accurately stratify patients who underwent HAIC or HAIC combination therapy into three subgroups with significantly different cumulative long-term OS, which may potentially benefit personalized decision-making. In particular, the post-HAICN could provide reliable guidance for physicians on whether to combine TKIs and ICIs for advanced HCC, reducing the economic burden and future side effects for more patients.
The acquisition of medical information, including age, sex, etiology, and so on, is one of the fastest and most convenient channels in clinical practice. By sorting and summarizing the clinical factors related to HCC prognosis in previous literature, we obtained 32 clinical variables with complete data in this study. Given that the death outcome of the total patient cohort was 58.3%, which was over 10 times higher than the 5–9 risk factors found in multivariate analysis, this result demonstrated the robustness and accuracy of the two nomogram models in this study. Among all clinical variables, tumor number, vascular invasion, and metastasis are associated with tumor staging. These results suggested that tumor staging plays an important role in the prognostic outcome of large HCC patients treated with HAIC. Moreover, as a precise tumor marker, a high level of AFP has been reported to be closely related to HCC prognosis in a series of studies.13,22 Notably, as a new index replacing CTP grade for the assessment of liver function, PALBI removed the two subjective factors of ascites and hepatic encephalopathy of CTP and added platelets as an important index, which has been recognized by oncologists in previous studies.23,24 The PALBI grade has been a widely validated refinement of the CTP and ALBI grades. In this study, PALBI grade showed significant prognostic ability for HAIC treatment, outperforming other clinical variables.
The nomograms effectively divided HCC patients into subgroups based on different risk levels. This helped distinguish optimal candidates for HAIC. With the pre-HAICN, the high-risk group covering 33% of large HCC patients in the training cohort had a 5-year death rate of 4.9%, whereas the middle- and low-risk groups had 5-year death rates of 20.6% and 44.9%, respectively. Correspondingly, the post-HAICN also identified a high-risk group comprising large HCC patients in the training cohort with a 5-year death rate of 1.7%. Both nomograms were clinically relevant because they allowed the identification of a small but potentially manageable portion of patients who underwent HAIC at high risk of death. For patients who underwent HAIC in the high-risk group based on the pre-HAICN, we either changed the treatment scheme in advance or implemented a postoperative prevention and monitoring strategy. Although the pre-HAICN was applicable only using pretreatment clinical variables, it still significantly outperformed other indicators, such as AFP, ALBI, PALBI, and staging systems. The post-HAICN was used to identify candidates for HAIC combination therapy. Although ICIs or TKIs combined with HAIC or triple therapy have been proven to improve the survival benefit of advanced HCC, large HCC could still be heterogeneous with diverse outcomes.12,16,17 The two nomograms comprised simple, readily available clinicopathological variables, which could also help interventional radiologists identify large HCC patients with high risk who are candidates for HAIC alone or HAIC plus TKIs or ICIs.
To date, it has been reported that the risk of tumor thrombus and metastasis increases with HCC diameter. 4 In this study, more than 90% of all patients were identified as having advanced HCC. The combination of TKIs and ICIs has received increasing attention from interventional radiologists.25,26 Moreover, HAIC combined with local therapy downstaging for large HCC was also regarded as a method to improve patient survival. 20 HAIC of FOLFOX is a transhepatic arterial interventional procedure with a high degree of standardization of procedures and medication. Clinical experience showed that the number of HAIC sessions determined the odds ratio of large HCC.10–12 This was also highly related to the degree of pathological differentiation of the tumor. However, the selection and timing of comprehensive treatment strategies have always been a great challenge for interventional radiologists. Our results suggested that the combined application of HAIC plus ICIs or TKIs should be recommended for patients in the middle-risk group and strongly recommended for patients in the high-risk group. Therefore, with the post-HAICN, physicians could easily decide whether TKIs or ICIs should be applied in combination with HAIC.
Due to the high heterogeneity of large HCC, the number of HAIC sessions that generate objective responses in individualized patients are also different. Aiming at this point, we added number of HAIC sessions when establishing the post-HAICN, which provided certain guidance on the progress of the patient’s tumor and the analysis of the curative effect during HAIC treatment. Our results showed that patients who underwent 1–3 cycles of HAIC had similar OS compared with patients who underwent 4–6 or 7–9 cycles of HAIC in the low-risk group based on the post-HAICN. However, patients who underwent 1–3 cycles of HAIC showed significantly lower OS than those who underwent more sessions of HAIC in the high-risk group, which indicated that more cycles of HAIC should be performed in low-risk patients treated with HAIC.
There were several limitations in our study. First, the risk of selection bias is unavoidable in observational studies. Treatment choices were influenced by variable factors, including financial factors. The baseline characteristics were different between the HAIC group and the HAIC combination therapy group, which might affect the real outcomes in this study. Therefore, a further prospective study is needed in the future. Second, we did not collect other pathological differentiation data that could determine chemotherapy response and genomic information when building these two nomograms. The accuracy and robustness of the integrative model could be improved if these factors are added. Third, TKIs and ICIs included various targeted chemotherapeutics and immunosuppressants in our study. Although they all had antitumor angiogenesis and immune response effects, the effect on survival outcomes could still be different. Given the insufficient sample size, this study did not analyze each drug separately. We should continue exploring this topic in a follow-up study.
In conclusion, two nomograms using multiple clinical data were built to predict the survival prognosis of large HCC patients treated with HAIC. Notably, PALBI was an important risk factor before HAIC, which is worth the attention of interventional radiologists. The pre- and post-HAICN were externally tested on two cohorts to validate their robustness and effectiveness, and they showed high-level and well-received predictive ability. Therefore, our two nomograms could help physicians in decision-making before HAIC regarding comprehensive treatment in large HCC in clinical practice and future trials.
Supplemental Material
sj-doc-1-tam-10.1177_17588359231163845 – Supplemental material for Development and validation of prognostic nomograms for large hepatocellular carcinoma after HAIC
Supplemental material, sj-doc-1-tam-10.1177_17588359231163845 for Development and validation of prognostic nomograms for large hepatocellular carcinoma after HAIC by Wang Yao, Ran Wei, Jia Jia, Wang Li, Mengxuan Zuo, Shuqing Zhuo, Ge Shi, Peihong Wu and Chao An in Therapeutic Advances in Medical Oncology
Footnotes
Acknowledgements
We sincerely express our gratitude to Hui Zhu for her providing language help.
Correction (May 2023):
This article has been updated to correct the affiliation of the second author. Also, the author contribution statement has been updated to include one more author.
Declarations
Supplemental material
Supplemental material for this article is available online.
References
Supplementary Material
Please find the following supplemental material available below.
For Open Access articles published under a Creative Commons License, all supplemental material carries the same license as the article it is associated with.
For non-Open Access articles published, all supplemental material carries a non-exclusive license, and permission requests for re-use of supplemental material or any part of supplemental material shall be sent directly to the copyright owner as specified in the copyright notice associated with the article.