
Abstract
Background:
Hepatocellular carcinoma (HCC) is a highly recurrent tumor after resection and has been closely related to hypoxia. Hypoxia-inducible factors 1α and 2α (HIF-1α and HIF-2α) have been shown to contribute to tumor progression and therapy resistance in HCC. We evaluated the prognostic and clinicopathological significance of HIF-1α and HIF-2α in HCC patients.
Methods:
We systematically searched Embase, Cochrane, PubMed, Scopus and Web of Science (WOS) from inception to 1 June 2020 for studies evaluating HIF-1α and/or HIF-2α expression in HCC. Selected articles evaluate at least one factor by immunohistochemistry (IHC) in HCC patients who underwent surgical resection, and its relationship with prognosis and/or clinicopathological features. Study protocol was registered in the International Prospective Register of Systematic Reviews (PROSPERO; CDR42020191977). We meta-analyzed the data extracted or estimated according to the Parmar method employing STATA software. We evaluated the overall effect size for the hazard ratio (HR) and odds ratio (OR) with 95% confidence interval (CI), as well as heterogeneity across studies with the I2 statistic and chi-square-based Q test. Moreover, we conducted subgroup analysis when heterogeneity was substantial. Publication bias was assessed by funnel plot asymmetry and Egger’s test.
Results:
HIF-1α overexpression was correlated with overall survival (OS), disease-free survival (DFS)/recurrence-free survival (RFS) and clinicopathological features including Barcelona Clinic Liver Cancer (BCLC), capsule infiltration, intrahepatic metastasis, lymph node metastasis, tumor–node–metastasis (TNM), tumor differentiation, tumor number, tumor size (3 cm), vascular invasion and vasculogenic mimicry. We also detected a possible correlation of HIF-1α with alpha-fetoprotein (AFP), cirrhosis, histological grade, tumor size (5 cm) and albumin after subgroup analysis. Initially, only DFS/RFS appeared to be associated with HIF-2α overexpression. Subgroup analysis denoted that HIF-2α overexpression was related to OS and capsule infiltration.
Conclusions:
HIF-1α and HIF-2α overexpression is related to poor OS, DFS/RFS and some clinicopathological features of HCC patients, suggesting that both factors could be useful HCC biomarkers.
Keywords
Introduction
Hepatocarcinoma or hepatocellular carcinoma (HCC) is the main type of primary liver tumor, which currently represents the sixth most common cancer and the fourth cause of cancer-related death worldwide.1–3 HCC is frequently diagnosed in advanced stages, resulting in a high mortality rate. Moreover, despite early diagnosis allowing curative resection, the recurrence rate in these patients usually reaches up to 60%. 4 Typical biomarkers such as alpha-fetoprotein (AFP) have been shown not to have enough value to predict HCC prognosis and metastatic recurrence. 4 Recent research has focused on discovering further useful biomarkers which include serum metabolites or enzymes.5,6 Therefore, determining new effective biomarkers is necessary to predict the clinical prognosis and treatment response of HCC individuals accurately.
Hypoxia is a shared phenomenon among solid tumors, such as HCC, that plays a critical role in tumor development and progression, and is also associated with resistance to both radiation and sorafenib treatment in HCC.7,8 The cellular response to low oxygen tension is mainly mediated by the hypoxia-inducible factors (HIFs), heterodimeric transcription factors comprising a constitutively expressed subunit (HIF-β) and an oxygen-regulated subunit (HIF-1α, HIF-2α and HIF-3α). Although both factors are frequently overexpressed in HCC, HIF-1α mediates acute hypoxia whereas HIF-2α likely drives the chronic hypoxia response.8,9
HIF-1α has been reported to be overexpressed in several tumors,10–17 denoting a correlation between HIF-1α high expression and tumorigenesis, cancer progression and worse prognosis. Even though various research supports the role of HIF-1α overexpression in prompting invasion18,19 and HCC patients’ survival shortening, 19 the relationship of HIF-1α with every clinicopathological feature and prognosis in HCC still remains inconclusive. HIF-2α upregulation has also been linked to poor prognosis in diverse malignancies11,14,20–24 while, in HCC, HIF-2α has been shown to promote invasion and metastasis.25,26 However, there is a lack of documentation on the association between HIF-2α overexpression and a poorer outcome in HCC, given that existing results are controversial and inconsistent.25,26
In the present study, we conducted a systematic review with meta-analysis of the available evidence on the relationship between HIF-1α or HIF-2α expression and prognosis and clinicopathological features in HCC. Our aim was to assess the strength of this association to understand better the development and progression of HCC as well as to make better clinical decisions and to improve HCC patients’ survival further.
Methods
This analysis was conducted following the Preferred Reporting Items for Systematic Reviews and Meta-Analyses (PRISMA) guidelines (Supplemental Table 1). 27 The study protocol was previously registered in the International Prospective Register of Systematic Reviews (PROSPERO, registration number CRD42020191977).
Study objectives
We firstly aimed at evaluating the prognostic value of HIF-1α or HIF-2α expression in HCC patients who underwent surgical resection, concerning overall survival (OS) and disease-free survival (DFS)/recurrence-free survival (RFS). The second purpose was to explore the association of HIF-1α or HIF-2α expression with tumor and patient characteristics.
Search strategy
A comprehensive literature search of Embase, Cochrane, PubMed, Scopus and Web of Science (WOS) databases was performed prior to 1 June 2020. Studies eligible for this analysis were identified using the following search strategy: (“HCC” OR “hepatocarcinoma” OR “hepatocellular carcinoma”) AND (“HIF” OR “hypoxia-inducible factor”) (Supplemental Table 2).
Criteria for inclusion and exclusion
Studies meeting the following criteria were selected: (1) patients with distinctive HCC diagnosis by pathology; (2) HIF-1α or HIF-2α protein expression determined using immunohistochemistry (IHC); (3) samples obtained via surgical resection; (4) relationship between the HIF-1α or HIF-2α expression in HCC and clinicopathological features or survival information was examined; (5) appropriate statistical methodology was used; (6) articles in English.
We excluded studies complying with the following: (1) studies conducted only on cell lines or animals; (2) reviews, case reports, letters, book chapters or meeting communications; (3) tumor samples without intratumoral tissues, or just involving the paracarcinoma tissues; (4) the detection method was not IHC; (5) studies in which the required data were not provided or could not be calculated/estimated; (6) articles without English full text.
Data extraction and quality assessment
Three authors, CMB, PFP and FF independently screened the full text of selected studies to confirm eligibility, assess quality, and extract data. Discrepancies were resolved by discussion and consensus.
The baseline characteristics of each included study were extracted and are shown in Table 1.29–62 The Newcastle–Ottawa scale (NOS) score was used for assessing the quality of selected articles, which ranged from 0 to 9. 28 Studies with scores ⩾5 were regarded as high-quality studies; while low-quality studies were not included in the quantitative synthesis. Furthermore, we collected in Supplemental Table 3 the IHC antibodies and the staining procedure employed in the included articles.
Baseline characteristics of included articles.

CS, cumulative survival; DFS, disease-free survival; F, female; HIF, hypoxia-inducible factor; ICH, immunohistochemistry; M, male; NEP, no estimation possible; NR, not reported; OS, overall survival; RFS, recurrence-free survival; RT-qPCR, reverse transcription-quantitative polymerase chain reaction; TTR, time to recurrence; WB, western blot.
The sum of sections with weak and strong staining.
Nuclear staining in 10–50% of cells and/or distinct/moderate cytoplasmic staining (III or 2), and nuclear staining in >50% of cells and/or strong cytoplasmic staining (IV or 3).
The sum of cases with weak (10–25%), moderate (26–50%) and strong staining (>51%).
Final scores were assessed by the sum of the intensity (0, negative; 1, weak; and 2, strong), and the staining extent based on the percentage of positive tumor cells (0, negative; 1, 1–25%; 2, 26–50%; 3, 51–75%; and 4, 76–100%).
Final scores were assessed by the sum of the intensity (0, negative; 1, weak; 2, intermediate; 3, strong), and the extent of immunoreaction (0, 0%; 1, <5%; 2, 5–50%; and 3, >50%).
Final scores were assessed by multiplying the result of the percentage of positive cells (⩽5%, 0; –25%, 1; –50%, 2; –75%, 3; >75%, 4) by the staining intensity (colorless, 0; pale yellow, 1; deep yellow and brownish red, 2; sepia, 3).
Final scores were assessed by the sum of the cytoplasmic staining degree (0, no or negligible staining; 1, pale yellow staining; 2, brown-yellow staining; 3, brown staining) and the punctuation obtained based on the percentage of positively stained cells (0, <5%; 1, 5–25%; 2, >25–50%; and 3, >50%).
Final scores were assessed by determining the percentage of immunoreactive tumor cells (0,0%; 1, 1–25%; 2, 26–50%; 3, 51–75%; 4, 76–100%).
Final scores were assessed by the sum of the positivity extent (0, <10%; 1, <25%; 2, <50%; 3, >50%) and the staining intensity (0, no appreciable; 1, barely detectable; 2, readily visible; 3, dark brown staining).
Final scores were assessed by multiplying the positivity extent (0, <10%; 1, <25%; 2, <50%; 3, >50%) by the staining intensity (0, no appreciable; 1, barely detectable; 2, readily visible; 3, dark brown staining).
Final scores were assessed by multiplying the degree of staining (negative control, 0; light yellow, 1; tan, 2; sepia, 3) by the scoring of the positive cells proportion (⩽10%, 1; 11–50%, 2; 51–75%, 3; >75%, 4).
Final scores were assessed by multiplying the stained area (1, 1–25%; 2, 26–50%; 3, 51–75%; 4, 76–100%) by the staining intensity (0, 1, 2, or 3)
More than 65% of cells were stained intensely (+++) or moderately (++) or weakly (+).
Final scores were assessed by multiplying the results of the percentage (0, <10%; 1, 10–30%; 2, 31–60%; 3, >61%) and the intensity (0, lack of any immunoreactivity; 1, light yellow; 2, yellow-brown; and 3, brown) of immune-staining cells.
Statistical analysis
STATA software version 16 (Stata Corporation, College Station, TX, USA) was employed to assess the correlation between HIF-1α or HIF-2α expression and prognosis and clinicopathological features in HCC.
We measured the effect of HIF expression on HCC in two steps. Firstly, we pooled the OS, DFS, RFS and time to recurrence (TTR) by hazard ratio (HR) and 95% confidence interval (CI) to calculate the effective value to assess the correlation between each HIF and HCC prognosis. OS was measured from the intervention date until either the day of death or the last follow-up visit. DFS, RFS and TTR were defined as the period from the intervention date to the date of last follow-up or recurrence. HR and the corresponding 95% CI were combined across studies. The Parmar method 63 was used to extract data when no direct information could be obtained from the primary study. Secondly, the strength of association between HIF-1α or HIF-2α overexpression and tumor clinicopathological features was evaluated by estimating the odds ratio (OR) with 95% CI. Combined HR >1 and OR >1 suggested a higher risk of poor survival and a higher incidence of the analyzed feature, respectively, related to HIF overexpression. These relationships were significant when p < 0.05.
Heterogeneity was tested using the chi-square-based Q test, showing significant levels when the p-value was < 0.1. The I 2 statistic, a quantitative measure of inconsistency across studies, was also calculated. The I 2 varies from 0% (no observed heterogeneity) to 100% (maximal heterogeneity). I 2 ⩾ 50% was considered to represent substantial heterogeneity. The restricted maximum likelihood (REML) method as the random-effect model was employed when heterogeneity was confirmed by at least one statistical method. Otherwise, the fixed-effects model with inverse variance (IV) method was used. To explore the heterogeneity sources, we conducted subgroup analyses based on sample size, NOS score, follow-up and median age.
We assessed the possibility of publication bias by evaluating funnel plot asymmetry and Egger’s test. When Egger’s p-value was < 0.05 and the funnel plot was asymmetric, significant publication bias existed. In this case, the trim-and-fill method was used to estimate a corrected effect size after adjustment, which helped to determine whether the publication bias substantially affected the robustness of the pooled results.
Results
Study characteristics
A total of 3888 applicable studies were identified after the database search, 2172 studies were duplicates, and after scanning titles and abstracts another 1386 articles were omitted for the following reasons: animal or cells studies, non-HCC or HIF articles, reviews or similar. The full text of 330 articles was assessed for eligibility, finding 24 with full text in Chinese, 264 without HIF IHC or analysis about survival or clinicopathological features, seven did not employ surgical resection and one was about HIF-3α. Thus, these 296 papers were also excluded from our study. After screening, 34 studies29–62 were assessed for quality and data extraction. Cao et al. 62 and Zhou et al. 54 did not provide enough data to calculate HR and its 95% CI. Moreover, Zhou et al. 54 did not reach the quality threshold (Table 1). Eventually, 32 publications were eligible for quantitative meta-analysis: 25 on HIF-1α, six on HIF-2α and one about both factors (Figure 1).

PRISMA flowchart of study selection.
The baseline of included articles and results of quality assessment are summarized in Table 1. These studies were published from 2004 to 2020 and a total of 3578 (eight were ‘missing’ in HIF-1α expression analysis) and 1213 HCC patients consisted of HIF-1α and HIF-2α, respectively. All included patients came from Asia, mostly from China. For HIF-1α, patients’ number across studies ranged from 35 to 419, and 1846 (51.7%) had HIF-1α overexpression. From 84 to 315 patients by study were enrolled to HIF-2α analysis, 553 (45.6%) showed HIF-2α overexpression. Among the 25 HIF-1α articles, 18 provided data on OS, eight on DFS/RFS and 23 on clinicopathological features; while for HIF-2α, five of seven articles supplied OS, three DFS/RFS and all of them clinicopathological features. Five HIF-1α studies evaluated TTR; nonetheless, only one article reported the HR and estimation was not possible according to the Parmar method. Hence, TTR analysis was not included.
Patients in all studies underwent surgical resection. In Wada et al. 30 and Dai et al. 32 some of the enrolled patients received preoperative antitumor therapy. Moreover, patients undergoing external beam radiotherapy had postoperative adjuvant treatment in Xiang et al. 37 The rest of the included studies had no intervention prior to surgery. Regarding etiology, within the 32 papers included 21 evaluated patients with hepatitis B,29–31,33–39,41,43,44,46,50–52,57–59,61 nine assessed patients with hepatitis C,30,34.36,41,43,44,57–59 and only one alcoholic patient was assessed; 44 it should be noted that all the studies were performed in the Asiatic population, where hepatitis B is the key etiology factor. Likewise, 20 articles evaluated HCC patients derived from cirrhosis.29–34,36,39,41,43,44,46,48,50–52,56–59 In summary, we extracted these data and among the patients included in the present meta-analysis, 78.2% had hepatitis B, 6.6% had hepatitis C and 66.1% had cirrhosis.
Association of HIF protein expression with prognosis
Based on the meta-analysis, we evaluated the prognostic value of HIF-1α and found that high expression correlated with OS (HR 1.73; 95% CI 1.54–1.94; p = 0.00) and with DFS/RFS (HR 1.64; 95% CI 1.36–1.99; p = 0.00), not finding significant heterogeneity (Figure 2A).
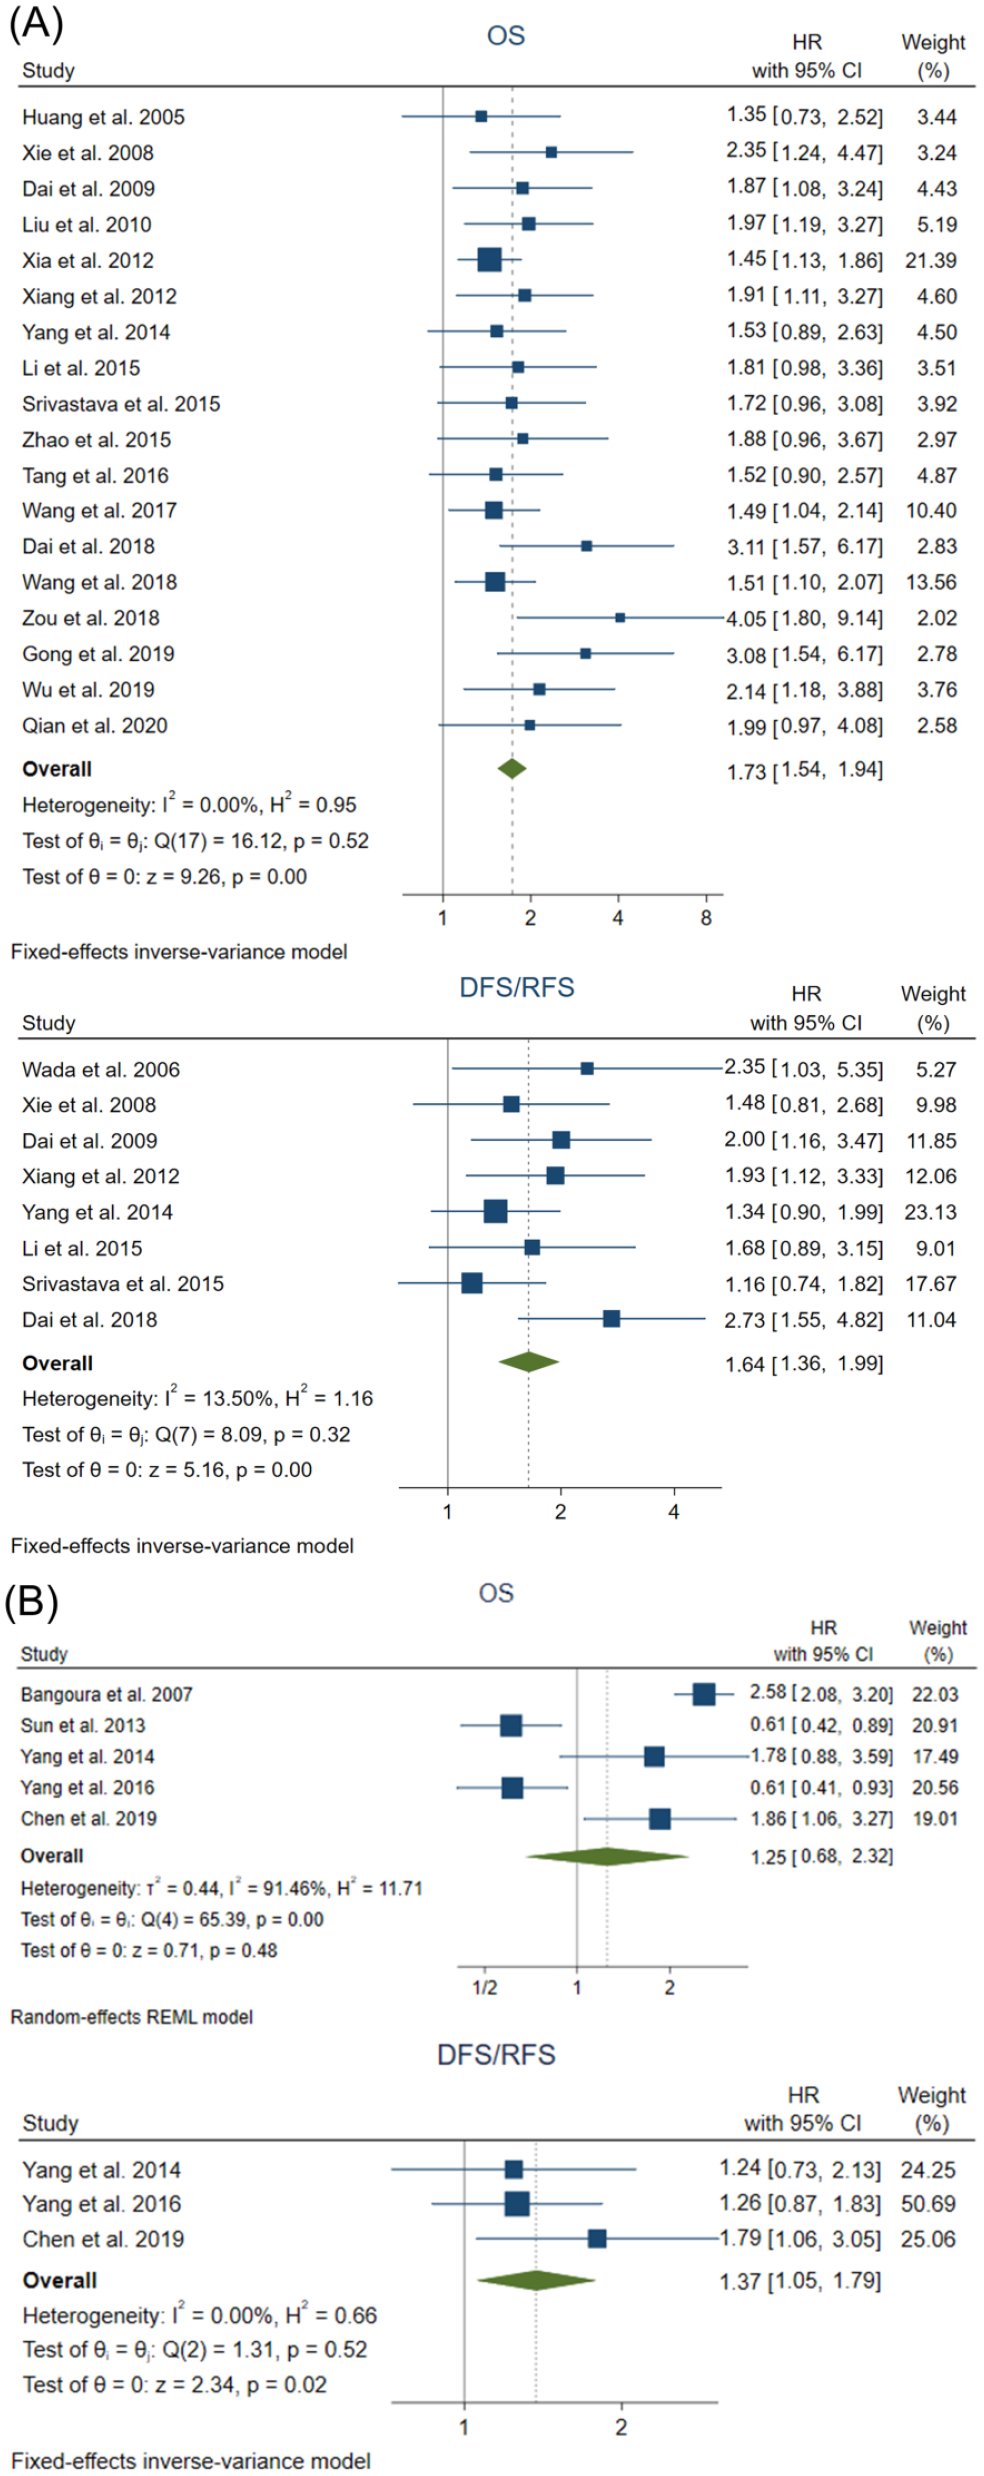
Meta-analysis of the prognostic value of HIF-1α and HIF-2α in HCC patients. Forest plot of OS and DFS/RFS for (A) HIF-1α and (B) HIF-2α.
We also assessed the correlation between HIF-2α protein levels and prognosis. The results suggest that there is no significant association between HIF-2α high expression and OS in HCC patients (HR 1.25; 95% CI 0.68–2.32; p = 0.48), assuming heterogeneity among studies. However, HIF-2α overexpression appears to be associated with DFS/RFS (HR 1.37; 95% CI 1.05–1.79; p = 0.02), and no heterogeneity was shown (Figure 2B).
Association of HIF protein expression with clinicopathological features
Otherwise, we evaluated the possible correlation between HIF expression and different clinicopathological features of HCC patients.
High HIF-1α protein levels were positively associated with Barcelona Clinic Liver Cancer (BCLC) staging (OR 2.49; 95% CI 1.56-3.98; p = 0.00), capsule infiltration (OR 2.48; 95% CI 1.29–4.77; p = 0.01), intrahepatic metastasis (OR 2.90; 95% CI 1.62–5.20; p = 0.00), lymph node metastasis (OR 3.74; 95% CI 1.73–8.07; p = 0.00), tumor–node–metastasis (TNM) classification (I, II–III) (OR 1.59; 95% CI 1.21–2.09; p = 0.00), TNM (I-II, III) (OR 2.62; 95% CI 1.69–4.08; p = 0.00), TNM (I–II, III–IV) (OR 2.23; 95% CI 1.37–3.64; p = 0.00), tumor differentiation (OR 1.78; 95% CI 1.07–2.96; p = 0.03), tumor number (OR 1.50; 95% CI 1.15–1.96; p = 0.00), tumor size (3 cm) (OR 3.70; 95% CI 1.29–10.63; p = 0.02), vascular invasion (OR 2.61; 95% CI 1.82–3.75; p = 0.00) and vasculogenic mimicry (OR 2.61; 95% CI 1.67–4.09; p = 0.00) (Figure 3). We also found that there is no statistical significance with other tumor features, including AFP levels (20 ng/ml) (OR 1.39; 95% CI 0.92–2.09; p = 0.11), AFP (400 ng/ml) (OR 1.49; 95% CI 0.67–3.33; p = 0.33), age (50 years) (OR 0.86; 95% CI 0.57–1.31; p = 0.49), age (60 years) (OR 1.03; 95% CI 0.68–1.55; p = 0.90), albumin (35 U/L) (OR 0.60; 95% CI 0.26–1.38; p = 0.23), alanine aminotransferase (ALT) (40 U/L) (OR 0.86; 95% CI 0.60–1.24; p = 0.42), ALT (80 U/L) (OR 1.04; 95% CI 0.67–1.62; p = 0.86), bilirubin (1 μmol/L) (OR 1.65; 95% CI 1.00–2.73; p = 0.0501), capsule formation (OR 0.89; 95% CI 0.69–1.13; p = 0.33), Child–Pugh score (OR 1.52; 95% CI 0.91–2.53; p = 0.11), cirrhosis (OR 1.32; 95% CI 0.97–1.80; p = 0.08), distant metastasis (OR 6.14; 95% CI 0.83–45.48; p = 0.08), Edmondson grading (OR 1.35; 95% CI 0.83–2.20; p = 0.22), gender (OR 0.93; 95% CI 0.77–1.14; p = 0.51), hepatitis B (OR 0.99; 95% CI 0.82–1.21; p = 0.96), hepatitis C (OR 1.25; 95% CI 0.72–2.16; p = 0.42), histological grade (OR 1.54; 95% CI 0.70–3.40; p = 0.28) and tumor size (5 cm) (OR 1.40; 95% CI 0.88–2.22; p = 0.16) (Figure 4).

Forest plot of the clinicopathological features significantly associated with HIF-1α overexpression in HCC patients.

Forest plot of the clinicopathological features not significantly associated with HIF-1α overexpression in HCC patients.
All HIF-2α studies were included in the analysis of clinical and pathological features. Positive HIF-2α expression was not significantly associated with any feature analyzed: AFP levels (400 ng/ml) (OR 0.88; 95% CI 0.60–1.30; p = 0.52), age (50 years) (OR 1.17; 95% CI 0.79–1.73; p = 0.44), capsule formation (OR 1.31; 95% CI 0.93–1.83; p = 0.12), capsule infiltration (OR 1.82; 95% CI 0.54–6.13; p = 0.33), cirrhosis (OR 1.22; 95% CI 0.91–1.64; p = 0.19), Edmondson grading (OR 11.05; 95% CI 0.02–6167.72; p = 0.46), gender (OR 0.95; 95% CI 0.68–1.35; p = 0.79), hepatitis B (OR 1.03; 95% CI 0.76–1.39; p = 0.86), histological grade (OR 0.93; 95% CI 0.43–1.99; p = 0.85), necrosis (OR 1.32; 95% CI 0.25–6.98; p = 0.74), TNM (I–II, III–IV) (OR 1.12; 95% CI 0.40–3.10; p = 0.83) tumor number (OR 1.44; 95% CI 0.92–2.27; p = 0.11), tumor size (5 cm) (OR 1.20; 95% CI 0.36–3.99; p = 0.77) and vascular invasion (OR 1.16; 95% CI 0.67–2.00; p = 0.60) (Figure 5).
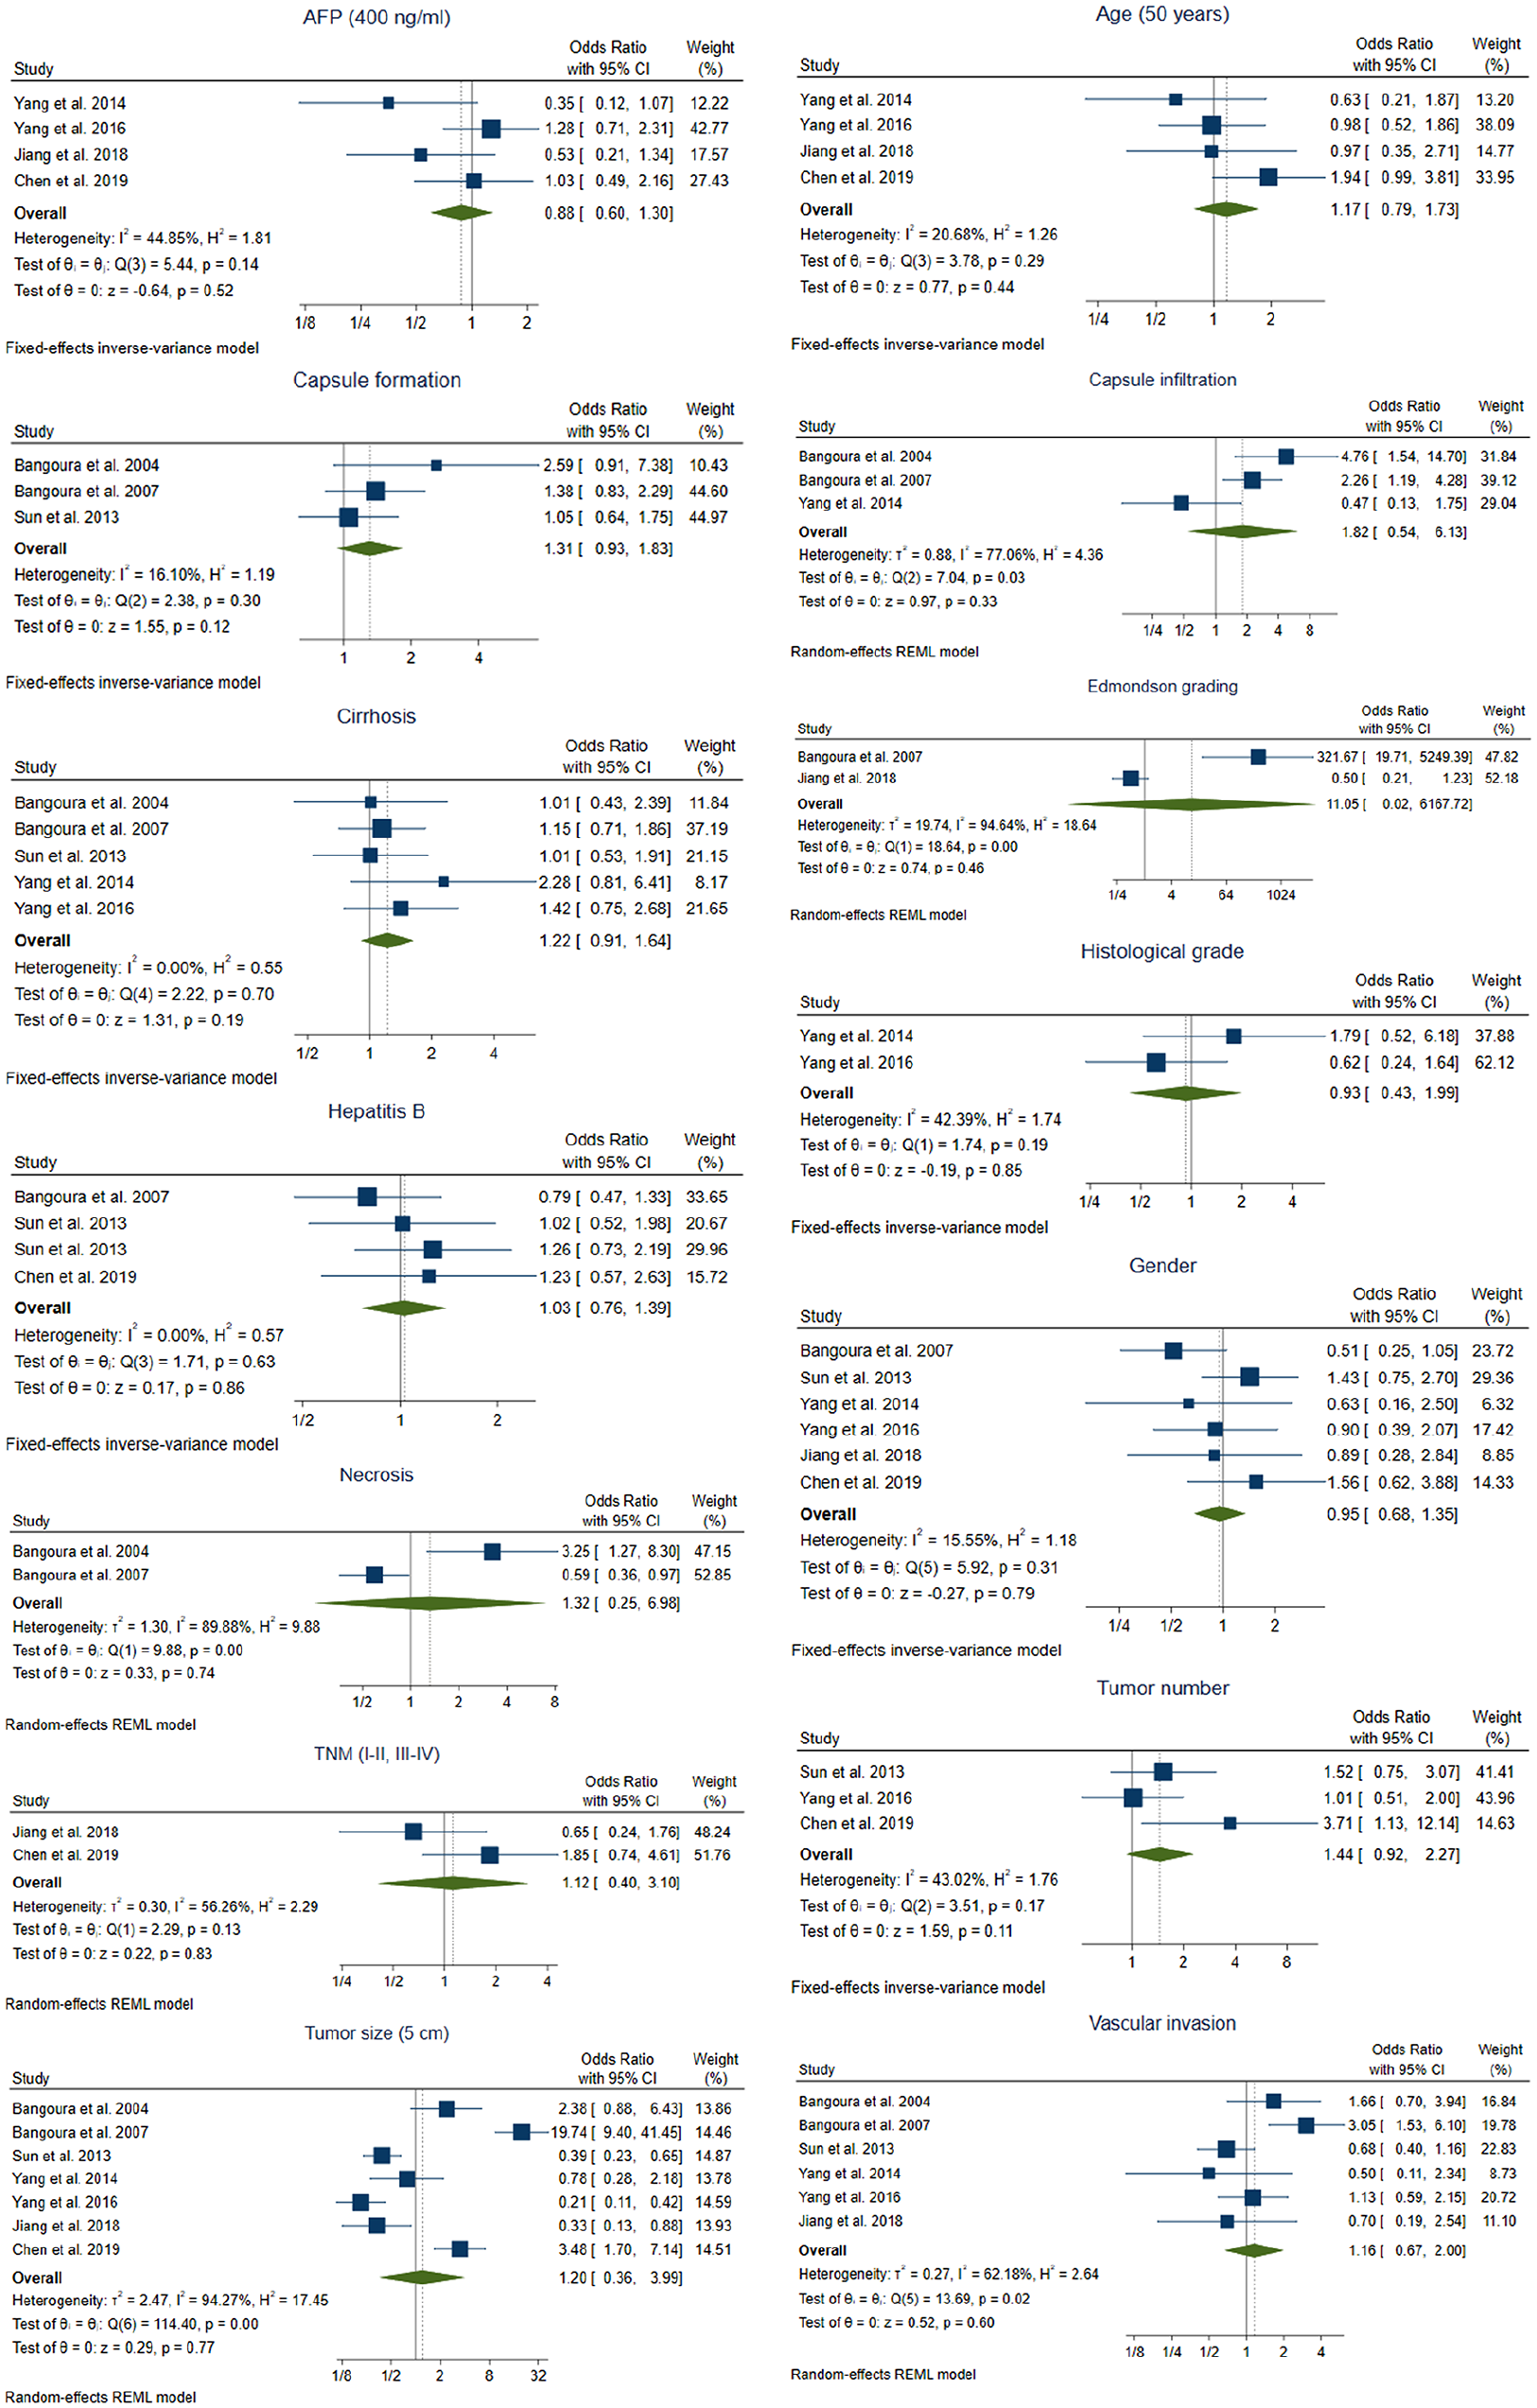
Forest plot of the association between HIF-2α overexpression and clinicopathological features in HCC patients.
Subgroup analysis
To explore the potential heterogeneity sources, subgroup analysis for heterogeneity parameters was performed.
When subgroups for HIF-1α were based on sample size, HIF-1α expression was related to AFP levels (20 ng/ml) (n ⩾ 100: OR 1.59; 95% CI 1.03–2.46; p = 0.04), cirrhosis (n < 300: OR 1.48; 95% CI 1.06–2.07; p = 0.02), tumor size (5 cm) (n ⩾ 200: OR 1.46; 95% CI 1.04–2.06; p = 0.03) and vascular invasion (n ⩾ 100: OR 2.39; 95% CI 1.58–3.61; p = 0.00) (n < 100: OR 3.22; 95% CI 1.87–5.55; p = 0.00) (n ⩾ 200: OR 1.32; 95% CI 1.04–1.68; p = 0.02) (n < 200: OR 3.54; 95% CI 2.69–4.66; p = 0.00) (n ⩾ 300: OR 1.39; 95% CI 1.08–1.79; p = 0.01) (n < 300: OR 3.22; 95% CI 2.13–4.88; p = 0.00) (n < 400: OR 3.04; 95% CI 2.08–4.45; p = 0.00); nonetheless, heterogeneity continued to be substantial in some cases. Sample size subgroups provided assumable heterogeneity for AFP levels (20 ng/ml) (n < 100, n ⩾ 200/300), age (50 years) (n ⩾ 100, n < 200), albumin (n ⩾ 100), cirrhosis (n < 100), tumor size (5 cm) (n < 100, n⩾300) and vascular invasion (n < 100, n ⩾ 200, n < 200, n ⩾ 300, n ⩾ 400). NOS score subgroups displayed an association between HIF-1α overexpression and albumin (n < 7: OR 0.45; 95% CI 0.21–0.93; p = 0.03), tumor differentiation (n ⩾ 6: OR 1.76; 95% CI 1.04–2.97; p = 0.04), tumor size (5 cm) (n = 6: OR 2.27; 95% CI 1.10–4.70; p = 0.03) (n < 7: OR 2.45; 95% CI 1.20–4.99; p = 0.01) and vascular invasion (n ⩾ 7: OR 1.99; 95% CI 1.36–2.90; p = 0.00) (n < 7: OR 4.00; 95% CI 2.14–7.46; p = 0.00), where only albumin subgroup presented low heterogeneity (n < 7). In addition, NOS classification resolved heterogeneity for AFP (20 ng/ml) (n ⩾ 7), AFP (400 ng/ml) (n ⩾ 7), age (50 years) (n ⩾ 7), cirrhosis (n ⩾ 7) and histological grade (n ⩾ 7), but not showing association with protein expression. Curiously, the single elimination of Zou et al. 51 in AFP (20 ng/ml), and Xia et al. 36 and Tian et al. 49 in tumor differentiation led to an assumable heterogeneity, although there was no correlation with HIF-1α overexpression. However, the deletion of Xiang et al. 34 and Ma et al. 39 for cirrhosis, and Wang et al. 40 for histological grade, achieved low heterogeneity and a significant association with HIF-1α (Table 2).
Subgroup analysis of prognostic and clinicopathological features of HIF-1α and HIF-2α.

AFP, alpha-fetoprotein; CI, confidence interval; FEM, fixed-effects model; HIF, hypoxia-inducible factor; HR, hazard ratio; NOS, Newcastle–Ottawa scale; OR, odds ratio; REM, random-effects model.
For HIF-2α, when subgroups were based on sample size, HIF-2α expression was linked to OS (n < 200: HR 1.83; 95% CI 1.18–2.84; p = 0.01), where heterogeneity was solved. Moreover, heterogeneity was eliminated from vascular invasion (n < 100, n < 200, n < 300), but no association was found. The follow-up subgroup showed a relationship between OS and HIF-2α overexpression (follow-up ⩾72: HR 2.47; 95% CI 2.02–3.03; p = 0.00) with reduced heterogeneity. Capsule infiltration was analyzed according to median age, displaying correlation to HIF-2α (years ⩾ 50: OR 2.71; 95% CI 1.55–4.73; p = 0.00) and low heterogeneity. Subgroup classification by NOS did not exhibit any change. Thus, tumor size heterogeneity could not be resolved (Table 2).
Subgroups with only one study were not considered. The results of subgroup analysis revealed that sample size, NOS score, median age and follow-up time likely triggered heterogeneity.
Publication bias
There was pronounced asymmetry denoting publication bias on the OS parameter for HIF-1α that was confirmed by Egger’s test (p = 0.0027). Hence, the trim-and-fill method was used, in which seven studies were imputed and the global effect size was corrected (HR 1.559; 95% CI 1.405–1.731). Instead, there was no asymmetry detected for DFS/RFS (p = 0.0631) (Table 3; Figure 6A). Concerning the clinicopathological features of HIF-1α, asymmetry was only identified in gender (p = 0.0255), tumor differentiation (p = 0.0428) and vascular invasion (p = 0.0016). In gender, trim-and-fill estimated the new global effect (OR 0.827; 95% CI 0.687–0.997) and imputed five studies. Likewise, six ‘missing’ studies were included in the vascular invasion funnel plot, adjusting effect size (OR 1.749; 95% CI 1.121–2.729). Conversely, trim-and-fill analysis did not report any ‘missing’ study for tumor differentiation. All imputed studies for HIF-1α parameters were on the left side of the funnel plot (Table 3; Figure 7).
Assessment of publication bias on prognostic and clinicopathological features of HIF-1α and HIF-2α.

AFP, alpha-fetoprotein; ALT, alanine aminotransferase; BCLC, Barcelona Clinic Liver Cancer; CI, confidence interval; DFS, disease-free survival; FEM, fixed-effects model; HIF, hypoxia-inducible factor; HR, hazard ratio; OR, odds ratio; OS, overall survival; REM, random-effects model; RFS, recurrence-free survival; TNM, tumor–node–metastasis.
p-value <0.05.
Convergence not achieved during tau2 estimation.

Publication bias analysis of the prognostic value of HIF-1α and HIF-2α. Funnel plot of OS and DFS/RFS for (A) HIF-1α with trim-and-fill funnel plot for OS, and (B) HIF-2α.

Publication bias analysis of the association between HIF-1α overexpression and clinicopathological features by funnel plot asymmetry. For gender, tumor differentiation and vascular invasion the trim-and-fill funnel plot is also represented.
Conversely, there was no asymmetry evidence on OS (p = 0.9273) and DFS/RFS (p = 0.5480) for HIF-2α (Table 3; Figure 6B). Concerning the clinicopathological features, only AFP levels (p = 0.0213) presented asymmetry, where the trim-and-fill method imputed one study on the right side of the funnel plot and corrected the global effect (OR 1.001; 95% CI 0.694–1.444) (Table 3; Figure 8).

Publication bias analysis of the association between HIF-2α overexpression and clinicopathological features by funnel plot asymmetry. For AFP (400 ng/ml) the trim-and-fill funnel plot is also represented.
Discussion
Hypoxia is a common microenvironment characteristic of solid tumors, such as HCC, which arises as consequence of defective vascularization and intense metabolic activity. 8 Despite HCC being characterized by being one of the most hyper-vascularized tumors, hypoxic regions are frequently present in HCC due to rapid proliferation of tumor cells and the formation of aberrant blood vessels.19,26 Although a reduction in oxygen supply is initially harmful for cell survival, some tumor cells adapt to the hypoxic microenvironment by decreasing energy consumption and enhancing anaerobic metabolism. 25 This adaptive response is mainly accomplished by HIFs, which entails a set of pro-survival changes implicated in aggressive tumor progression, therapy resistance, selection of more invasive clones and poor clinical outcomes. 8
Due to difficult detection and the high recurrence rate of early HCC, 4 discerning the risk of recurrence and mortality in HCC patients is key to guide surveillance and determine possible adjuvant therapies. Thus, in this study we evaluated the main hypoxia response mediators, HIF-1α and HIF-2α, as potential clinical biomarkers for predicting HCC prognosis. To investigate the relationship between HIF protein expression and HCC, the present meta-analysis aimed to examine the association between HIF-1α or HIF-2α overexpression and the prognosis and clinicopathological features of HCC patients.
A total of 26 high-quality studies (3570 patients) were included for HIF-1α analysis. Pooled results showed that overexpression of HIF-1α leads to poor OS and DFS/RFS in HCC. Previous studies conducted by Zheng et al. 19 and Cao et al., 18 which enrolled seven and eight articles, respectively, evaluated HIF-1α expression in HCC. According to our results, both studies showed association between high HIF-1α levels and DFS, and Zheng et al. 19 also reported correlation with OS.
Various research performed in lung cancer, 10 renal cell carcinoma, 11 pancreatic cancer, 64 esophageal cancer, 12 gastric tumors, 13 colorectal cancer, 14 head and neck cancer, 15 oral squamous cell carcinoma, 16 bone tumors, 17 breast cancer, 65 endometrial cancer, 66 and epithelial ovarian cancer, 67 also revealed a significant correlation between HIF-1α overexpression and poor prognosis. Moreover, HIF-1α expression has been associated with worse prognosis in advanced cancer patients treated with chemotherapy and/or radiotherapy; thus, in addition to a useful biomarker, targeting HIF-1α could be an interesting therapeutic approach to improve survival in advanced cancer patients. 68
Here, significant results were observed in some clinicopathological features, including BCLC staging, capsule infiltration, intrahepatic metastasis, lymph node metastasis, TNM classification, tumor differentiation, tumor number, tumor size (contrasting greater or less than 3 cm), vascular invasion and vasculogenic mimicry. After subgroup analysis according to sample size and NOS score, we also observed a possible HIF-1α correlation with AFP levels, cirrhosis, tumor size (5 cm) and albumin, while histological grade showed association after removing one study.
The two previous meta-analyses18,19 found a correlation with vascular invasion, and Cao et al. 18 reported no significant association with capsule formation, cirrhosis, tumor differentiation or tumor size. Nevertheless, differences could be explained by the lower number of studies included in such meta-analyses and the absence of subgroup analyses.18,19
Meanwhile, seven high-quality articles (1213 patients) were employed to analyze HIF-2α. Initially, only DFS/RFS appeared to be associated with HIF-2α expression; nonetheless, subgroup analysis denoted that HIF-2α overexpression is also markedly related to OS when grouped by sample size and follow-up time.
A meta-analysis by Yao et al. 26 and another by Luo et al. 25 evaluated HIF-2α in HCC and multiple types of cancer, respectively. Luo et al. 25 found a relation between OS and HIF-2α with multivariate but not with univariate analysis. Likewise, this meta-analysis reported that HIF-2α overexpression results in poor OS in additional tumors including lung or colorectal cancers, among others. 25 In contrast, Yao et al. 26 did not observe significant correlation among OS and this transcription factor, which can be explained based on the fact that our work included most recent articles and excluded those with full text in Chinese. 26 No previous study has evaluated the impact on DFS or RFS.
Other research has observed the association between HIF-2α overexpression and a worse prognosis in further tumors such as lung cancer, 21 renal cell carcinoma, 11 gastric cancer, 23 colorectal cancer,14,24 oral squamous cell carcinoma 22 or head and neck cancer. 20
In addition, concerning the clinicopathological parameters, only capsule infiltration was related to HIF-2α high levels when the median age is ⩾50 years. This result agrees with Yao et al., 26 but they also found an association with vein invasion and histological grade. Besides, both that meta-analysis and ours observed no correlation of HIF-2α with cirrhosis, necrosis and tumor size. 26
Hypoxia is the principal physiological stimulus inducing angiogenesis in HCC through the upregulation of angiogenic factors. Vascular endothelial growth factor (VEGF) is crucial for blood vessel formation by promoting the growth and migration of endothelial cells, and it is transcriptionally regulated by both HIFs. 69 Some studies included in this meta-analysis showed that high VEGF levels were associated with angiogenesis, microvessel density, vasculogenic mimicry and poor prognosis; having a positive correlation between VEGF and HIF-1α.29,30,34,44,45 Other angiogenic factors have also been linked to HIF regulation and have been described to be involved in angiogenesis in HCC, such as angiopoietin-2, 30 HIF-1α targets bone morphogenetic protein 4 (BMP4), while HIF-2α targets stem cell factor (SCF) and plasminogen activator inhibitor-1 (PAI-1), and both HIFs target erythropoietin and platelet-derived growth factor (PDGF) expression. 69 Consequently, hypoxia, and more specifically HIFs, contribute to angiogenesis in HCC and could be related to the results obtained in this meta-analysis associating high HIF-1α expression with increased vascular invasion and vasculogenic mimicry.
Furthermore, epithelial to mesenchymal transition and metastasis can be induced under hypoxia in HCC cells. 69 Several studies have described that the increase in invasion and worse prognosis in HCC patients could be related to the expression of invasion-related proteins such as metalloproteinases, interleukin-8 (IL-8) or E-cadherin.32,34,40,43,44 In preclinical studies similar results were also found, associating high invasion and metastasis with the HIF-1α targets SNAIL-1, granulocyte chemotactic protein-2 (CXCL6), IL-8 and Rab11-family interacting protein 4 (Rab11-FIP4); and the HIF-2α targets SERPINB3, CUB domain-containing protein 1 (CDCP1) and SCF.69–71 These findings can explain the relationship between both HIFs and the clinicopathological factors related to metastasis, such as intrahepatic or lymph node metastasis and capsule infiltration.
This meta-analysis is a highly comprehensive study performing a detailed quantitative analysis of clinical evidence on HIF-1α and HIF-2α correlation with prognostic variables such as OS and DFS/RFS and with clinicopathological features in HCC patients who underwent surgical resection. Moreover, this work includes an assessment of heterogeneity, subgroup analysis and publication bias. Hence, this is the first meta-analysis analyzing both main hypoxia-inducible factors. Previous meta-analyses evaluating the relationship between HIF-1α or HIF-2α expression and tumor outcome, which were included in the discussion of our results, were performed prior to 2015 and, thus, comprised a lower number of studies and evaluated fewer parameters. Moreover, some studies did not assess publication bias and/or subgroup analysis.
Even though in the present meta-analysis we exhaustively evaluated the association between both HIFs and tumor outcome, some limitations should be acknowledged. Despite full-text articles being obtained, those written in Chinese were excluded and, therefore, likely relevant data. Data extraction was not always possible because of the absence of required variables for the estimation, such as patient follow-up or patient numbers in each group. Furthermore, studies included employed diverse or unspecified antibodies for HIF detection, with miscellaneous or insufficient staining procedure description and different cut-off values for IHC scores of HIFs, which could lead to higher heterogeneity. All the articles included were performed with an Asiatic population, mainly from China, where hepatitis B is the key etiology factor. 1 In accordance with this, most of the articles evaluated the number of patients with hepatitis B or C; however, there are no available studies enrolling populations from other origins, such as western countries where etiological factors such as obesity or non-alcoholic fatty liver disease (NAFLD) prevail. 1 The research volume in HIF-2α analysis was low due to the low number of studies found in the literature; then, more high-quality articles would be needed. Besides, some variables were not collected uniformly between studies, hindering the assessment of established aims and the potential sources of heterogeneity. Finally, publication bias was denoted in some parameters.
In summary, HIF overexpression is linked to a more aggressive behavior of HCC. In this meta-analysis, 51.7% and 45.6% of patients displayed HIF-1α and HIF-2α overexpression, respectively. HIF-1α and HIF-2α seem to act as negative prognosis markers, being linked to poor OS, DFS, RFS and some clinicopathological features of HCC patients. This evidence suggests that both HIFs are useful biomarkers for predicting HCC prognosis that may improve clinical decisions, especially when combined with other prognostic-related markers. These results have been represented graphically in Figure 9.

Graphical abstract.
Supplemental Material
sj-pdf-1-tam-10.1177_1758835920987071 – Supplemental material for Prognostic and clinicopathological significance of hypoxia-inducible factors 1α and 2α in hepatocellular carcinoma: a systematic review with meta-analysis
Supplemental material, sj-pdf-1-tam-10.1177_1758835920987071 for Prognostic and clinicopathological significance of hypoxia-inducible factors 1α and 2α in hepatocellular carcinoma: a systematic review with meta-analysis by Carolina Méndez-Blanco, Paula Fernández-Palanca, Flavia Fondevila, Javier González-Gallego and José L. Mauriz in Therapeutic Advances in Medical Oncology
Footnotes
Acknowledgements
CMB is supported by the Asociación Española Contra el Cáncer (AECC)-Junta Provincial de León. PFP and FF are supported by the Ministry of Education of Spain (FPU17/01995 and FPU16/05277 grants). CIBERehd is funded by Instituto de Salud Carlos III, Spain.
Author contributions
All authors were responsible for study conception and design, interpretation of the data and drafting of the manuscript. Systematic literature review, data extraction and data analysis were performed by CMB, PFP and FF. Moreover, JGG and JLM carried out the study supervision. The final version of the manuscript was approved by all authors.
Conflict of interest statement
The authors declare that there is no conflict of interest.
Funding
The authors received no financial support for the research, authorship, and/or publication of this article.
Supplemental material
Supplemental material for this article is available online.
References
Supplementary Material
Please find the following supplemental material available below.
For Open Access articles published under a Creative Commons License, all supplemental material carries the same license as the article it is associated with.
For non-Open Access articles published, all supplemental material carries a non-exclusive license, and permission requests for re-use of supplemental material or any part of supplemental material shall be sent directly to the copyright owner as specified in the copyright notice associated with the article.