
Abstract
Background:
Ataxia-telangiectasia and Rad3 related protein kinase (ATR) is an essential regulator of the DNA damage response in various cancers; however, its expression and roles in osteosarcoma are unclear. We therefore chose to evaluate the significance and mechanism of ATR in metastatic osteosarcoma, as well as its potential to be a therapeutic target.
Methods:
The osteosarcoma tissue microarrays constructed from 70 patient specimens underwent immunohistochemistry to quantify ATR and activated phospho-ATR (pATR) expression and their correlation with clinical outcomes. ATR sublocalization within the metastatic osteosarcoma cells was confirmed by immunofluorescence assay. Cell proliferation, apoptosis, and migration were evaluated following treatment with ATR siRNA or the selective inhibitor Berzosertib. Antitumor effects were determined with ex vivo three-dimensional (3D) culture models, and the impacts on the DNA damage repair pathways were measured with Western blotting.
Results:
Elevated ATR and activated pATR expression correlated with shorter patient survival and less necrosis following neoadjuvant chemotherapy. Intranuclear sublocalization of ATR and pATR suggested a mechanism related to DNA replication. ATR knockdown with siRNA or inhibition with Berzosertib suppressed cell proliferation in a time- and dose-dependent manner and induced apoptosis. In addition, ATR inhibition decreased Chk1 phosphorylation while increasing γH2AX expression and PARP cleavage, consistent with the interference of DNA damage repair. The ATR inhibitor Berzosertib also produced the characteristic cytoplasmic vacuolization preceding cell death, and suppressed ex vivo 3D spheroid formation and cell motility.
Conclusion:
The faithful dependence of cells on ATR signaling for survival and progression makes it an emerging therapeutic target in metastatic osteosarcoma.
Keywords
Highlights
ATR is overexpressed in human osteosarcoma and correlates with patient clinicopathology and prognosis.
ATR regulates DNA damage repair through the Chk1-dependent pathway and actively promotes osteosarcoma cell growth, proliferation, migration, and spheroid formation.
The suppression of ATR by its selective inhibitor Berzosertib results in characteristic cytoplasmic vacuolization and following cell death of osteosarcoma.
ATR is an emerging prognostic biomarker and therapeutic target in osteosarcoma.
Implication
This study identifies ATR signaling as a promising target involved in osteosarcoma-related metastatic activation.
Introduction
Osteosarcoma is the most common primary bone malignancy and causes significant mortality due to high rates of pulmonary metastasis. It has a bimodal age distribution, affecting children and adolescents as well as those in late adulthood. 1 Historically, major progress was made for osteosarcoma patients when surgical resection was combined with multiagent chemotherapy, improving the 5-year survival rate from less than 30% to nearly 70%. 2 However, there has since been a scarcity of emerging therapies, and outcomes for osteosarcoma patients have plateaued over the past four decades. This is especially alarming for the more than 30% of patients with localized osteosarcoma who develop recurrent or metastatic disease, as they have limited therapeutic options. 3 At present, the average survival for osteosarcoma patients after recurrence or metastasis is less than a year, and there are no prognostic biomarkers within the clinic that predict chemosensitivity or metastasis. 4 There is, therefore, a clear need for novel treatments and prognostic biomarkers in order to improve upon the limitations of older osteosarcoma therapies.
In response to DNA damage from replicative and extrinsic stress, cells activate a complex signaling network to arrest the cell cycle and repair the genome. 5 Ataxia-telangiectasia and Rad3 related protein kinase (ATR), a serine/threonine kinase member of the ataxia-telangiectasia mutated protein kinase (ATM) subfamily, is critical in this DNA damage response (DDR). 6 Initial recruitment of ATR to DNA damage sites activates checkpoint kinase 1 (Chk1) signaling, accelerating vital downstream pathways that prevent replicative catastrophe.7,8 For cancer, increased ATR expression and activation are associated with shorter patient survival as well as higher tumor grade, dedifferentiation, pleomorphism, and mitotic index.9,10 As cancer cells undergo unmitigated replication, they rely heavily on protective ATR signaling, and are particularly sensitive to ATR inhibition. 11 ATR suppression has shown efficacy as a cancer monotherapy, and is synergistic with PARP inhibitors or radiotherapy. 12
Because various cancers rely on a strong ATR response for DNA repair, ATR has become an attractive target in cancers, such as osteosarcoma, that have limited therapeutic options. We therefore sought to confirm the correlation of ATR with osteosarcoma patient clinicopathology and outcomes, as well as its roles in osteosarcoma cell growth, proliferation, and spheroid formation. We also explored targeted ATR therapy as a novel treatment strategy for metastatic osteosarcoma.
Material and methods
Human osteosarcoma tissue microarray and immunohistochemistry
The formalin-fixed, paraffin-embedded osteosarcoma tissue microarray (TMAs) were constructed with 70 patient specimens as previously described.13,14 The study was approved by the Partners Human Research Committee (#: 2007P-002464) and all patients signed a consent form for their clinical information to be used for this research. ATR and phospho-ATR (pATR) expressions were first analyzed by immunohistochemistry (IHC), with follow-up correlation with patient clinical features. The IHC-paraffin protocol was followed according to the Cell Signaling Technology company instructions. In brief, each paraffin-embedded slide was baked at 60°C for 1 h. Each section was washed in xylene for 5 min three times, then transferred through graded ethanol (100% and 95%) for 10 min twice. For antigen retrieval, endogenous peroxidase activity was quenched with 3% hydrogen peroxide. After protein blocking with normal goat serum for 1 h at room temperature, the rabbit polyclonal antibody to human ATR (1:200 dilution, #13934, Cell Signaling Technology, Beverly, MA, USA) and pATR (Ser428, 1:200 dilution, #2853, Cell Signaling Technology) was applied at 4°C overnight in a humidified chamber. The bound antibody on the array was detected by SignalStain® Boost Detection Reagent (Cell Signaling Technology) and SignalStain® DAB (Cell Signaling Technology). Prior to imaging, the section was counterstained with hematoxylin QS (Vector Laboratories, Burlingame, CA, USA) to improve nuclei imaging, and with VectaMount AQ (Vector Laboratories) for long-term preservation. Images were taken with an Olympus microscope (BX51, Olympus, Center Valley, PA, USA). The degree of immunostaining was viewed and scored separately by two independent investigators blinded to the samples, with a joint review only done in cases of score differences.
Metastatic osteosarcoma cell lines and culture
The human metastatic osteosarcoma cell lines MNNG/HOS and 143B were purchased from ATCC (Manassas, VA, USA). Of note, both MNNG/HOS and 143B form tumors with high efficiency after injection into the proximal tibia of athymic nude mice with subsequent pulmonary metastases.15,16 The two cell lines tested negative for mycoplasma and bacterial contamination. They were stably cultured in RPMI-1640 (Life Technologies, Grand Island, NY, USA) supplemented with 10% fetal bovine serum (Gibco, New York, NY, USA), 100 U/ml penicillin G, and 100 μg/ml streptomycin (Life Technologies, Carlsbad, CA, USA). They were incubated in a humidified 5% CO2 atmosphere at 37°C.
Immunofluorescence assays
Immunostaining was conducted as follows: MNNG/HOS and 143B were grown at a density of 2 × 10⁴ cells/ml in 12-well plates for 2 days, fixed with 3.7% paraformaldehyde for 15 min, permeabilized with ice-cold methanol, then blocked with 1% bovine serum albumin (BSA). The cells were then incubated with ATR (1:100 dilution, #13934, Cell Signaling Technology) and pATR (Ser 428, 1:100 dilution, #2853, Cell Signaling Technology) primary antibodies and β-actin antibodies (1:5000 dilution, #A5316, Sigma-Aldrich, St. Louis, MO, USA) at 4°C overnight. This was followed by incubation with Alexa Fluor 488 (Green) conjugated goat anti-rabbit antibody (1:1000, #A-11034, Invitrogen, La Jolla, CA, USA) and Alexa Fluor 594 (Red) goat anti-mouse antibody (1:1000, #A-11032, Invitrogen) for 1 h. Hoechst 33342 (Life Technologies, Carlsbad, CA, USA) nuclear staining was conducted at 1:10,000 for 10 min at room temperature. Finally, the cells were imaged on a Nikon Eclipse Ti-U fluorescence microscope (Diagnostic Instruments Inc., Sterling Heights, MI, USA) equipped with a SPOT RT™ digital camera.
ATR knockdown via transfection of small interfering RNA
Transfection with ATR-specific small interfering RNA (siRNA) was performed to knockdown ATR expression in metastatic osteosarcoma cells. The human nonspecific siRNA oligonucleotides (MISSION siRNA Universal Negative Control, # SIC001, Sigma-Aldrich) were used as a negative control. The ATR siRNA (#SASI_Hs01_00176271, 5′-GAUCCUACAUCAUGGUACA-3′) was purchased from Sigma-Aldrich. Increasing concentrations (0, 10, 30, and 80 nM) of ATR siRNA and nonspecific siRNA (80 nM) were transfected into the cells using Lipofectamine® RNAiMAX Reagent (Invitrogen) according to manufacturer instructions. After 48 h for Western blot or 3, 5 or 7 days for MTT assays, the transfected cells were analyzed.
ATR inactivation with the small molecule compound Berzosertib
Berzosertib (also known as VX-970/M6620/VE-822) was purchased from Selleck (#S7102, Selleck Chemicals, Houston, TX, US). MNNG/HOS and 143B were seeded into 12-well plates at a density of 2 × 10⁴ cells/ml and treated with increasing concentrations (0, 1.25, 2.5, 5, 10 μM) of Berzosertib for 24 h. Morphological cell changes were captured by light microscopy using a Zeiss microscope (Carl Zeiss, Inc., Oberkochen, Germany) with an attached Nikon D40 digital camera (Diagnostic Instruments Inc.) equipped with Zen Imaging software.
Cell growth and proliferation assays
For the 2-dimensional (2D) clonogenic assays, MNNG/HOS and 143B were plated into 6-well plates at 4 × 10² cells/well with different concentrations of Berzosertib upon seeding. They were cultured in growth media without antibiotics at 37°C for 7–10 days, methanol-fixed and Giemsa (GS)-stained (Sigma-Aldrich), and then underwent colony counting. These clonogenic assays were performed in triplicate.
MNNG/HOS and 143B were seeded into 96-well plates at a density of 2 × 10³ cells/well and exposed to various concentrations of ATR siRNA for 5 days or Berzosertib for 3, 5, and 7 days. Treatments were performed at the time of seeding. Cell viability and cytotoxicity were assessed by MTT assays. In brief, at the end of cell treatment, 20 μl of MTT (5 mg/ml, Sigma-Aldrich) was added to each well for 4 h of incubation at 37°C. Next, the resulting formazan product was dissolved with 100 μl of acid isopropanol. The absorbance was measured at a wavelength of 490 nm (A490) on a SpectraMax Microplate® Spectrophotometer (Molecular Devices LLC, San Jose, CA, USA). All MTT assays were performed in triplicate.
Protein preparation and western blotting
Protein lysates were extracted from MNNG/HOS and 143B with 1 × radioimmunoprecipitation assay (RIPA) lysis buffer (Upstate Biotechnology, Charlottesville, VA, USA) supplemented with complete protease inhibitor cocktail tablets (Roche Applied Science, Indianapolis, IN, USA). The protein lysate concentrations were determined by DC™ protein assay reagents (Bio-Rad, Hercules, CA, USA) according to manufacturer protocol and measured with a Beckman spectrophotometer (Beckman Instruments, Inc., Indianapolis, IN, USA). Equal concentrations of denatured proteins were separated by NuPAGE® 4–12% Bis-Tris Gel (Invitrogen) then transferred to nitrocellulose membranes (Bio-Rad). After blocking with 5% non-fat milk for 1 h, the membranes were incubated with rabbit monoclonal antibodies to human ATR, pATR, phospho-Chk1 (pChk1, Ser 345, 1:1000 dilution, #2348, Cell Signaling Technology), phospho-Chk2 (pChk2, Thr 68, 1:1000 dilution, #2197, Cell Signaling Technology), phospho-ATM (pATM, Ser 1981, 1:1000 dilution, #5883, Cell Signaling Technology), phospho-histone H2AX (γH2AX, Ser 139, 1:1000 dilution, #9718, Cell Signaling Technology), Bcl-xL (1:1000 dilution, #2764, Cell Signaling Technology), PARP (1:1000 dilution, #9532, Cell Signaling Technology), mouse monoclonal antibodies to human Chk1 (1:1000 dilution, #2360, Cell Signaling Technology), and β-actin at 4°C overnight. Following primary antibody incubation, the membranes were washed with TBST three times for 5 min before a Goat anti-rabbit IRDye® 800CW (#926-32211, 1:5000 dilution, Li-COR Biosciences, Lincoln, NE, USA) or Goat anti-mouse IRDye® 680LT secondary antibody (#926-68020, 1:10000 dilution, Li-COR Biosciences) was added. After incubation at room temperature for 2 h and washing with TBST an additional three times for 5 min each, the bands were detected using an Odyssey Infrared Fluorescent Western Blot Imaging System (Li-COR Bioscience). Quantifications of the Western blots were performed using Odyssey software 3.0 (Li-COR Bioscience).
Cell migration assays
Cell migration was measured by wound-healing assays. MNNG/HOS and 143B were seeded into six-well plates at a density of 2 × 10⁴ cells/well and incubated overnight. After they reached 100% confluency, the adherent cell layer was wounded by scraping three parallel lines with a sterile 10 μl tip. Next, 1 μM of Berzosertib was immediately added into the cell medium with low-serum medium containing 2% FBS, as serum starving is the most common non-pharmaceutical method for minimizing proliferation in wound healing assays. 17 The wounds were observed at 0, 6, 12, 24, and 48 h after Berzosertib treatment. The wounded cells within each well were photographed at each time point with a Zeiss microscope (Carl Zeiss, Oberkochen, Germany) with a Nikon D40 digital camera (Diagnostic Instruments Inc.) and Nikon Camera Control Pro 2 Imaging software (Diagnostic Instruments Inc.). The wound width was measured as the distance between the two edges of a scratch at five sites in each image. Cell migration was determined using the following formula: percentage of wound healing (%) = [(wound width at the 0 h time point−wound width at the observed time point)/wound width at the 0 h time point] × 100%.
Three-dimensional cell culture
Three-dimensional (3D)-cell culture can artificially simulate the in vivo cancer environment to better observe true growth behavior. Per the manufacturer protocol, the hydrogel 3D culture system was first prepared by diluting a hydrogel solution (VitroGel 3D-RGD, #TWG002, TheWell Bioscience, North Brunswick, NJ, USA) with deionized water in a 1:3 ratio, then mixed with complete growth media and 1 µM of Berzosertib. Next, 50 µl of cell suspension (2 × 10⁴ cells/ml) was added to 200 µl of the hydrogel 3D culture and gently transferred into a 24-well culture plate. This product was allowed to settle for 15 min for hydrogel stabilization. An additional 250 µl of complete growth medium with 1 µM Berzosertib treatment was then added to cover the hydrogel. The cells were incubated in a humidified 5% CO2, 95% air atmosphere at 37°C. The media with 1 µM Berzosertib was changed every other day to ensure adequate cell nutrition and to prevent a shift in media osmolality. After 2 weeks, light microscope images of the MNNG/HOS and 143B cell spheroids were obtained with a Zeiss microscope (Carl Zeiss) attached with a Nikon D40 digital camera (Diagnostic Instruments Inc.) and Zen Imaging software. The spheroids were also imaged on a Nikon Eclipse Ti-U inverted fluorescence microscope (Nikon Instruments Inc., Melville, NY, USA) after 15 min of incubation with 1 μM Calcein AM (Life Technologies). The size of cell spheroids was calculated using Image J software. The same protocol was used for controls (cell only).
Statistical analysis
Statistical analysis was performed using GraphPad PRISM 8 software (GraphPad Software, San Diego, CA, USA). Data are expressed as mean ± SD. Student t-tests were used to determine the statistical significance of differences between groups. Survival analysis was assessed using the Kaplan–Meier method, and significance was determined by the log-rank test; p values ⩽ 0.05 were considered statistically significant.
Results
ATR expression is associated with osteosarcoma clinicopathology
As shown by osteosarcoma IHC staining, ATR is localized to the cytoplasm, whereas pATR resides within the nucleus. ATR staining intensity was assessed as follows: 0, no cytoplasmic staining; 1+, weak staining; 2+, moderate staining; and 3+, intense staining. These stained samples were subdivided into either a low-ATR expression group, with no (0) or a weak staining (1+); or a high-ATR expression group, with moderate (2+) or intense (3+) staining. pATR staining intensity was based on a semi-quantitative scale according to the percentage of cells with positive nuclear staining: 0, no nuclear staining; 1+, <10% positive nuclei; 2+, 10–25% positive nuclei; 3+, 26–50% positive nuclei; 4+, 51–75% positive nuclei; 5+, >75% positive nuclei. These patient specimens were then subdivided into one of the following two categories: the low-pATR expression subgroup included samples with staining <3+, and samples with a staining score ⩾3 were defined as the high-pATR expression group (Figure 1A).

IHC staining of ATR in an osteosarcoma TMA correlates to chemo-response, tumor progression, and patient prognosis. ATR and activated pATR expression in a TMA constructed from 70 osteosarcoma patient samples evaluated by IHC. (A) Representative images of the TMA ATR and pATR staining (200×; scale bar: 100 µm). Four subgroups were defined according to ATR staining intensity in the cytoplasm. The stained samples were then subdivided into either the low (0 or 1+) or high (2+ or 3+) ATR expression group. Six subgroups were defined based on the percentage of cells with positive nuclear pATR staining. Again, patient samples were categorized as being in the low (staining score <3) or high (staining score ⩾3) pATR expression group. (B) Pie chart represents the relative frequencies of different ATR and pATR expression amongst the osteosarcoma TMA specimens. (C) Association of ATR and pATR expression with chemo response according to percentage of histological tumor necrosis of the osteosarcoma tissues. (D) Comparison of ATR and pATR IHC staining scores among primary, metastatic, and recurrent osteosarcoma samples. (E) Comparison between ATR and pATR IHC staining scores in osteosarcoma patients that survived (survival) and those that did not (non-survival). (F) Inverse correlation between ATR and pATR expression and osteosarcoma patient clinical follow ups (based on the Spearman’s rank correlation). (G) Kaplan–Meier overall-survival curve of osteosarcoma patients sub-grouped as in the ATR or pATR low-expression group and high-expression group. (H) Kaplan–Meier disease-free survival curves of osteosarcoma patients with low and high expression of ATR or pATR.
ATR was expressed in most osteosarcoma patients and often in the phosphorylated state. Of the 70 patient samples, 52 (74.3%) were ATR-positive and 18 (25.7%) were ATR-negative. For the activated phosphorylation status, 53 (75.7%) were pATR-positive and 17 (24.3%) were pATR-negative (Figure 1B). No significant correlation existed between ATR or pATR expression and age, sex, or tumor. A summary of the clinicopathological characteristics is illustrated in Table 1.
Correlation between ATR or pATR expression and clinicopathology of osteosarcoma patients.
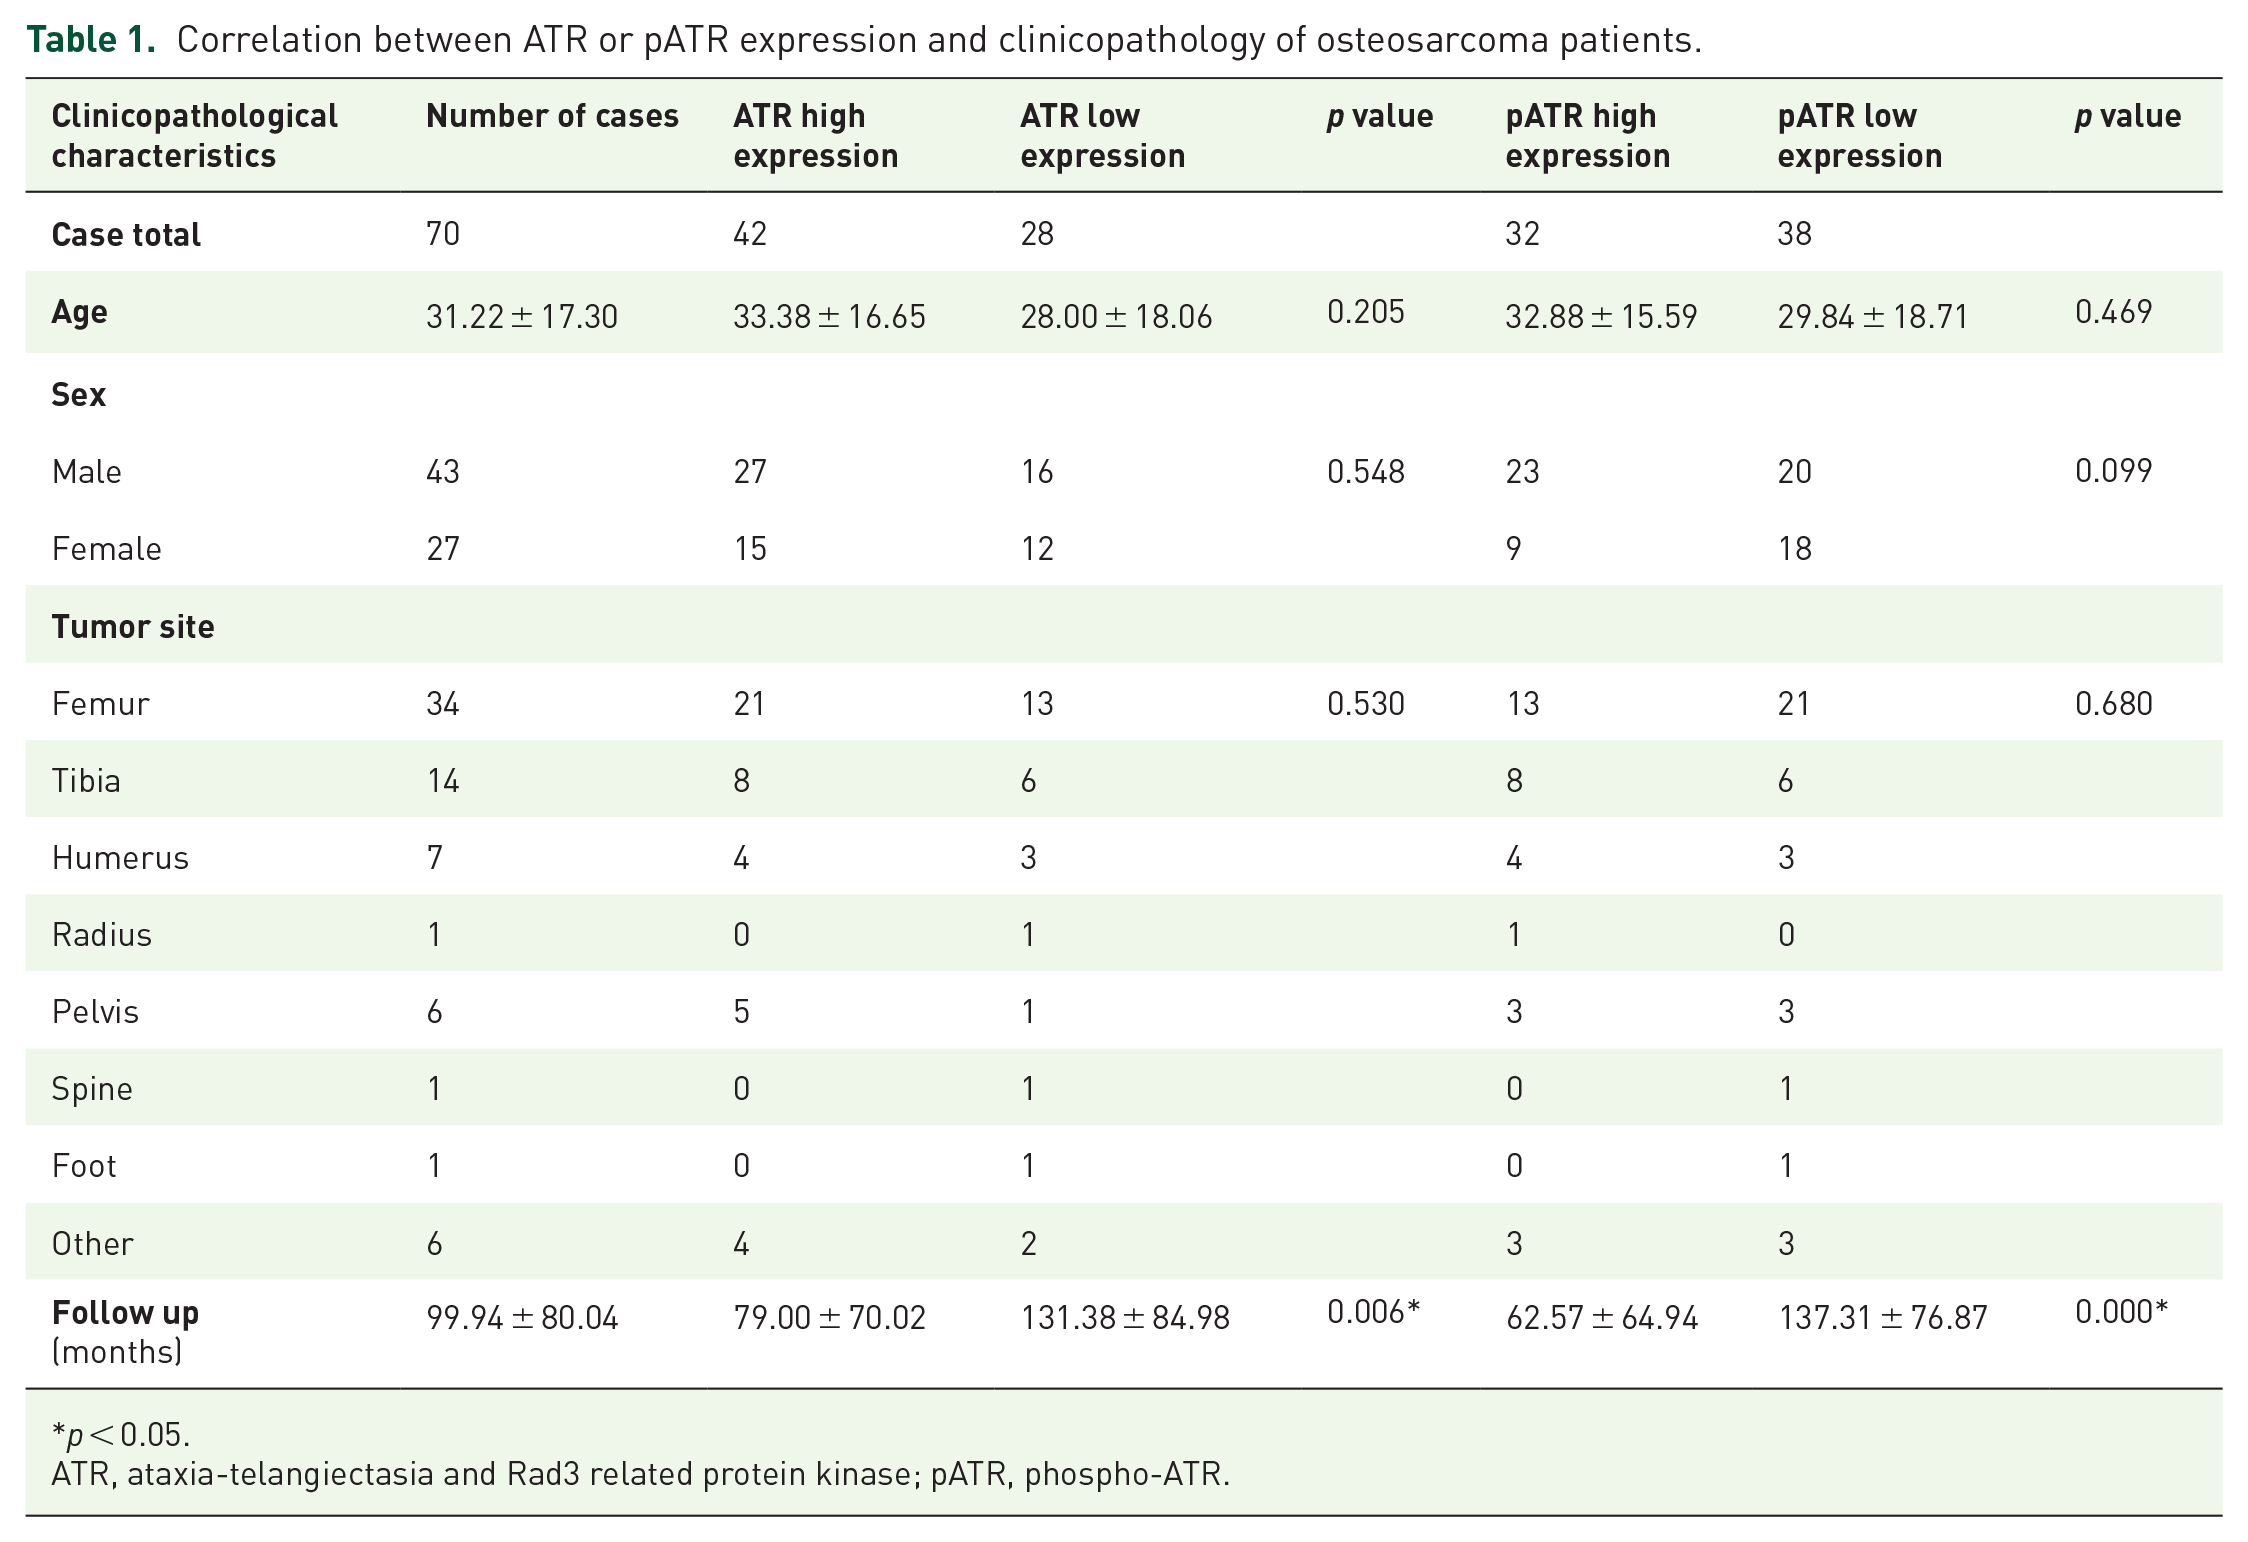
p < 0.05.
ATR, ataxia-telangiectasia and Rad3 related protein kinase; pATR, phospho-ATR.
Percent tumor necrosis is a clear and accepted measurement of chemotherapeutic response. Data on percent tumor necrosis following neoadjuvant chemotherapy was available for 41 of our specimens. Of these, 6 patients showed a favorable response (⩾90% necrosis) while the other 35 had neoadjuvant chemoresistance (<90% necrosis). Of note, those patients with chemoresistance had significantly higher expression of ATR (1.69 ± 0.14) or pATR (2.97 ± 0.25) compared with the good responders (0.33 ± 0.33 or 1.50 ± 0.62, separately) (Figure 1C). In addition, ATR expression was significantly higher in metastatic (1.98 ± 0.18) and recurrent (2.18 ± 0.23) tissues compared with primary tumors (1.44 ± 0.12) (Figure 1F). Similar correlations were observed in pATR for metastatic (2.75 ± 0.24) and recurrent (3.00 ± 0.40) tissues compared with primary tumors (1.97 ± 0.18) (Figure 1D). All these observations were statistically significant as p < 0.05. We outline the relationships between ATR or pATR expression and clinical features in osteosarcoma patients in Table 2.
Correlation between ATR or pATR expression and clinical features of osteosarcoma patients.

p < 0.05.
ATR, ataxia-telangiectasia and Rad3 related protein kinase.
High ATR expression is inversely correlated with osteosarcoma patient prognosis
We next examined the association between ATR or pATR expression and osteosarcoma patient outcomes. Based on patient follow-up data up to 276 months, ATR expression was significantly higher in patients who died (non-survival; 1.70 ± 0.15) compared with those who survived (survival; 1.10 ± 0.18). In addition, pATR expression was also higher in patients who died (2.58 ± 0.20) compared with those living (1.17 ± 0.25) (Figure 1E). Spearman’s rank correlation showed patient prognosis is inversely correlated with ATR expression (r = −0.37) and pATR expression (r = −0.42) (Figure 1F). Kaplan–Meier analysis revealed patients with high ATR expression have significantly shorter survival (Figure 1G) and disease-free survival (Figure 1H) compared with those with low ATR expression (based on the log-rank test). Similarly, patients with high expression of pATR had significantly shorter overall survival (Figure 1G) and disease-free survival (Figure 1H) than those with low pATR expression (based on the log-rank test). The Cox proportional hazards regression survival analysis is summarized in Table 3 (p < 0.05).
Survival analysis of ATR or pATR expression in osteosarcoma.
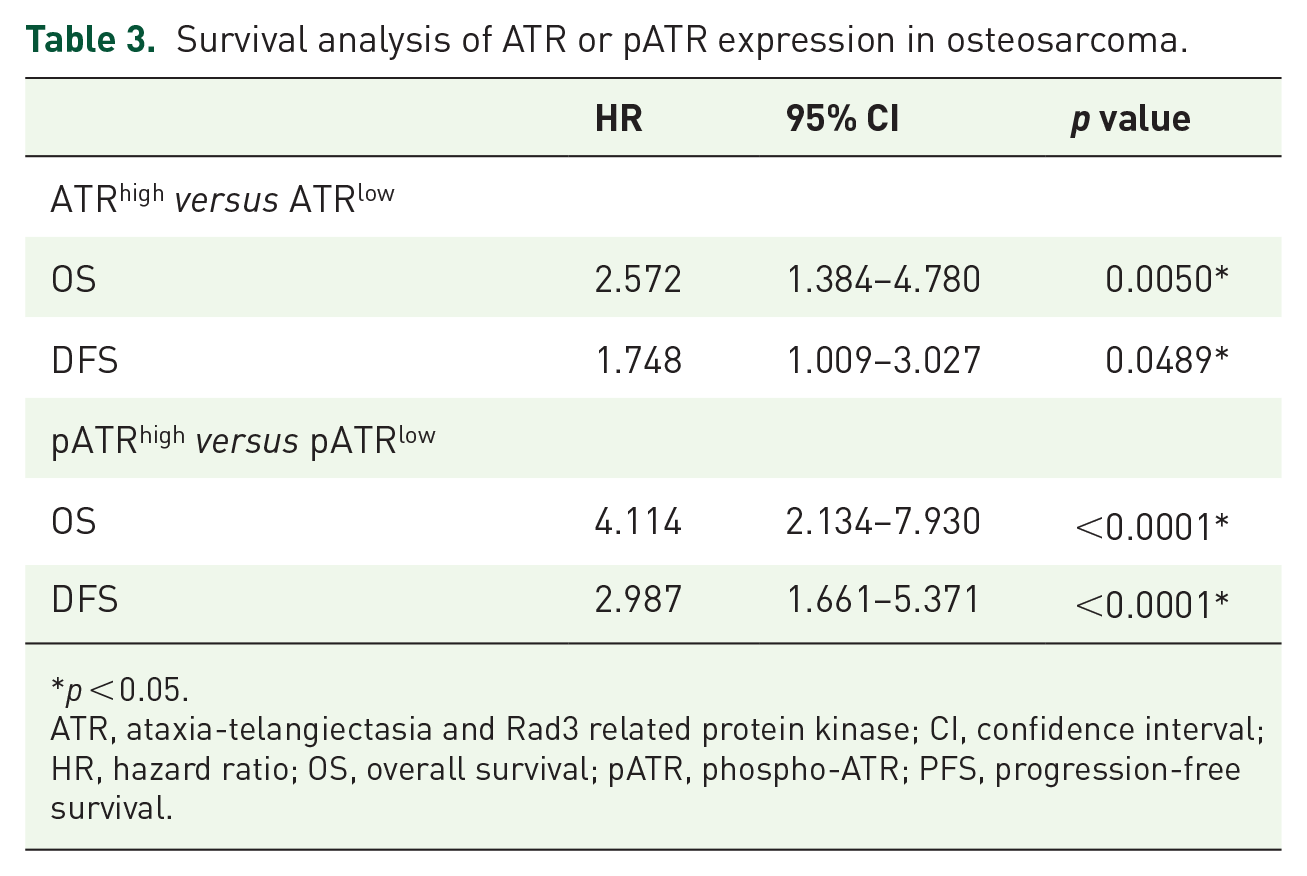
p < 0.05.
ATR, ataxia-telangiectasia and Rad3 related protein kinase; CI, confidence interval; HR, hazard ratio; OS, overall survival; pATR, phospho-ATR; PFS, progression-free survival.
ATR expression in osteosarcoma cell lines and tissues
Expression of ATR and pATR in osteosarcoma cell lines and tissues was assessed via western blot. ATR and pATR were overexpressed in all tested osteosarcoma cell lines compared with normal osteoblast cell lines (Figure 2A) and in five osteosarcoma tissue samples (Figure 2B). Expression and activation of ATR varied between patients, as confirmed in our tumor samples. Relative expressions of ATR and pATR were compared with β-actin in the osteosarcoma cell lines and osteosarcoma tissues (Figure 2A and B).

Expression of ATR and pATR in osteosarcoma cell lines and clinical fresh patient tissues. (A) Expression levels of ATR and pATR in osteosarcoma cell lines (MG63, Saos-2, MNNG/HOS, 143B, U2OS and KHOS) are higher than that in normal osteoblast cell lines (HOB-c and hFOB) as measured by western blot. Relative densitometry quantification of the expressions of ATR and pATR compared with β-Actin in osteosarcoma cell lines are showed blow.
Immunofluorescence assays were used to test the sublocalization of ATR and pATR in the metastatic osteosarcoma cell lines MNNG/HOS (Figure 2C) and 143B (Figure 2D). As previously stated, ATR is involved in controlling the DDR, with most of its function dependent on phosphorylation and nuclearization. Our immunofluorescence confirmed the IHC findings that ATR (green) is localized to the cytoplasm (red), while pATR (green) is largely sub-nuclear (blue) in osteosarcoma cells, with yellow representing co-localization with cytoplasmic β-actin (red).
ATR is crucial for osteosarcoma cell growth and proliferation
To analyze the function of ATR specific for osteosarcoma, we added ATR-specific siRNA to knock down ATR expression. Transfection with increasing concentrations of ATR siRNA over 5 days produced a dose-dependent decrease of cell viability in both MNNG/HOS and 143B. As expected, no significant changes were seen in the cell-only control and nonspecific siRNA transfected cell groups (Figure 3A). After ATR siRNA transfection, representative micrographs showed osteosarcoma cell morphology consistent with the toxic effects of ATR knockdown (Figure 3B). Our protein expression analyses following ATR-specific siRNA knockdown confirmed the downregulation of ATR, pATR, and pChk1, with pChk2 and pATM showing no significant changes (Figure 3C, Supplemental Figure S2A). Moreover, decreased expression of the anti-apoptotic protein Bcl-xL supported activation of pro-apoptotic pathways (Figure 3C).

Knockdown of ATR with siRNA decreases cell growth through inhibition of DNA damage repair in metastatic osteosarcoma cells. (A) MTT assays demonstrate a dose-dependent reduction of cell viability after ATR siRNA transfection in MNNG/HOS and 143B cell lines.
Berzosertib induces cytoplasmic vacuolization and cell death in metastatic osteosarcoma
After validating the role of ATR at the mRNA level, we proceeded to assess the effects of the ATR selective inhibitor Berzosertib on metastatic osteosarcoma cells. Similar to ATR mRNA knockdown, Berzosertib led to a dose-dependent decrease in cell viability in MNNG/HOS and 143B over a 7-day observation period (Figure 4A). Signs of cytotoxicity and cytoplasmic vacuolization were assessed by microscopy at multiple time points after Berzosertib exposure. With increasing doses of Berzosertib (0, 0.625, 1.25, 2.5, 5, 10 μM) for 48 h, the osteosarcoma cells showed morphologic signs of toxicity including abnormal shape, cellular lysis, and destruction. The cells began to show observable signs of toxicity via cell reduction and abnormal morphology with 1.25 μM of Berzosertib. Changes were increasingly pronounced up to drug concentrations of 10 μM (Figure 4B).

Inhibition of ATR activity with Berzosertib suppresses cell growth and proliferation, and induces cytoplasmic vacuolization in metastatic osteosarcoma cells. (A) Cell viability as determined by MTT assays following 48 h of Berzosertib treatment in MNNG/HOS and 143B osteosarcoma cells. The data are mean ± SD of the experiments carried out in triplicate. (B) Representative morphologic changes in MNNG/HOS and 143B cells after increasing concentrations of Berzosertib by microscopy (scale bar: 50 μm). (C) Representative images of cytoplasmic vacuolization induced by Berzosertib in metastatic osteosarcoma cells under microscopy (scale bar: 20 μm).
More specific changes following Berzosertib treatment included cytoplasmic vacuolization, and occurred in a dose- and time-dependent manner (Figure 4C). As early as 2 h after Berzosertib administration, vacuoles appeared in the cytoplasm, with increasing prominence at 6 h to 12 h. Overt signs of cell death in MNNG/HOS and 143B were very evident at 24 h of Berzosertib treatment as well (Supplemental Figure S1).
ATR targeting induces DNA damage via modulating the Chk1 checkpoint
Silencing of ATR with siRNA inhibits Chk1-dependent checkpoint control and DDR in a dose-dependent manner. This was evidenced by reduced expression of active pChk1 without significantly affecting Chk1, as well as by the increased expression of the sensitive DNA damage marker γH2AX (Figure 3C). Following Berzosertib exposure, there was significant inhibition of ATR phosphorylation and activation, as shown by decreased pATR and pChk1. There were no significant changes in pChk2 or pATM expression (Figure 5A,B; Supplemental Figure S2B). Western blots also showed inhibition of ATR with Berzosertib suppresses phosphorylation of Chk1, causing less Chk1 mediated signaling activity as well as increased γH2AX and cleaved PARP expression, consistent with DDR interference (Figure 5A,B).

Treatment with Berzosertib inactivates ATR-Chk1 related pathways and reduces cell migration in metastatic osteosarcoma cells. (A, B) Western blot after 48 h of Berzosertib exposure shows decreased expression of pATR and increased expression of γH2AX and cleaved PARP in MNNG/HOS (A) and 143B (B) osteosarcoma cells. (C) Relative migration distance of MNNG/HOS and 143B osteosarcoma cells at different time points (0 h, 6 h, 12 h, 24 h, and 48 h) after Berzosertib treatment (scale bar: 50 μm). (D) Cell migration distance of MNNG/HOS and 143B osteosarcoma cells after exposure to Berzosertib.
Abrogation of ATR activity delays motility of metastatic osteosarcoma
Given cell migration and invasion is foundational to metastasis, and our TMA showed a strong correlation between ATR expression and osteosarcoma progression, we elected to examine cell motility via wound-healing migration assays. In short, inhibition of ATR suppressed metastatic osteosarcoma cell motility as illustrated by our accompanying images. During the 48 h incubation period, MNNG/HOS treated with Berzosertib showed significantly decreased migration compared with the cell-only controls. Similar results were observed in the 143B metastatic cell line (Figure 5C). Relative migration distances of MNNG/HOS and 143B compared with the cell only group were charted after Berzosertib treatment at 0, 6, 12, 24, and 48 h time points (Figure 5D).
ATR inhibition reduces in vitro clonogenicity and ex vivo spheroid formation in metastatic osteosarcoma
The effect of ATR inhibition on 2D clonogenicity was evaluated in vitro. Berzosertib induced a dose-dependent reduction in colony formation in metastatic osteosarcoma cells (Figure 6A). 2D colony formation for MNNG/HOS and 143B compared with the untreated cell group were analyzed after 14 days of Berzosertib treatment.

Inhibition of ATR with Berzosertib reduces 2D colony formation and 3D spheroid formation in metastatic osteosarcoma. (A) Representative images of cell colony formation after treatment with Berzosertib in MNNG/HOS and 143B cells. Quantification of clonogenic assays reveal a reduced rate of cell colony formation after exposure to Berzosertib in metastatic osteosarcoma cells.
Our ex vivo 3D cell culture model was used to mimic an in vivo osteosarcoma environment to better understand how ATR inhibition affects spheroid formation in metastatic osteosarcoma. In brief, MNNG/HOS and 143B were exposed to 1 µM Berzosertib for 14 days in 3D culture, and their resultant spheroids were photographed across 3, 5, 7, 10, and 14 days. Inhibition of ATR reduced osteosarcoma spheroid formation in the 3D culture (Figure 6B,C).
Discussion
In the present study, we show ATR and its active pATR form are highly expressed in osteosarcoma tissues and cell lines and correlate with tumor aggression. These findings are consistent with previous research demonstrating amplification and upregulation of ATR in cancers. 9 Given percent tumor necrosis following adjuvant chemotherapy correlates with osteosarcoma chemosensitivity and prognosis,18,19 we analyzed these variables alongside ATR and pATR expression. We found high ATR and pATR expression to be more characteristic of chemo-resistant osteosarcomas. In addition, Kaplan–Meier survival analysis showed elevated ATR and pATR expression correlates with poor prognosis and patient survival. These results support ATR as a prognostic biomarker in osteosarcoma.
Disruption of ATR signaling often leads to maladaptive genomic instability that is lethal to proliferating cancer.20,21 We show ATR is highly expressed and activated (pATR) in osteosarcoma cell lines compared with normal osteoblast cell lines, and, when inhibited, induces apoptosis. The highly selective ATR inhibitor Berzosertib has validated anticancer activity in pancreatic cancer, esophageal squamous cell carcinoma, and gastric cancer both in vitro and in vivo.22 –25 In our study, Berzosertib increased cytoplasmic vacuolization in a dose- and time-dependent manner, and appeared alongside cell toxicity, lysis, and eventual death of the osteosarcoma cell lines. Of note, cytoplasmic vacuolization is a response characteristic of cell death.26 –28
Chk1 is a major downstream target of ATR which when phosphorylated facilitates cell cycle arrest and the DDR.8,20,29 In osteosarcoma, we confirmed that siRNA or Berzosertib suppressed phosphorylation of Chk1 on the Ser 345 residue alongside increased γ-phosphorylation of H2AX on the Ser 139 residue. These results show the Chk1-mediated signaling cascade helps prevent DNA double-strand breaks (DSBs) and maintains genomic integrity during replication. Additionally, ATR is a recognized core component of the DDR alongside ATM and the DNA dependent protein kinase catalytic subunits (DNA-PKcs). 30 Although these kinases share similar DNA sequences, they respond uniquely to DNA damage. 31 And while the ATM/DNA-PKcs pathway is activated in response to DSBs during all cell cycle phases, ATR principally responds to DNA replication stress (RS) in a Chk1-dependent manner.32 –34 Mechanistically, the ATR/Chk1 pathway responds to RS during cell division, where it slows replication fork elongation in order to protect against genomic instability.35 –37 More specifically, Chk1 is activated via the phosphorylation of its Ser 345 residue, thus pausing replication while DNA repair takes place.37 –39 Upon replication fork stalling, DSBs are blocked by combined ATR-dependent fork stabilization and H2AX/ATM/DNA-PKcs pathway activation. 40 In cancer cells, spontaneous mutation of ATM results in reliance on ATR mediated DDR; however, if ATR is also inhibited, unrepaired DNA promotes cell death.
ATR is the main kinase generating γH2AX during replication arrest. 35 When ATR deficient, H2AX rapidly undergoes γ-phosphorylation on Ser 139 (this phosphorylated form is called γH2AX) during the early stages of DSBs. 41 Since generation of γH2AX is abundant, fast, and correlates well with each DSB, it is a sensitive marker of DNA damage and repair.42 –44 Because genomic instability is a hallmark of cancer, the protein kinases involved in the DDR are promising antitumor targets. Studies have shown mice with reduced expression of ATR are less tumorigenic.45,46 Targeting of ATR is therefore a promising avenue in osteosarcoma therapy. At present, several ATR inhibitors, including Berzosertib, are in preclinical and clinical trials.12,30,47 ATR plays a direct anti-apoptotic role in response to DNA damage through activating Chk1 by phosphorylation, thus halting indiscriminate mitosis entry.48 –50
PARP is a DNA-dependent polyadenylic acid-synthesizing nuclear enzyme involved in DNA damage repair, gene transcription, mitosis, and cell survival. 51 Its activity is instrumental to the repair of DNA single-strand breaks (SSBs).52,53 PARP binds to SSBs and catalyzes the polymerization of ADP-ribose (PARylation), producing various polymers of ADP-ribose (PAR). 54 A loss of function of PARP weakens DNA base excision repair and accumulates SSBs and eventual DSBs through replication fork collapse, ultimately leading to cell death. 55 Our data show Berzosertib treated osteosarcoma cells have increased expression of cleaved PARP and cell apoptosis (Supplemental Figure S3). In addition, when these cells underwent knockdown of ATR with siRNA, we observed decreased antiapoptotic protein Bcl-xL, which is consistent with non-viable cancer cells.
Cell motility is crucial for the survival and dissemination of metastatic cells. 56 It is therefore a significant finding that Berzosertib reduced in vitro metastatic osteosarcoma cell line migration. Moreover, as 3D cell culture helps bridge in vitro work into a more realistic in vivo environment,57,58 we employed this platform when evaluating ATR inhibition. Although most available in vitro data are based on 2D conditions, limiting cell growth to a flat plastic surface does not properly reflect multidirectional, spheroid in vivo growth.59,60 We found Berzosertib treatment delayed osteosarcoma cell spheroid growth compared with untreated cells. Collectively, these results show ATR has crucial roles in the clonogenic and spheroid osteosarcoma growth expected in vivo.
Conclusion
We demonstrate elevated ATR expression and activation is an independent predictor of poor prognosis in osteosarcoma patients. Inhibition of ATR induces cytoplasmic vacuolization and apoptosis through downregulation of Chk1 signaling pathways. Taken together, our study supports ATR as an emerging prognostic biomarker and promising therapeutic target in metastatic osteosarcoma.
Supplemental Material
Supplementary_Figure_S1 – Supplemental material for Inhibition of ATR-Chk1 signaling blocks DNA double-strand-break repair and induces cytoplasmic vacuolization in metastatic osteosarcoma
Supplemental material, Supplementary_Figure_S1 for Inhibition of ATR-Chk1 signaling blocks DNA double-strand-break repair and induces cytoplasmic vacuolization in metastatic osteosarcoma by Xiaoyang Li, Dylan C. Dean, Gregory M. Cote, Lee Zou, Francis J. Hornicek, Shengji Yu and Zhenfeng Duan in Therapeutic Advances in Medical Oncology
Supplemental Material
Supplementary_Figure_S2 – Supplemental material for Inhibition of ATR-Chk1 signaling blocks DNA double-strand-break repair and induces cytoplasmic vacuolization in metastatic osteosarcoma
Supplemental material, Supplementary_Figure_S2 for Inhibition of ATR-Chk1 signaling blocks DNA double-strand-break repair and induces cytoplasmic vacuolization in metastatic osteosarcoma by Xiaoyang Li, Dylan C. Dean, Gregory M. Cote, Lee Zou, Francis J. Hornicek, Shengji Yu and Zhenfeng Duan in Therapeutic Advances in Medical Oncology
Supplemental Material
Supplementary_Figure_S3 – Supplemental material for Inhibition of ATR-Chk1 signaling blocks DNA double-strand-break repair and induces cytoplasmic vacuolization in metastatic osteosarcoma
Supplemental material, Supplementary_Figure_S3 for Inhibition of ATR-Chk1 signaling blocks DNA double-strand-break repair and induces cytoplasmic vacuolization in metastatic osteosarcoma by Xiaoyang Li, Dylan C. Dean, Gregory M. Cote, Lee Zou, Francis J. Hornicek, Shengji Yu and Zhenfeng Duan in Therapeutic Advances in Medical Oncology
Footnotes
Acknowledgements
We would like to sincerely thank the Orthopaedic Department of Massachusetts General Hospital for providing the osteosarcoma tissue samples and related clinical data. We also thank the Dana-Farber/Harvard Cancer Center for the construction of the tissue microarray.
Author contributions
X.L.: Methodology, formal analysis, data curation, writing-original draft.
D. D.: Validation, writing-editing.
G. C.: Methodology, writing-review.
Z. L.: Conceptualization, methodology.
F. H.: Investigation, resources, supervision, project administration.
S. Y.: Supervision, Funding acquisition.
Z. D.: Resources, supervision, writing-review & editing, funding acquisition.
Conflict of Interest statement
The author(s) declared no potential conflicts of interest with respect to the research, authorship, and/or publication of this article.
Funding
The author(s) disclosed receipt of the following financial support for the research, authorship, and/or publication of this article: This work was supported by the Chinese Academy of Medical Sciences (CAMS) Innovation Fund for Medical Sciences (CIFMS) (2017-I2M-1-005), the Capital Characterized Clinical Application Research Fund of Beijing Municipal Science and Technology Commission of China (Z171100001017210), the Beijing Hope Run Special Fund of Cancer Foundation of China (LC2016L01), a Grant from Sarcoma Foundation of America (SFA) (222433) and a Grant from National Cancer Institute (NCI)/National Institutes of Health (NIH) (UO1, CA151452-01).
Supplemental material
Supplemental material for this article is available online.
References
Supplementary Material
Please find the following supplemental material available below.
For Open Access articles published under a Creative Commons License, all supplemental material carries the same license as the article it is associated with.
For non-Open Access articles published, all supplemental material carries a non-exclusive license, and permission requests for re-use of supplemental material or any part of supplemental material shall be sent directly to the copyright owner as specified in the copyright notice associated with the article.