
Abstract
Background:
Aberrant activities of signal transducer and activator of transcription 1 (STAT1) have been implicated in cancer development. However, the prognostic value of STAT1 remains unclear. This report identified the role of STAT1 in prognosis in patients with solid cancer through open literature and The Cancer Genome Atlas (TCGA) database.
Methods:
Published articles were obtained from PubMed, Web of Science, and Embase databases according to a search strategy up to October 2019. Pooled hazard ratios (HRs) with 95% confidence intervals (CIs) were extracted to assess the prognostic factors of patients. TCGA datasets were used to explore the prognostic value of STAT1 in various cancers.
Results:
A total of 15 studies incorporating 2839 patients with solid cancers were included. Pooled data showed that overexpressed STAT1 favored long overall survival (OS) (HR = 0.604, 95% CI = 0.431–0.846, p = 0.003) and disease-specific survival (DSS) (HR = 0.650, 95% CI = 0.512–0.825, p = 0.000). In subgroup analyses, highly expressed STAT1 was correlated with long OS of patients with high-grade serous ovarian cancer and oral squamous cell carcinoma. Data extracted from TCGA datasets unveiled that STAT1 expression was significantly higher in 12 cancers (e.g. bladder and breast) than their adjacent normal tissues. Again, highly expressed STAT1 favored long OS of patients with ovarian cancer as well as rectum adenocarcinoma, sarcoma, and skin cutaneous melanoma. However, in renal carcinoma, brain lower grade glioma, lung adenocarcinoma, and pancreatic cancer, highly expressed STAT1 was correlated with poor OS of patients. Particularly in renal carcinoma, increased STAT1 expression was associated with high grade, later stage, large tumor size, and lymph node and distant metastasis.
Conclusion:
STAT1 has been identified to have prognostic value in patients with solid cancer. Highly expressed STAT1 may predict prognosis in cancer patients based on their tumor types.
Introduction
Cancer is a common disease at the gene level and remains a major problem of health-care worldwide. 1 As the population continually grows and people live longer, the number of new cancer cases is increasing annually. In 2020, the American cancer burden is estimated to be 1,806,590 new cancer cases and 606,520 cancer deaths. 2 Accumulated evidence shows that the Janus kinase (JAK)/signal transducer and activator of transcription (STAT) signaling pathway is involved in the cellular processes of cancer development and mediated by the regulatory actions of various cytokines, interferon, and growth factors. 3 The JAKs are initially activated by ligand binding, followed by the induction of the trans-phosphorylation of STAT proteins. The activated STATs subsequently enter the nucleus, where they act as transcription factors that bind to target genes.4,5 In normal physiological conditions, the JAK/STAT signal pathway plays a key role in proliferation, apoptosis, immunity, and cell differentiation.6,7 It has been shown that activation of the JAK/STAT signaling pathway occurs frequently in a wide variety of tumors and is associated with advanced tumor growth, angiogenesis, and stem cell maintenance.7–9 Therefore, JAK/STAT signaling transducers can be speculated or expected as promising targets for drug development and cancer therapy.
The STAT proteins belong to a family of cytoplasmic transcription factors and have seven members, including STAT1, STAT2, STAT3, STAT4, STAT5A, STAT5B, and STAT6.10,11 Of all the members, much attention has been paid to STAT3 and STAT1.12,13 STAT1 is the first member of the STAT family shown to function as a central mediator of type I and type II interferon (IFN) activation and is involved in the immune-defense reaction, which helps protect individuals against infections from pathogens and other viruses in innate immunity. 14 Previous studies revealed that STAT1 is overexpressed in malignant tumors and plays an oncogenic role in patients with cancer, such as breast and ovarian cancers.15,16 Patients with STAT1 or phospho-STAT1 at a high expression level have a worse outcome compared with patients with STAT1 at a low expression level. 17 However, on the other hand, STAT1 deficiency studies show that STAT1 may act as a tumor suppressor in many ways. For example, the loss of STAT1 expression is found in colorectal and breast cancers.18,19 Furthermore, evidence from in vivo studies of a tumor suppressor role of STAT1 was also shown in STAT1 knockout mice, which demonstrates that STAT1 deficiency may be associated with tumor growth and may increase susceptibility to ovarian teratoma development.18,20 A more recent study displayed that the tumor growth and metastasis of head and neck squamous cell carcinoma were faster in Stat1–/– mice than in Stat1+/+ mice, 21 suggesting that STAT1 may be an essential antitumor factor. Nevertheless, the mechanism behind the oncogenic or tumor-suppressing role of STAT1 remains unclear.
Although numerous meta-analysis studies have demonstrated that elevated STAT3 expression could predict poor survival in human solid tumors,22–25 the prognostic value of STAT1 in patients with solid cancer has not yet been systemically analyzed. Based on the available evidence, we found that the role of STAT1 in patients with cancer remains controversial. Hence, this study conducted a comprehensive meta-analysis to explore the prognostic value of STAT1 in human solid cancers, and investigated the relationship between STAT1 expression and the overall survival (OS), disease-free survival (DFS), and disease-specific survival (DSS).
Materials and methods
Literature search strategy
This meta-analysis was performed in agreement with Preferred Reporting Items for Systematic Reviews and Meta-Analyses (PRISMA) guidelines. 26 Published articles in PubMed, Web of Science, and Embase databases were thoroughly reviewed up to October 2019. The main search terms were as follows: “signal transducer and activator of transcription 1 OR STAT1 OR transcription factor STAT91” AND “neoplasia OR neoplasm OR tumour OR tumor OR cancer OR malignancy” AND “prognosis OR prognoses OR prognostic factor” (Supplemental Material 1). Transcription factor STAT91 is an alias of STAT1. Extended references from selected articles were also checked for identifying other relevant studies. At least two authors independently conducted the literature search, and any disagreements between the two authors were resolved through discussion. The full electronic search strategies for PubMed and Web of Science can be found in Supplemental Material 1.
Inclusion and exclusion criteria
The inclusion criteria for satisfactorily selected articles were as follows: (1) the diagnosis for cancer was based mainly on pathological examination; (2) protein expression of STAT1 or phospho-STAT1 in tumor tissues was detected by immunohistochemistry or western blot; (3) a correlation between STAT1 expression and survival outcome was described; (4) the hazard ratio (HR) with 95% confidence interval (CI) or available data to extract the HR with 95% CI had been reported directly or provided; and (5) the study with the largest number of patients was selected if articles used overlapping samples. The exclusion criteria were as follows: (1) failure to meet any inclusion criteria; (2) review, meeting abstract, meta-analysis, case reports, patent, letters to the Editor; and (3) non-English articles.
Data collection
Data were collected from all selected papers, and the following characteristics were extracted: first author’s name, publication year, region of patients, number of patients, average age of patients, cancer type, method of STAT1 detection, cut-off value of STAT1 expression, follow-up time, Newcastle-Ottawa-Scale (NOS) score, and survival outcome. If a paper reported both multivariate HR and univariate HR, the former was extracted. Because DFS and progress-free survival (PFS) are very similar, the two outcomes were combined. If the HR was not provided in a paper, survival data were estimated by Engauge Digitizer V4.1 software and the method from Tierney et al. was applied to calculate HR and 95% CI. 27
Quality assessment
The NOS system was used to assess the quality of the included studies. 28 This system included the following three dimensions and eight items: selection of study groups, comparability of groups, and ascertainment of outcomes. Scores ⩾7 indicated a high-quality study, whereas scores <7 indicated a low-quality study. The results were measured using Review Manager 5.2 software.
Statistical analysis
Pooled HRs and 95% CIs were calculated using Stata version 12.0 (Stata Corporation, College Station, TX, USA). The random-effect model was used to determine the pooled HRs and 95% CIs for three endpoint outcomes: OS, DFS, and DSS. Heterogeneity among studies was tested by performing the Cochrane’s Q test and Higgins I-squared statistics (I2). 29 When heterogeneity was significant (p < 0.10 or I2 > 50%), a random-effect model was applied to estimate the HR. Otherwise, a fixed-effect model was used. 30 In order to explore the source of heterogeneity, we also performed a subgroup analysis using two different models. Publication bias was assessed quantitatively using Begg’s test and Egger’s test. 31 When publication bias existed, the Duval and Tweedie’s trim and fill method was used to calibrate the effect. 32 In addition, we performed a sensitivity analysis in which one study at a time was removed to evaluate the stability of pooled results. In this study, a two-sided p-value of <0.05 was considered to be statistically significant.
Extraction and analysis of TCGA datasets
The transcriptome profiling and clinical data of 24 types of cancer patients were obtained from The Cancer Genome Atlas (TCGA) database (https://www.cancer.gov/tcga). The expression of STAT1, pathological grade and stage, and survival data were extracted for further analysis. The Wilcoxon rank-sum test was used to analyze the expression of STAT1 in non-paired samples and the Wilcoxon’s signed-rank test was used for the paired samples. Kaplan-Meier survival analyses were conducted according to the survival data of patients in the TCGA database. The Kaplan–Meier OS curve with a cut-off value of the median expression of STAT1 was plotted. The Kruskal–Wallis test and Wilcoxon signed-rank test were applied to evaluate relationships between STAT1 expression and clinicopathologic features. All statistical analyses and plots were generated using software R (version 3.5.1) (http://www.r-project.org/).
Results
Search results and study characteristics
The data related to STAT1 expression and the prognosis of patients with solid cancer were retrieved from 1122 articles after PubMed, Web of Science, and Embase databases search (Figure 1). A total of 2839 patients from 15 published articles were included in the current study after carefully screening and evaluating the titles, abstracts, and full text.17,33–46 The sample size in all included studies was measured and found to be between 33 and 511 with a median of 130. Among all the cohorts, 5 were Asian, whereas 10 were non-Asian. The types of cancer included high-grade serous ovarian cancer (n = 3), colorectal cancer (n = 2), lung cancer (n = 2), oral squamous cell carcinoma (n = 2), cervical cancer (n = 1), breast cancer (n = 1), pancreatic cancer (n = 1), esophageal squamous cell carcinoma (n = 1), sarcoma (n = 1), and carcinoid tumors (n = 1). Among the 15 studies, the HR of OS was measured in 11 articles and the HRs of DFS and DSS were evaluated in 5 and 3 articles, respectively. The main characteristics of the enrolled studies are presented in Table 1. The quality of the overall methodology of 15 studies was evaluated by NOS. Most of the studies were of high methodological quality and only a few studies lacked details after assessment of results in each individual study (Figure 2A and B).
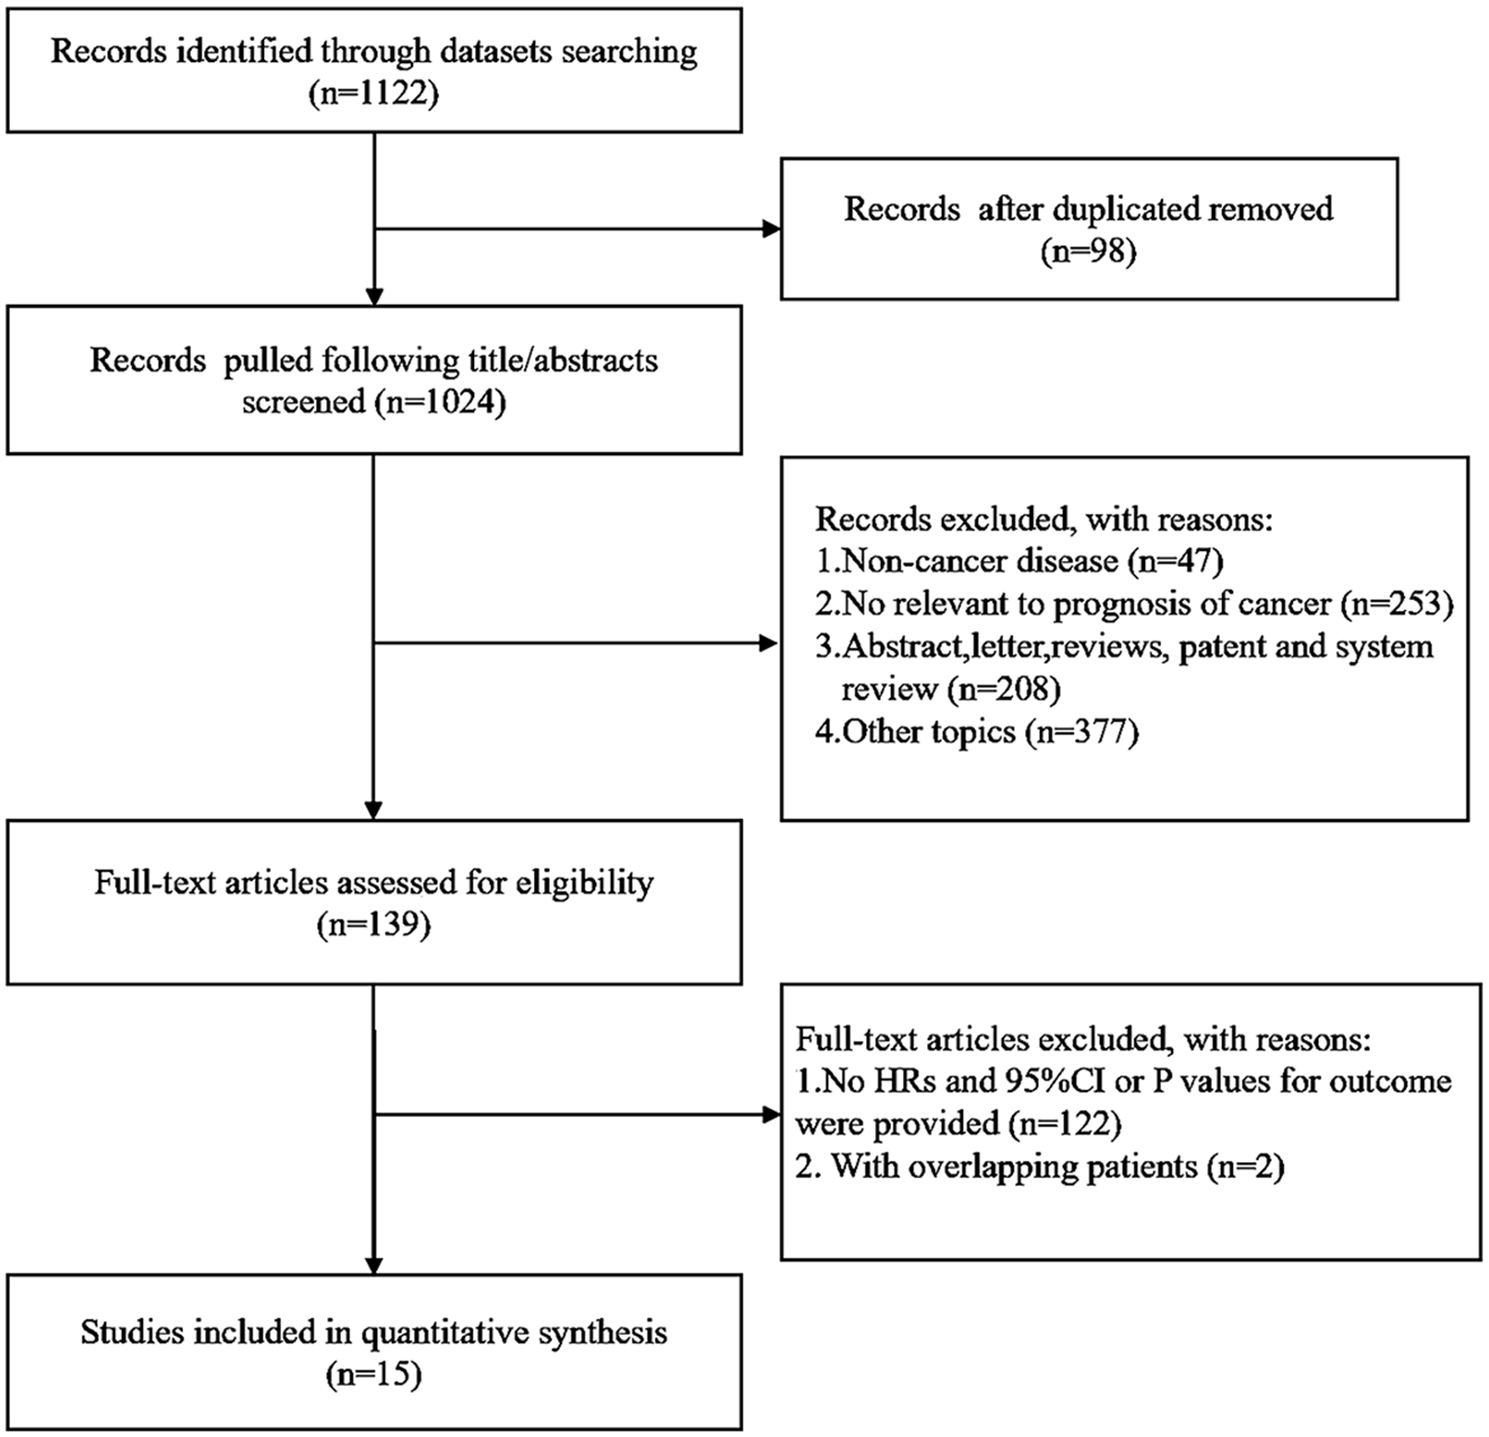
Flow chart of the study design and process.
Main characteristics of the eligible studies.
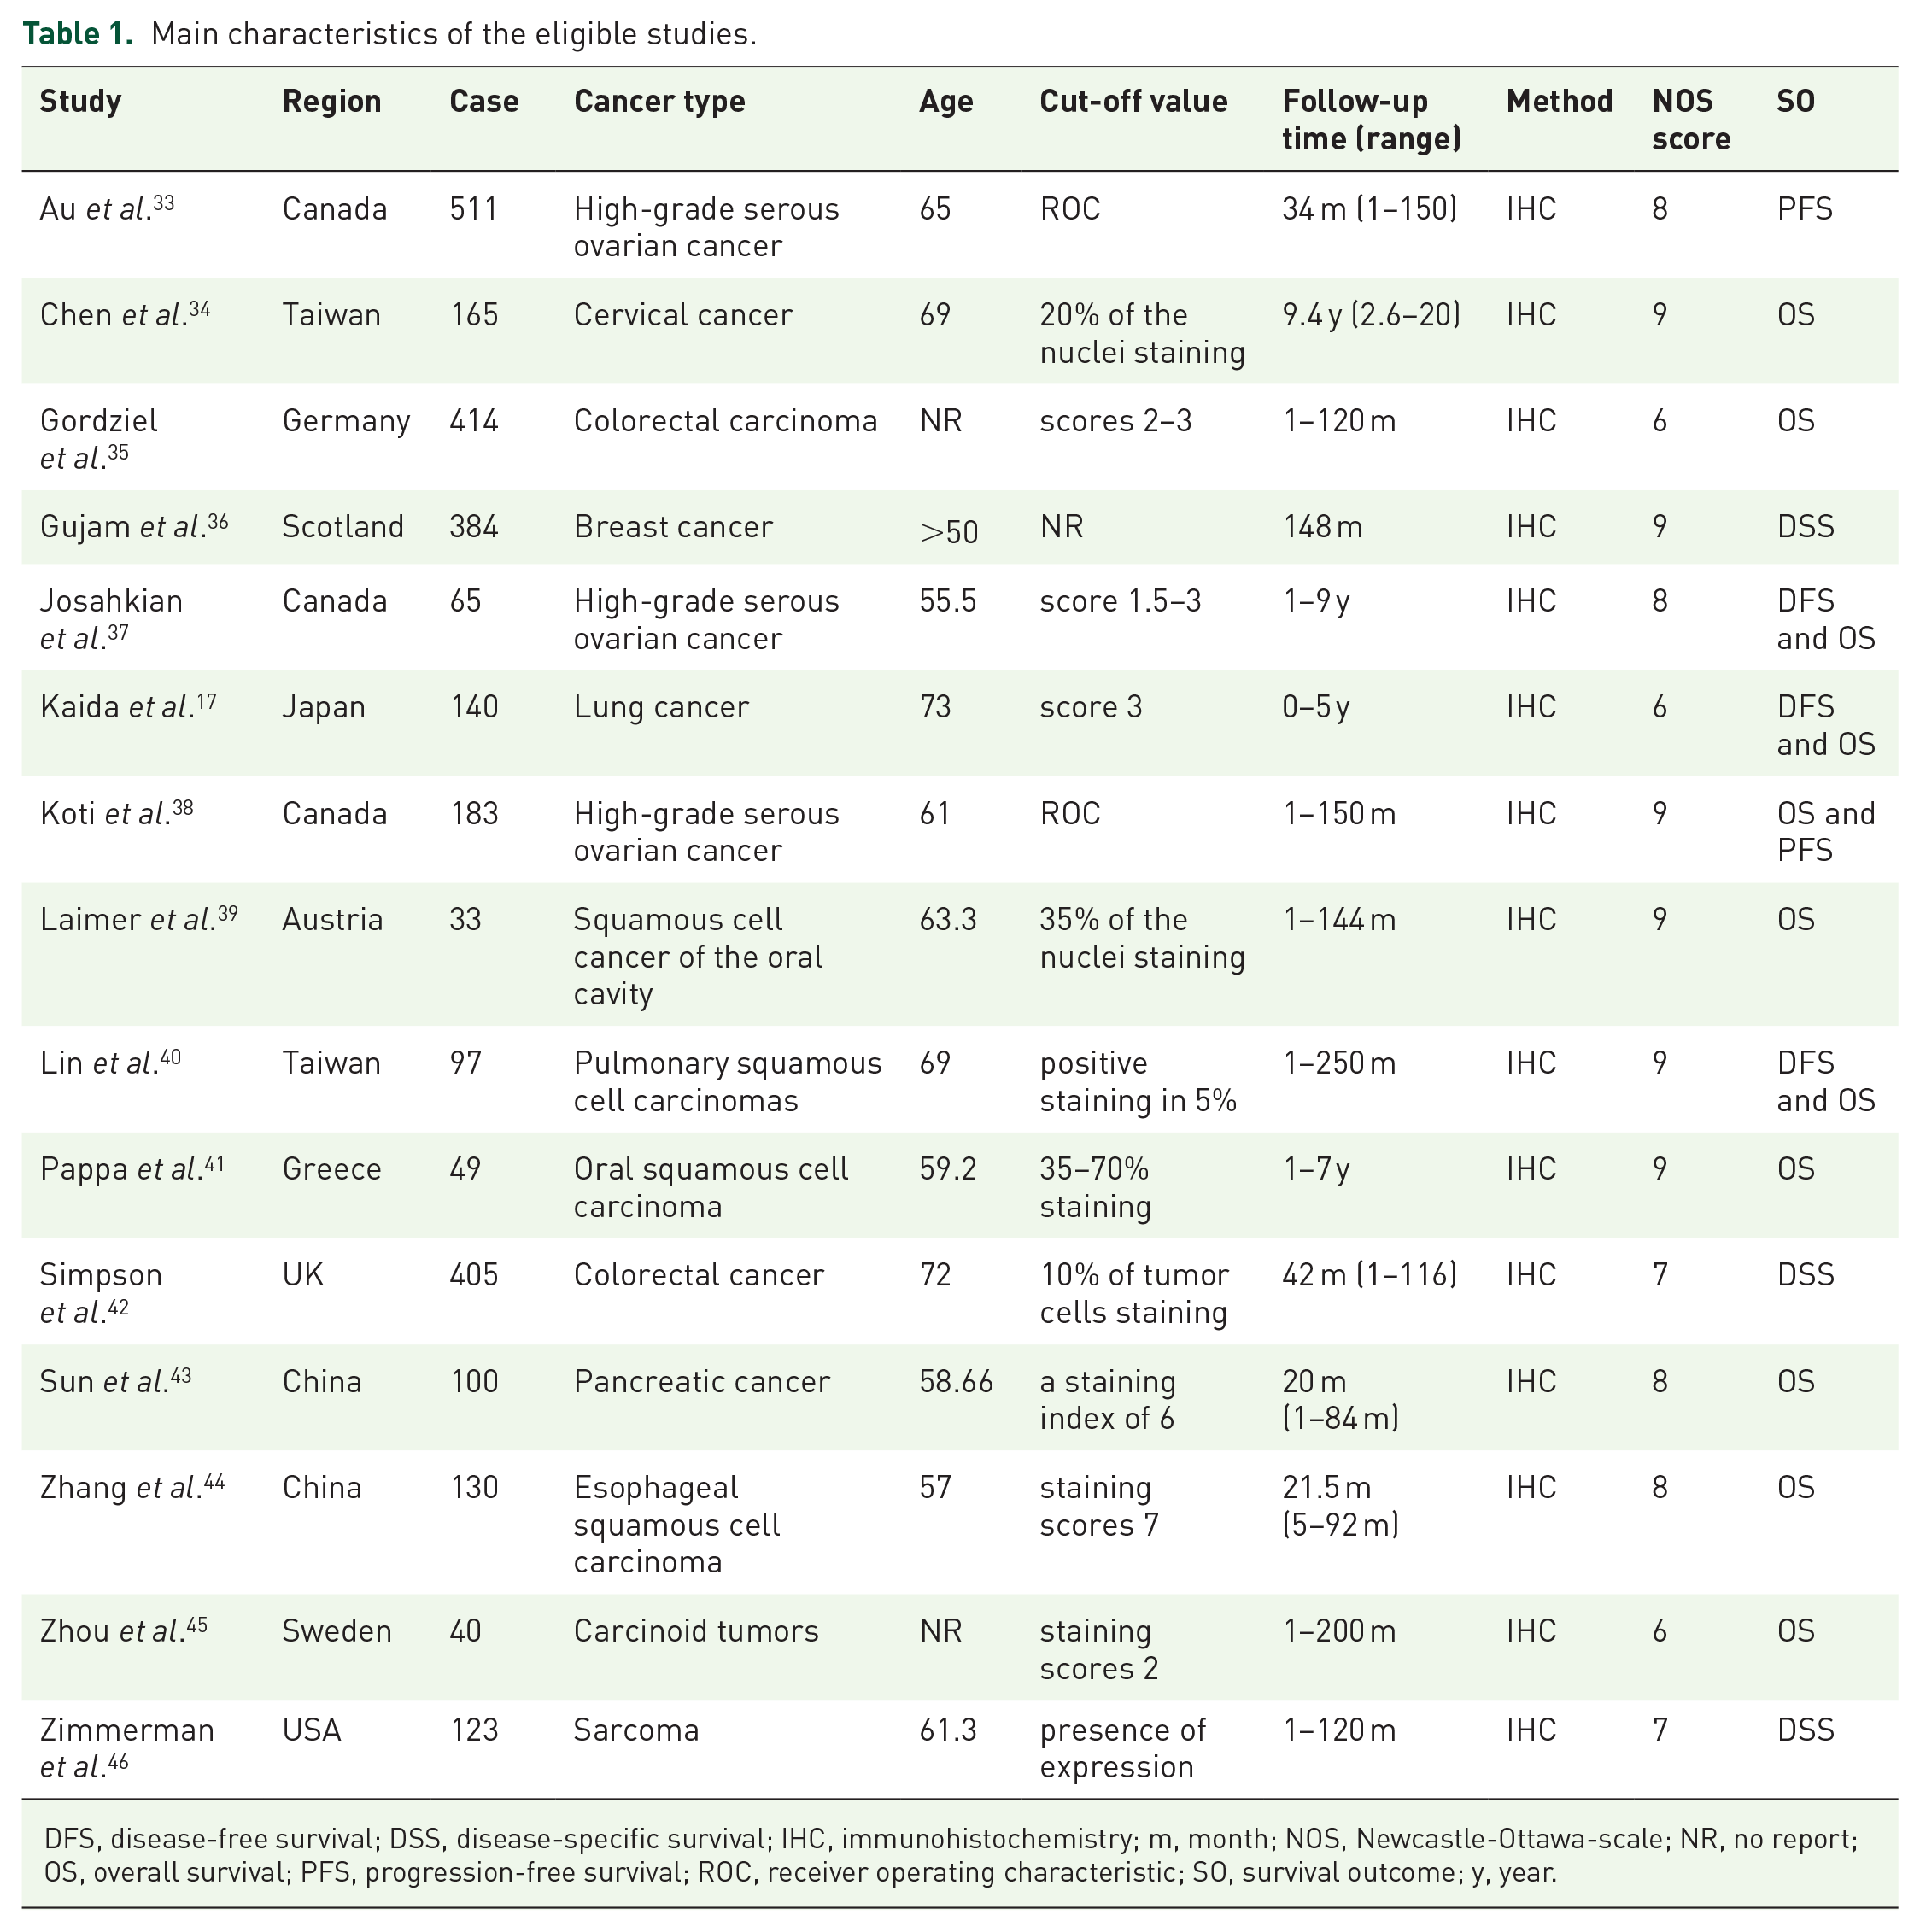
DFS, disease-free survival; DSS, disease-specific survival; IHC, immunohistochemistry; m, month; NOS, Newcastle-Ottawa-scale; NR, no report; OS, overall survival; PFS, progression-free survival; ROC, receiver operating characteristic; SO, survival outcome; y, year.

Quantitative assessment. (A) Risk of bias summary for each included study according to the NOS system. (B) Risk of bias graph by reviewing authors’ judgments about each risk of bias item presented as percentages across all included studies according to the NOS scores.
Correlation between STAT1 expression and prognosis
The OS was reported in 11 studies with 1416 cancer patients. Our analysis revealed that highly expressed STAT1 was a positive predictor for OS among cancer patients (HR = 0.604, 95% CI = 0.431–0.846, p = 0.003) (Figure 3). This pooled analysis was conducted by the random-effect model because of significant heterogeneity (I2 = 75.6%, p = 0.000). The effect of highly expressed STAT1 on DFS was evaluated in five studies with 831 patients. We used a random-effect model to calculate the pooled HRs and 95% CIs because of the significant heterogeneity (I2 = 76.2%, p = 0.002). The pooled result revealed that cancer patients with highly expressed STAT1 had longer DFS (HR = 0.766, 95% CI = 0.570–1.029), but there was no statistical significance (p = 0.077) (Figure 4A). Next, we found that DSS was measured in three studies with 912 cancer patients. A fixed-effect model was applied to calculate the pooled HRs and 95% CIs because of the slight heterogeneity (I2 = 40.6%, p = 0.186). The pooled results indicated a positive correlation between highly expressed STAT1 and longer DSS (HR = 0.650, 95% CI = 0.512–0.825, p = 0.000) (Figure 4B).

Forest plot of the association between STAT1 expression and OS.

Forest plot of the association between DFS/PFS and DSS. (A) Association between STAT1 expression and DFS/PFS in patients with solid cancer. (B) Association between STAT1 expression and DSS in patients with solid cancer.
Subgroup analyses of OS with STAT1 positivity
To further explore sources of heterogeneity, we performed a subgroup analysis of OS data using two different models. The results of four subgroup analyses are shown in Table 2. The first subgroup analyses by region revealed that the pooled HRs were 0.630 (95% CI = 0.337–1.178, p = 0.148) for Asian patients (five studies) and 0.666 (95% CI = 0.431–0.846, p = 0.000) for Non-Asian patients (six studies). The second subgroup analyses by sample size showed that the pooled HRs were 0.455 (95% CI = 0.279–0.743, p = 0.002) for sample size <100 (five studies) and 0.865 (95% CI = 0.751–0.997, p = 0.045) for sample size ⩾100 (six studies). The third subgroup analyses by stratification analytic type resulted that pooled HRs were 0.590 (95% CI = 0.429–0.810, p = 0.001) for univariate analysis (six studies) and 0.608 (95% CI = 0.317–1.165, p = 0.134) for multivariate analysis (five studies). The fourth subgroup analyses by cancer types displayed that highly expressed STAT1 was associated with favorable OS of patients with high-grade serous ovarian cancer (HR = 0.683, 95% CI = 0.497–0.938, p = 0.019) (2 studies), oral squamous cell carcinoma (HR = 0.486, 95% CI = 0.241–0.980, p = 0.044) (two studies), and another five cancers (pooled HR = 0.542, 95% CI = 0.361–0.813, p = 0.003), but not in lung cancer (HR = 1.223, 95% CI = 0.996–1.501, p = 0.055) (two studies).
Subgroup analysis of OS.

CI, confidence interval; HGSC, high-grade serous ovarian cancer; HR, hazard ratio; LC, lung cancer; N, number of studies; OSCC, oral squamous cell carcinoma; Ph, p-value of Q test for heterogeneity.
Publication bias and sensitivity analysis
Publication bias was evaluated by a funnel plot for OS. The Egger’s test for OS revealed the existence of publication bias (p = 0.011). Therefore, we conducted the trim and fill method to adjust the effect of potential publication bias of OS. The funnel plot showed that there was no significant asymmetry without adding or deleting any individual study (Figure 5A). In addition, the shape of the funnel plot did not show evident asymmetry for DFS/PFS (Figure 5B). These data indicate that there was no obvious publication bias confirmed by a Begg’s test (p = 0.624) and Egger’s test (p = 0.069). Next, sensitivity analyses were performed through the sequential removal of a single study to validate the robustness of study-influence on OS and DFS/PFS. The removal of any individual study did not change the pooled outcome on OS and DFS/PFS (Figure 6A and B), demonstrating that the results of this meta-analysis were stable and no individual study dominated in overall analyses.

Funnel plot of publication biases. (A) Trim and fill method for OS. (B) Begg’s funnel plot analysis for DFS and PFS. Each circle represents a study.
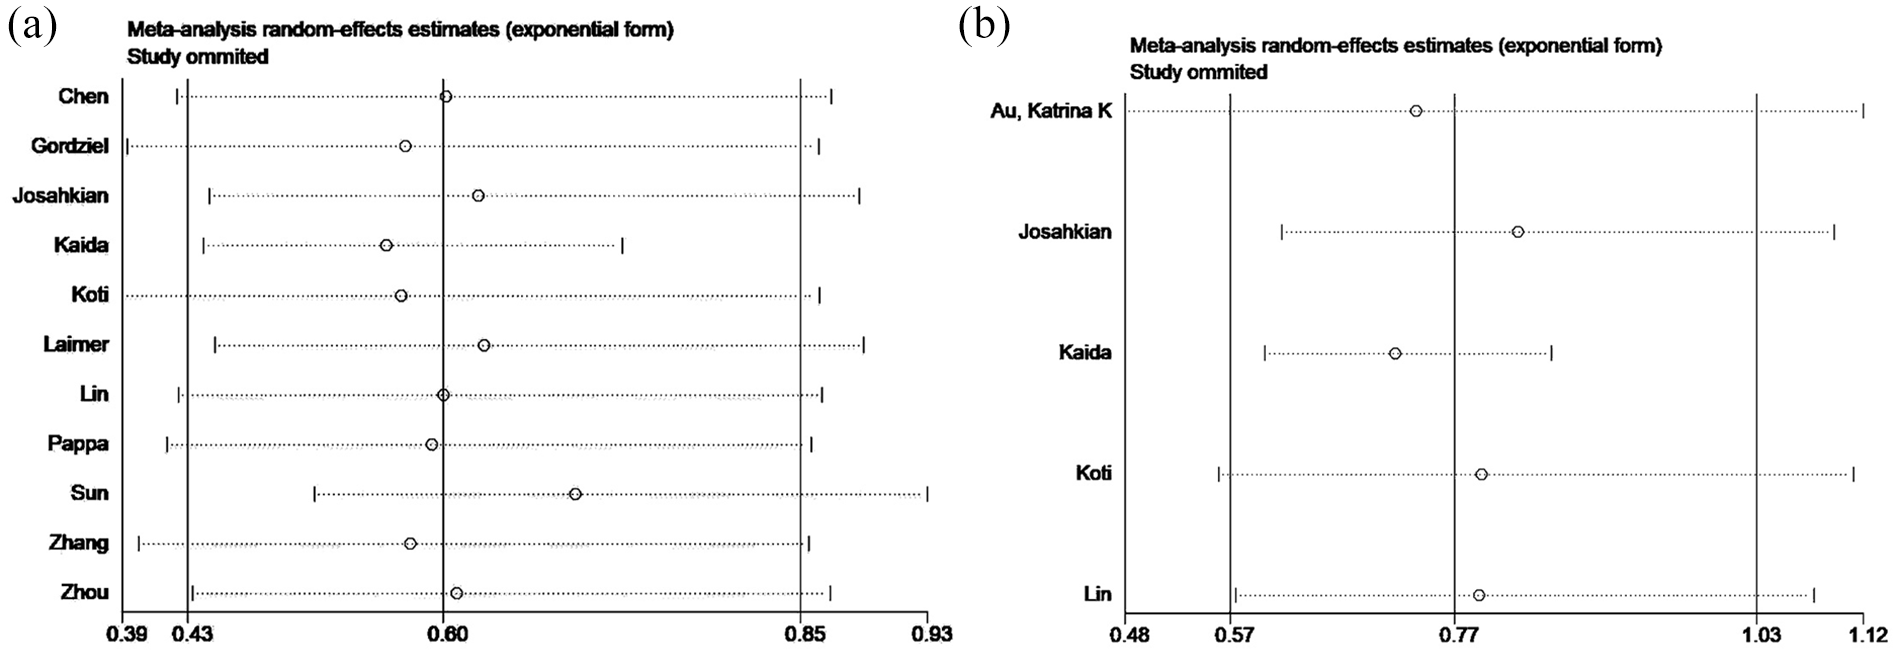
Sensitivity analysis of the study. (A) Sensitivity analysis of OS. (B) Sensitivity analysis of DFS and PFS.
Association between STAT1 expression and OS of patients with cancers
The OS data of patients with expression of STAT1 in different cancers were extracted from the TCGA research network. As shown in Figure 7, STAT1 mRNA was detected in 18 types of cancers. Compared with normal tissue samples, STAT1 was overexpressed in 14 malignant tumors, including bladder, breast, cervical, colon, and kidney cancers; esophageal, head and neck squamous cell, hepatocellular, lung squamous cell, thyroid, and uterine corpus endometrial carcinomas; lung, rectum, and stomach adenocarcinomas. No obvious difference in STAT1 expression between cancer and normal tissues was found in pancreatic cancer, pheochromocytoma, prostatic cancer, and sarcoma. By comparing paired tissue samples from the TCGA database, the analytic results showed that STAT1 expression was significantly higher in 12 types of cancer tissues than in their adjacent normal tissues, including bladder cancer, breast cancer, colon adenocarcinoma, esophageal carcinoma, head and neck squamous cell carcinoma, hepatocellular carcinoma, lung adenocarcinoma, lung squamous cell carcinoma, rectum adenocarcinoma, stomach adenocarcinoma, thyroid carcinoma, and uterine corpus endometrial carcinoma, except kidney and prostate cancers (Supplemental Figure S1). In the survival analysis of eight datasets generated by the TCGA research network, we found that highly expressed STAT1 was correlated with poor OS in patients with renal carcinoma, brain lower grade glioma, lung adenocarcinoma, and pancreatic cancer. However, in ovarian cancer, rectum adenocarcinoma, sarcoma, and skin cutaneous melanoma, highly expressed STAT1 favored long OS of patients (Figure 8).

Expression of STAT1 mRNA in malignant tumor tissues (red) and corresponding normal tissues (blue). Data are extracted from TCGA datasets.

Kaplan–Meier survival curves of cancer patients. Data are extracted from TCGA datasets.
Associations between STAT1 expression and clinicopathologic features
The available clinical data of 24 types of cancer patients were extracted from the cancer cohort studies in the TCGA database along with clinicopathologic features, including stage, grade, and TNM (tumor, node, metastasis) classification. In particular, we found that increased STAT1 expression was associated with higher grade, later stage, large tumor size, and lymph node and distant metastasis in renal carcinoma (Supplemental Figure S2). Further analyses of the association between STAT1 expression and tumor grades showed that highly expressed STAT1 was associated with a high grade of tumor in bladder urothelial carcinoma, cervical squamous cell carcinoma, lower grade glioma, liver cancer, pancreatic adenocarcinoma, gastric cancer, and uterine corpus endometrial carcinoma (Supplemental Figure S3). However, STAT1 expression was decreased in the later stage of colon adenocarcinoma, head and neck squamous cell carcinoma, skin cutaneous melanoma, and thyroid carcinoma (Supplemental Figure S4). In some cancer patients, the expression of STAT1 was not associated with OS analyzed from the TCGA database (Supplemental Figure S5).
Discussion
The current report shows, for the first time, the systematic analysis of correlations between the expression of STAT1 and the prognosis of patients with solid cancer. This meta-analysis of published clinical studies, with a detailed search strategy and selection criteria, assessed the significance of STAT1 as a prognostic factor. The outcomes after analyses indicate that expression of STAT1 is associated with survival of patients based on their cancer type.
Recent studies have shown that STAT1 is involved in aggressive biological behaviors of cancers,16,47 remodeling of the tumor microenvironment, 48 stemness, 49 and chemotherapeutic resistance. 50 In view of the important function of STAT1 in cancer, several clinical studies have suggested that STAT1 might be a potential marker of prognosis for tumor patients,51,52 but each individual study may not be sufficient to draw a conclusion. Thus, the outcome of the prognostic role of STAT1 in the survival of patients with solid cancer still remains controversial.
STAT1 has two faces in human cancer. It can be a tumor suppressor or an oncoprotein. The tumor-suppressive role of STAT1 is driven by findings that the reconstitution of STAT1 in STAT1-deficient murine fibrosarcoma cells significantly suppressed tumorigenicity and metastasis in nude mice. 53 The high expression of STAT1 is reported to have a good prognosis compared with the low or negative expression of STAT1 in some cancer patients. 37 However, on the other hand, two studies have identified high STAT1 mRNA levels associated with poor prognosis, tumor progression, and worse survival in breast cancer.54,55
Through the data analyses of the TCGA research network, we further confirmed the prognostic value of STAT1 in patients with solid cancer. TCGA datasets reveal that, at the mRNA level, STAT1 is upregulated in most cancers, including bladder, breast, cervical, colorectal, esophageal, liver, stomach, thyroid, lung, uterus cancers, and head and neck squamous cell carcinoma. The survival analysis of TCGA data revealed that highly expressed STAT1 was associated with longer OS in ovarian cancer, rectum adenocarcinoma, sarcoma, and skin cutaneous melanoma. Further, our subgroup analysis of OS showed that an increased STAT1 favored longer OS in patients with high-grade ovarian cancer and oral squamous cell carcinoma. Again, on the other hand, highly expressed STAT1 may predict poor OS in patients with renal carcinoma, lung adenocarcinoma, pancreatic adenocarcinoma, and lower grade glioma. These results are in agreement with previous reports of the tumor-promoting role of STAT1 in malignant pleural mesothelioma and late-stage melanoma.56,57 Taking a comprehensive view of whether STAT1 has favorable or adverse effects, the prognostic factor of STAT1 most likely depends on cancer type. The different outcomes observed in this report may be due to the aberrant activation of STAT1, which has been found in different cancers such as ovarian cancer, breast cancer, glioma, pleural mesothelioma, squamous cell cancer of the oral cavity.15,39,56,58,59 Thus, TCGA data analysis is consistent with the conclusion of our meta-analysis.
Several mechanisms at multiple levels may explain the controversial results observed in this report. The tumor suppressor role of STAT1 is probably associated with its function in the immune system. Immune cells secrete interferons that lead to STAT1 activation, resulting in immunosurveillance action. 60 IFN-induced STAT1 can activate chemokines such as CXCL9, CXCL10, and CXCL11 that recruit CD8+ T cells to have antitumor immunity. 33 Moreover, STAT1 as a transcription factor induces the transcription of cell cycle-related and apoptosis-related genes, and genes of the death receptor and their ligands. For instance, STAT1 can arrest the cell cycle in response to IFNγ through direct interaction with cyclin D1 and CDK4 proteins. 61 IFNγ/STAT1-induced expression of caspases 1 and 8 is reported in cancer cell lines, where STAT1 regulates Bcl-2 family members including Bcl-2, Bcl-xl, Bax, and Bak.62–64 STAT1 promotes the expression of the death receptor Fas and their ligand FasL in hepatocellular carcinoma and colon adenocarcinoma.65,66 In addition, STAT1 is also reported to regulate angiogenesis in glioma, and overexpression of STAT1 leads to the downregulation of HIF-1α and VEGF-A under conditions of hypoxia. 59 Furthermore, our previous work has demonstrated that STAT1 can bind to the transforming growth factor beta (TGF-β) receptor, and that overexpression of STAT1 weakens the TGF-β signaling pathway in ovarian cancer cells, 15 implying that highly expressed STAT1 in ovarian cancer may suppress TGF-β-induced metastasis, which would favor the OS of patients with ovarian cancer. Nevertheless, the short or long survival of cancer patients may depend on the cancer type, disease stage, the progression of cancer development, and integrated signaling pathways.
STAT1 exists in two isoforms. 15 Full-length STAT1α isoform has traditionally been considered as the physiologically active form of STAT1 after phosphorylation at Tyr701 and Ser727 residues, and the truncated STAT1β isoform is considered as a physiological inhibitor of STAT1. The expression and activation ratio of STAT1α and STAT1β in different cancer types may impact cancer progression and promote a ‘switch’ from tumor cell proliferation to a death phenotype. It has been shown that overexpressed STAT1β represses STAT1α activation by inhibiting Tyr701 phosphorylation, DNA-binding, and transcriptional activity in human B cells. 67 The mechanism whereby STAT1β inhibits STAT1α is incompletely understood but may be explained by competitive binding to the same DNA binding sites and/or receptors. Interestingly, another study shows that STAT1β protects STAT1α from degradation and enhances STAT1 function in esophageal squamous cell carcinoma. 44 This phenomenon is similar to the interplay between STAT1 and STAT3 in colorectal cancer. STAT3-mediated transcription can be antagonized by STAT1. 12 The expression ratio of two STATs can be evaluated for tumor progression regardless of their role as independent transcription factors. Nevertheless, when searching for α and β isoforms rather than total STAT1, no report was obtained from the public literature about the correlation between the expression of STAT1α or STAT1β isoforms and the survival of patients with solid cancer.
Several limitations to this study should be pointed out. First, significant heterogeneity was found for the OS endpoint. Therefore, subgroup analysis was used to explore the source of heterogeneity, which demonstrated high variabilities, such as region, sample size, and cancer type. Second, the cut-off value of STAT1 expression from the immunohistochemistry was varied among studies. Therefore, there should be a uniform criterion to define STAT1 expression as positive or negative in future. Third, some papers did not present HRs directly. Methods for estimating HRs with corresponding 95% CIs by the Engauge Digitizer software might not be accurate enough. Fourth, the Egger test revealed that the correlation between STAT1 expression and OS might exhibit publication bias. The prognostic role of STAT1 in OS may potentially be exaggerated.
Conclusion
This study has shown that STAT1 is identified to have prognostic value as STAT1 is a potential marker of prognosis in patients with solid cancer. Highly expressed STAT1 may predict prognosis in cancer patients based on their tumor types.
Supplemental Material
Supplemental_Figure_1 – Supplemental material for Predicting STAT1 as a prognostic marker in patients with solid cancer
Supplemental material, Supplemental_Figure_1 for Predicting STAT1 as a prognostic marker in patients with solid cancer by Jinguo Zhang, Fanchen Wang, Fangran Liu and Guoxiong Xu in Therapeutic Advances in Medical Oncology
Supplemental Material
Supplemental_Figure_2 – Supplemental material for Predicting STAT1 as a prognostic marker in patients with solid cancer
Supplemental material, Supplemental_Figure_2 for Predicting STAT1 as a prognostic marker in patients with solid cancer by Jinguo Zhang, Fanchen Wang, Fangran Liu and Guoxiong Xu in Therapeutic Advances in Medical Oncology
Supplemental Material
Supplemental_Figure_3 – Supplemental material for Predicting STAT1 as a prognostic marker in patients with solid cancer
Supplemental material, Supplemental_Figure_3 for Predicting STAT1 as a prognostic marker in patients with solid cancer by Jinguo Zhang, Fanchen Wang, Fangran Liu and Guoxiong Xu in Therapeutic Advances in Medical Oncology
Supplemental Material
Supplemental_Figure_4 – Supplemental material for Predicting STAT1 as a prognostic marker in patients with solid cancer
Supplemental material, Supplemental_Figure_4 for Predicting STAT1 as a prognostic marker in patients with solid cancer by Jinguo Zhang, Fanchen Wang, Fangran Liu and Guoxiong Xu in Therapeutic Advances in Medical Oncology
Supplemental Material
Supplemental_Material_1 – Supplemental material for Predicting STAT1 as a prognostic marker in patients with solid cancer
Supplemental material, Supplemental_Material_1 for Predicting STAT1 as a prognostic marker in patients with solid cancer by Jinguo Zhang, Fanchen Wang, Fangran Liu and Guoxiong Xu in Therapeutic Advances in Medical Oncology
Supplemental Material
Supplementary_Figure_5 – Supplemental material for Predicting STAT1 as a prognostic marker in patients with solid cancer
Supplemental material, Supplementary_Figure_5 for Predicting STAT1 as a prognostic marker in patients with solid cancer by Jinguo Zhang, Fanchen Wang, Fangran Liu and Guoxiong Xu in Therapeutic Advances in Medical Oncology
Footnotes
Author contributions
JZ, FW, and FL conducted the literature search and screening. JZ and FW performed the data analyses. JZ prepared figures and wrote the draft of the manuscript. GX designed the study and wrote and edited the paper. All authors read and approved the final version of the manuscript.
Conflict of interest statement
The authors declare that there is no conflict of interest.
Funding
The authors disclosed receipt of the following financial support for the research, authorship, and/or publication of this article: The study was supported by grants from the National Natural Science Foundation of China (grant no. 81872121), the Natural Science Foundation of Shanghai (grant no. 17ZR1404100), and the Shanghai Municipal Commission of Health and Family Planning (grant no. 201640287) to GX.
Supplemental material
Supplemental material for this article is available online.
References
Supplementary Material
Please find the following supplemental material available below.
For Open Access articles published under a Creative Commons License, all supplemental material carries the same license as the article it is associated with.
For non-Open Access articles published, all supplemental material carries a non-exclusive license, and permission requests for re-use of supplemental material or any part of supplemental material shall be sent directly to the copyright owner as specified in the copyright notice associated with the article.