
Abstract
Background:
The high prevalence of type 2 diabetes mellitus (DM) among patients with colorectal cancer (CRC) is becoming a serious public health concern worldwide. FOLFOX4 chemotherapy is one of the most widely used adjuvant therapies in patients with stage III colon cancer after surgical resection. However, chemotherapy resistance is associated with a poor prognosis. The prognostic impact of high blood sugar levels on oxaliplatin resistance in CRC patients is an unexplored topic.
Methods:
In total, 157 patients with stage III CRC were classified according to their fasting blood sugar level (⩾126 or <126 mg/dl). Clinicopathological features and oxaliplatin chemoresistance/survival outcome of the two groups were compared. In vitro cell proliferation assay was performed through
Results:
Multivariate analysis results revealed that high blood sugar level was a significantly independent prognostic factor of disease-free survival and overall survival (both p < 0.05), but not DM history. After metformin administration, enhanced proliferation of CRC cells (HT-29, HCT-116, SW480, and SW620) with
Conclusions:
Hyperglycemia can affect clinical outcomes in stage III CRC patients receiving adjuvant chemotherapy, and the mechanism underlying oxaliplatin resistance is possibly associated with increased phosphorylation of SMAD3 and MYC and upregulation of EHMT2 expression.
Introduction
Colorectal cancer (CRC) is a significant public health problem. Annually, more than 1.36 million patients are diagnosed with CRC worldwide; approximately 694,000 CRC-associated mortalities occur each year, accounting for 8.5% of all cancer-related deaths and making CRC the third most common cause of death. 1 Although radical surgical resection and oxaliplatin-based adjuvant chemotherapy are standard therapeutic strategies, some patients receiving adjuvant chemotherapy ultimately develop recurrence or metastasis, representing a key barrier to the efficacy of CRC treatment.2–5 No reliable biomarker or indicator is currently known for predicting tumor recurrence or chemoresistance in CRC patients after oxaliplatin-based chemotherapy, and seeking new predictive biomarkers is thus warranted to prevent drug resistance and thereby improve patient prognoses.6–8
In recent decades, postoperative adjuvant chemotherapy for colon cancer constitutes a major clinical advance in oncology.5,9 Adjuvant FOLFOX chemotherapy, which consists of leucovorin (LV), 5-fluorouracil (5-FU), and oxaliplatin, is one of the most widely used regimens after surgical resection. 10 In a multicenter international study on the use of FOLFOX4 as adjuvant treatment for colon cancer (NCT00275210), FOLFOX4 was demonstrated to prolong overall survival (OS) in patients with stage III colon cancer compared with patients who received 5-FU and LV without oxaliplatin.4,5 The addition of oxaliplatin to a regimen of 5-FU and LV is known as FOLFOX, which has become the gold standard adjuvant therapy for patients with stage III colon cancer. 5
Proper control of metabolic homeostasis is crucial for maintaining human physiology and health. The effects of diabetes mellitus (DM) on CRC have been debated; for instance, meta-analyses have consistently indicated that type 2 DM is an independent risk factor for developing CRC,11,12 and an increase in glycolytic activity by malignant tumor cells in vivo and in vitro has also been demonstrated. 13 Among Taiwanese patients with CRC, DM patients had a higher incidence of second malignancy than non-DM patients, 14 and DM patients have an increased risk of CRC and poorer outcomes compared with non-DM patients.15–17 The potential impact on the clinical outcome of CRC patients with DM has received much attention. Under hyperglycemia, high glucose modulated the cytotoxicity of 5-FU in human colon cancer cells, 18 and diminished the chemotherapeutic effect of oxaliplatin plus 5-FU, leading to shorter survival in an animal model. 19
Although FOLFOX has become a standard chemotherapeutic regimen, no relevant information is currently available regarding the predictive value of blood sugar levels for CRC recurrence or chemoresistance after oxaliplatin-based chemotherapy, and the efficacy of oxaliplatin chemotherapy under hyperglycemia remains unclear. The aim of this study was to evaluate whether high blood sugar levels could affect the efficacy of adjuvant FOLFOX6 chemotherapy in patients with stage III CRC, as well as to explore the underlying signaling pathway of chemoresistence.
Materials and methods
Patients and tumor samples
In this retrospective study, patients with stage III CRC who had received oxaliplatin treatment and provided signed informed consent were included, but patients without records of fasting blood sugar (FBS) levels or incomplete medical records were excluded. Demographic information was obtained from 157 patients with primary stage III CRC 20 who received adjuvant FOLFOX6 chemotherapy at single institution in Taiwan between November 2009 and September 2015. Each FOLFOX cycle consisted of an oxaliplatin (85 mg/m2) and folinic acid (400 mg/m2) infusion on day 1, followed by a 46-h infusion of 5-FU (2800 mg/m2) repeated every 2 weeks. 10 A total of 157 patients completed the adjuvant FOLFOX6 therapy (biweekly × 12 cycles for 6 months).
Impaired carbohydrate metabolism was defined as one of the ADA 2003 diagnostic criteria for diabetes (normal: <110 mg/dl; impaired fasting glucose: 110–125 mg/dl; fasting plasma glucose: ⩾126 mg/dl).21,22 Data of FBS levels were collected from all 157 CRC patients before CRC surgery. A total of 112 patients had fasting glucose levels between 75 and 125 mg/dl (<126 mg/dl, i.e. low blood glucose) and 45 had levels between 126 and 360 mg/dl (⩾126 mg/dl, i.e. high blood glucose). Diagnoses of DM were based on the patient’s chart history of DM or previous use of antihyperglycemic agents for DM. All patients were unrelated ethnic Chinese residents of Taiwan. Each patient provided written informed consent for the collection and use of data/samples for research and publication of their case details. Furthermore, all patient data were anonymized. The study protocol was approved by Kaohsiung Medical University Chung-Ho Memorial Hospital Institutional Review Board [Protocol Number: KMUHIRB-2012-04-02(I)]. All patients received follow up until either their death or December 2017. Oxaliplatin resistance was defined as recurrence or metastasis of CRC within 1 year after introduction of the FOLFOX6 regimen. The median follow-up time was 41.5 months (8–98 months).
Cell culture
Human colon carcinoma cell lines, namely HT-29, HCT-116, SW480, and SW620, were purchased from ATCC (Manassas, VA, USA) and cultured in low-glucose Dulbecco’s modified Eagle medium [5 mM
Analysis of cell proliferation
The CRC cell lines were seeded in 96-well plates in baseline-glucose Dulbecco’s modified Eagle medium [
Glycolysis-related mRNA or signaling pathway prediction
To investigate the signaling pathway of glycolysis-related mRNAs or target genes, we used the Kyoto Encyclopedia of Genes and Genomes pathway program (http://www.genome.jp/kegg/kegg2.html) and Search Tool for the Retrieval of Interacting Genes/Proteins network program (https://string-db.org/).
RNA extraction and mRNA quantitative assay
According to the manufacturer’s instructions, approximately 107 cells were lysed in 1 ml of TRIzol reagent (Invitrogen). DNase treatment (Qiagen, Hamburg, Germany) was performed, and total RNA was purified with Qiagen RNeasy Columns (Qiagen). With random hexamer primers, cDNAs were synthesized from 1 μg of total RNA using reverse transcriptase (Applied Biosystems Inc., Foster City, CA, USA) and real-time polymerase chain reaction (RT-PCR) with SYBR Green (Applied Biosystems Inc.).
Western blotting assay and antibody reagents
Total proteins of treated SW620 cells were extracted using RIPA lysis buffer (Millipore, Billerica, MA, USA) and quantitated with a BCA protein assay kit (Thermo Fisher Scientific Inc., Waltham, MA, USA). Next, 25 µg protein was resolved by SDS-PAGE, transferred onto a PVDF membrane (Millipore) and blocked with skim milk solution for 2 h. The membrane was then incubated with antibodies (1:1000 diluted) against euchromatic histone lysine methyltransferase 2 (EHMT2, GTX128164, GeneTex, Inc), SMAD3 (#9513, Cell Signaling Technology, Inc.), p-SMAD3 (#9520, Cell Signaling Technology, Inc.), MYC (#5605, Cell Signaling Technology, Inc.), and p-MYC (#13748, Cell Signaling Technology, Inc.) overnight at 4°C. Membranes were washed three times with TBST and incubated with a goat anti-rabbit secondary antibody (Sangon Biotech, Shanghai, China) for 2 h and washed three times with TBST. Immunoblot results were quantified using AlphaImager software (Alpha Innotech, San Leandro, CA, USA).
Statistical analysis
Following the setup of our previous study, 17 the sample size ratio was approximately 3:2 between the low-blood-sugar and high-blood-sugar groups. The 1-year relapse rate was 0.46 (46%) in the high-blood-sugar group and 0.27 (27%) in the low-blood-sugar group, with a significance level of 0.05 and a power of 80%. Eligible patients were divided into two groups based on their blood sugar level to reach an approximate total of 120 patients. All data were statistically analyzed using JMP software, version 10.0 (SAS Institute Inc., Cary, NC, USA). Continuous variables were presented as means ± standard deviation (SD), and dichotomous variables were denoted by numbers and percentages. A t test was used to analyze continuous variables. The Chi-square test was used for univariate statistical analysis where applicable, and a Cox regression hazard model was used for multivariate analyses of disease-free survival (DFS) and OS. DFS was defined as the time between the date of FOLFOX6 administration and the development of CRC recurrence or metastasis or the last follow-up visit. OS was defined as the time between the date of FOLFOX6 administration and death from any cause or the last follow-up visit. The survival plot was calculated using the Kaplan–Meier method, and a log-rank test was used to compare time-to-event distributions. A two-tailed p value of less than 0.05 was considered statistically significant.
Results
Demographic data and clinical outcome
Table 1 showed the demographic data of 157 stage II CRC patients (112 in the low blood glucose group versus 45 in the high blood glucose group), with a median blood sugar level of 105 mg/d, and median age of 63 years (20–93 years). In this retrospective study, 28 patients with CRC had a history of DM and received different DM medications (Glucophage, Diamicron MR, Januvia, etc.) to control their blood sugar levels. Eight of the 28 CRC patients that received medication were able to maintain their blood sugar levels at <126 mg/dl (Table 1). The patients with DM exhibited significantly higher blood sugar levels than patients without DM (p < 0.0001; Table 1). Table 1 also reveals significant differences in age (p = 0.019) and oxaliplatin resistance (p = 0.004) between the low-blood-glucose (<126 mg/dl) and high-blood-glucose (⩾126 mg/dl) groups; however, the two groups did not differ significantly in terms of other clinicopathological features such as sex, tumor size, tumor location, tumor invasion depth, lymph node metastasis, vascular invasion, perineural invasion, differentiation grade, or histological type (all p > 0.05).
Baseline characteristics of 157 stage III CRC patients after oxaliplatin therapy, based on serum blood glucose levels using univariate analysis.

A, Adenocarcinoma; AC ante cibum; DM diabetes mellitus; M, mucinous carcinoma; MD, moderately differentiated; PD, poorly differentiated S, Signet-ring cell carcinoma; UD, undifferentiated; WD, well differentiated.
AC (i.e. before eating) serum blood sugar level before surgery.
Confirmed diagnosis of DM before surgery.
Effect on DFS and OS
Table 2 presents the prognostic factors for DFS and OS in patients with stage III CRC according to univariate and multivariate analysis. Multivariate analysis showed high blood sugar level [p = 0.007, hazard ratio (HR): 1.820, 95% confidence interval (CI): 1.184–2.758] to be a poor independent prognostic factor of DFS, but no significant differences were found for other clinicopathological features such as sex, age, tumor invasion depth, tumor size, vascular invasion, perineural invasion, and DM history (all p > 0.05). Although patients with DM history were markedly associated with high blood sugar levels (p < 0.0001; Table 1), multivariate analysis showed that high blood sugar level (p = 0.007, HR: 1.820, 95% CI: 1.184–2.758), but not DM history (p = 0.396, HR: 0.801, 95% CI: 0.471–1.331; Table 2), was a poor independent prognostic factor for DFS.
Correlation of DFS and OS with clinicopathological features of 157 UICC stage III CRC patients by using Cox regression analysis.

AC, Ante cibum; CI: confidence interval; CRC, colorectal cancer; DM, diabetes mellitus, HR, hazard ratio; UICC, Union for International Cancer Control.
Multiple logistic regressions with or without adjustment for age, sex, tumor size, invasive depth, vascular invasion, perineural invasion, DM history and serum blood sugar of CRC patients.
AC (before eating) serum blood sugar level before surgery.
Regarding OS, multivariate analysis showed high blood sugar level (p = 0.002, HR: 1.985, 95% CI: 1.280–3.035) and invasive depth (p = 0.042, HR: 0.636, 95% CI: 0.418–0.983) to be poor independent prognostic factors, but no significant differences were found for other clinicopathological features such as sex, age, tumor size, vascular invasion, perineural invasion, and DM history (all p > 0.05). Overall, high blood sugar level was a significantly independent prognostic factor of DFS or OS, but DM history was not.
Effect of administration of glucose on colon cancer cell proliferation
Three
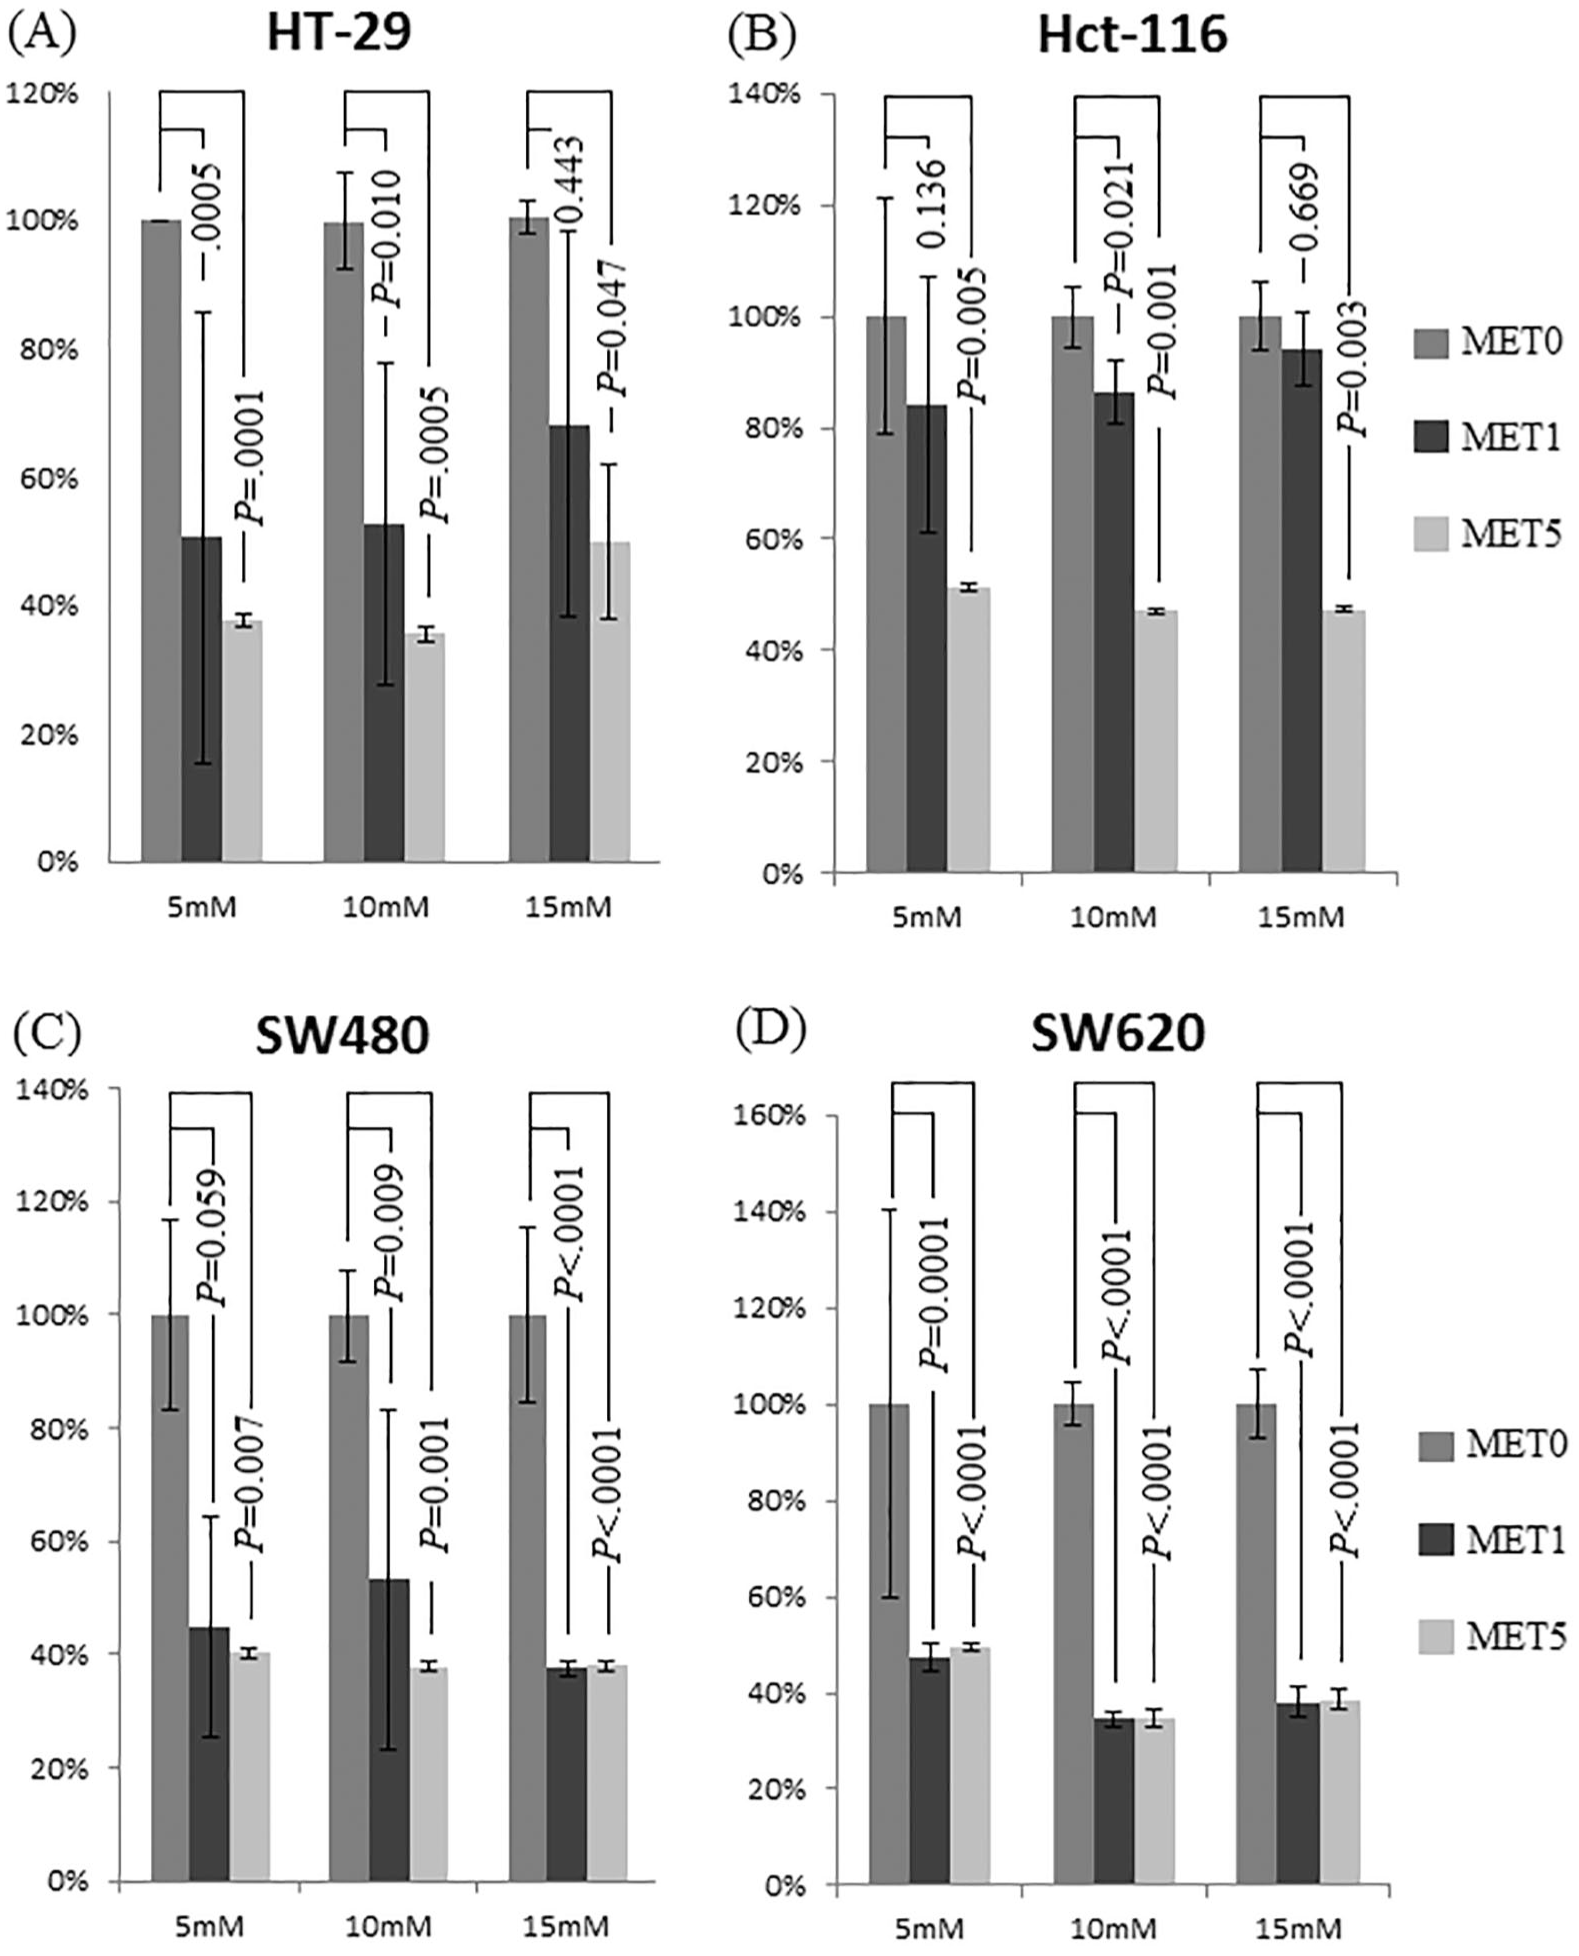
Effect of different metformin concentrations (0, 5, and 10 mM) on colon cancer cell proliferation under different glucose conditions using the CCK-8 assay. No metformin sample was normalized to 100% for all glucose concentrations as control. (A–D) Proliferation of HT-29, HCT-116, SW480, and SW620 cells decreased significantly after 24-h incubation with increasing metformin concentrations. Compared with 0 mM metformin, the proliferation rate of HT-29 and HCT-116 cells decreased significantly after metformin administration (1 and 5 mM; p value as shown).
In the oxaliplatin and metformin chemotoxicity analysis, the proliferation rate of CRC cells decreased significantly after treatment with oxaliplatin and 5 mM metformin. Compared with corresponding cells in 15 mM

Assessment of the effects of oxaliplatin and metformin chemotoxicity on colon cancer cells using the CCK-8 assay. Compared with the proliferation rates of cells grown in 15 mM
Glycolysis-related mRNA or signaling pathway prediction assay
Our experiments demonstrated that high glucose concentrations enhanced cell proliferation in four colon cancer cell lines. We identified glycolysis-related mRNAs or target genes that elucidated the proliferation and antioncogenic effects through Kyoto Encyclopedia of Genes and Genomes pathway program analysis and a literature review. The multifunctional transcription factors SMAD3 and MYC, as well as upregulation of EHMT2 expression, influenced cell survival and oxaliplatin resistance.
At high glucose concentrations, SMAD3 protein expression levels of SW620 cells were similarly unchanged, whereas phosphorylation of SMAD3 (pSMAD3) increased at high glucose concentrations. Increased pSMAD3 expression induced slightly increased MYC protein expression (Figure 3). As shown in Figure 3, protein expression levels of pSMAD3, pMYC, and EHMT2 increased significantly at high glucose concentrations (15 mM glucose; lane 2). However, after adding metformin (1 and 5 mM), the increase in phosphorylation of SMAD3 and MYC was reversed, and EHMT2 expression levels decreased (15 mM glucose; lanes 3 and 4, respectively).

(A) Western blotting of proteins involved in the development of oxaliplatin resistance in SW620 cells. MYC and EHMT2 expression levels increased significantly at high glucose concentrations (15 mM glucose; lane 2), whereas SMAD3 expression level did not. Phosphorylation of SMAD3 and MYC also increased considerably at high glucose concentrations, but, after adding metformin, the increase in phosphorylation could be reversed (lanes 3 and 4). The upregulation of EHMT2 expression could also be reversed after metformin administration (lanes 3 and 4). (B) The proposed mechanism of the effect of high glucose concentrations on the oxaliplatin resistance of CRC.
Survival analysis
The DFS and OS of the 157 patients with stage III CRC were assessed using the Kaplan–Meier method (Figure 4A and B, respectively). With 2 years as the endpoint, the DFS of the patients in the high-blood-glucose group (⩾126 mg/dl) was significantly poorer than that of patients in the low-blood-glucose group (<126 mg/dl; p = 0.012). However, with 3, 4, or over 4 years as the endpoint, the DFS of patients in the two groups was not significantly different (p = 0.050, p = 0.102, and p = 0.089, respectively). With 2 years as the endpoint, the OS of patients in the high blood glucose group (⩾126 mg/dl) was significantly poorer that of patients in the low blood glucose group (<126 mg/dl; p = 0.041). However, with 3, 4, or over 4 years as the endpoint, the OS of patients in the two groups was not significantly different (p = 0.063, p = 0.061, and p = 0.072, respectively).

Cumulative survival rates for the 157 UICC stage III CRC patients assessed using the Kaplan–Meier method, and differences in survival rates analyzed using a log-rank test. (A) Disease-free survival. With 2 years as the endpoint, the DFS of patients in the high blood glucose group (⩾126 mg/dl) was significantly poorer than that of patients in the low blood glucose group (<126 mg/dl; p = 0.012). (B) Overall survival. With 2 years as the endpoint, the OS of patients in the high blood glucose group (⩾126 mg/dl) was significantly poorer that of patients in the low blood glucose group (<126 mg/dl; p = 0.041).
Discussion
CRC is a human malignancy with a complex etiology, and the mechanisms underlying this pathophysiology are not yet completely understood. Epigenetic modifications have accounted for the majority of complex disease research; among these, blood sugar level reportedly serves as a potential cancer biomarker.6,27,28 The most fundamental metabolic alteration in CRC cells is increased glycolysis.13,29 Glucose may drive cancer not only by modifying microRNA (miRNA) expression but also by activating the mammalian target of rapamycin, which can increase protein synthesis and cellular growth.30–34 Through a series of in vitro studies, we demonstrated that high glucose concentrations enhanced cell proliferation and increased oxaliplatin resistance in four CRC cell lines. Another notable finding was that oxaliplatin resistance in these four CRC cell lines could be reversed by administering an anti-DM agent.
Through the literature review, we observed that DM patients are at higher risk of carcinogenesis and death from cancer, including CRC, than healthy individuals. 19 Studies have shown that miRNA-16 partially induces cell cycle arrest by regulating multiple cell cycle genes, including cyclin D1, cyclin D3, cyclin E1, and CDK6, and prevents cells from entering the S phase, thus causing an accumulation of cells in G0/G1.17,35 The current study found that high glucose levels increased the proliferation of colon cancer cell lines HT-29, HCT-116, SW480, and SW620. Other in vivo studies have shown that chemotherapy with oxaliplatin and fluorouracil was less effective, and resulted in shorter survival under hyperglycemia.19,36 Studies have also found that MYC is overexpressed through glucose administration in many organs.37,38 By in vivo experiment in rats, Bux and colleagues, recently found that fed blood glucose levels increased from 125 ± 6 mg/dl to 512 ± 37 mg/dl, which was accompanied by a significant increase in gene transcript levels of the transcription factor MYC in the heart. 39 Transforming growth factor beta (TGFβ) signaling inhibited ezrin phosphorylation in a SMAD3-dependent manner, and regulated pro-apoptotic function through ezrin-mediated protein kinase A activation. 40 The oxaliplatin resistance of CRC cells was mediated by inhibiting macroautophagy via the TGFβ/SAMD4 pathway. 41 EHMT2 was reported to govern phenotype and chemoradioresistance in colon cancer stem cells. 42 EHMT2 and the colon cancer stem cell marker CD133A were significantly correlated in patients with advanced rectal cancer who received concurrent chemoradiotherapy; EHMT2 knockdown increased the sensitivity of cancer cells to radiation treatment. 42 This study demonstrated the biological plausibility of the hypothesis that hyperglycemia might increase SMAD3 and MYC phosphorylation in CRC patients (Figure 3B). MYC is a SMAD3 downstream protein whose phosphorylation is increased by phosphorylated SMAD3. Downstream EHMT2 can be upregulated by phosphorylated MYC. An increase in phosphorylation of the glucose-related target proteins SMAD3 and MYC under high glucose concentrations caused the upregulation of EHMT2 expression and oxaliplatin resistance in colon cancer cells.
One meta-analysis showed a significant association of type 2 DM with increased CRC risk. 15 The present data might indicate that patients with stage III CRC and high blood sugar levels exhibited markedly poor prognoses and oxaliplatin resistance during a short period. CRC survivors can change their diet and lifestyle with higher physical activity to control their serum blood sugar level, and thus potentially improve their prognosis and quality of life. We further stratified stage III CRC patients according to their serum blood sugar level and found that high blood sugar was correlated with a higher incidence of disease relapse, but that DM history was not. Because CRC patients with hyperglycaemia have poor clinical outcomes and higher oxaliplatin resistance, we suggest that blood sugar level can be a potentially auxiliary biomarker in adjuvant FOLFOX therapy for stage III CRC patients. Although adequate control of serum blood sugar levels seems advisable, additional large-scale prospective studies are necessary to verify this point.
Some limitations of this study should be mentioned. First, we examined only FBS levels, which reflect daily blood glucose levels but might be prone to bias. An HbA1c test can be performed at any time, regardless of the fasting duration or the content of the previous meal, and HbA1c levels reflect blood glucose levels over the preceding 6–8 weeks. 43 HbA1c levels may be more crucial for prognosis, but some of the patients in this study had incomplete data from HbA1c testing. Second, the peripheral neuropathy of the patients may be added as a study endpoint to differentiate DM-related peripheral sensory neuropathy. Third, the current study had a relatively small patient population and retrospective cohort. Therefore, multicenter prospective studies with data from FBS/HbA1c testing and peripheral neuropathy that might provide additional detailed information regarding the prognostic and adverse effects of adjuvant therapy on patients with stage III colon cancer are necessary.
In summary, the data in this study indicated that blood sugar levels can enhance oxaliplatin chemoresistance in vivo and CRC cell proliferation and chemoresistance in vitro. We suggest that blood sugar levels in patients with stage III CRC be used as a potential indicator for identifying increased risk of oxaliplatin chemoresistance within 2 years of radical resection.
Supplemental Material
SF1-300dpi_1 – Supplemental material for High blood sugar levels but not diabetes mellitus significantly enhance oxaliplatin chemoresistance in patients with stage III colorectal cancer receiving adjuvant FOLFOX6 chemotherapy
Supplemental material, SF1-300dpi_1 for High blood sugar levels but not diabetes mellitus significantly enhance oxaliplatin chemoresistance in patients with stage III colorectal cancer receiving adjuvant FOLFOX6 chemotherapy by I-Ping Yang, Zhi-Feng Miao, Ching-Wen Huang, Hsiang-Lin Tsai, Yung-Sung Yeh, Wei-Chih Su, Tsung-Kun Chang, Se-fen Chang and Jaw-Yuan Wang in Therapeutic Advances in Medical Oncology
Footnotes
Acknowledgements
The authors are grateful for the contribution to data collection made by the Colorectal Cancer Group from the Cancer Center of Kaohsiung Medical University Hospital.
Author Contributions
I-Ping Yang and Jaw-Yuan Wang conceived and designed the study. Zhi-Feng Miao, Hsiang-Lin Tsai, Ching-Wen Huang, Yung-Sung Yeh, Wei-Chih Su, Tsung-Kun Chang, and Se-fen Chang analyzed and interpreted the data. I-Ping Yang and Zhi-Feng Miao performed the in vitro study and drafted the paper, and Jaw-Yuan Wang critically revised it for essential intellectual content. All the authors gave their final approval of the version for publication.
Funding
The author(s) disclosed receipt of the following financial support for the research, authorship, and publication of this article: This work was supported by grants through funding from the Ministry of Science and Technology (MOST108-2321-B-037-001, MOST107-2321-B-037-003, MOST107-2314-B-037-116, MOST107-2314-B-037-022-MY2, MOST107-2314-B-037-023-MY2) and the Ministry of Health and Welfare (MOHW107-TDU-B-212-123006, MOHW107-TDU-B-212-114026B, MOHW108-TDU-B-212-133006, MOHW108-TDU-B-212-124026) funded by Health and welfare surcharge of tobacco products, and the Kaohsiung Medical University Hospital (KMUH107-7R28, KMUH107-7R29, KMUH107-7R30, KMUH107-7M22, KMUH107-7M23, KMUHS10701, KMUHS10706, KMUHS10710, KMUHS10801, KMUHS10807) and Center for Cancer Research, Kaohsiung Medical University (KMU-TC108A04). In addition, this study was supported by the Grant of Biomarker Discovery in Major Diseases of Taiwan Project (AS-BD-108-1), Academia Sinica, Taiwan, R.O.C.
Author Note
Jaw-Yuan Wang is also affiliated with Clinical Pharcogenomics and Pharcoproteinomics, College of Pharmacy, Taipei Medical University, Taipei, Taiwan.
Conflict of interest statement
The authors declare that there is no conflict of interest.
Supplemental material
Supplemental material for this article is available online.
References
Supplementary Material
Please find the following supplemental material available below.
For Open Access articles published under a Creative Commons License, all supplemental material carries the same license as the article it is associated with.
For non-Open Access articles published, all supplemental material carries a non-exclusive license, and permission requests for re-use of supplemental material or any part of supplemental material shall be sent directly to the copyright owner as specified in the copyright notice associated with the article.