
Abstract
Background:
Hepatocellular carcinoma (HCC) is the most common form of liver cancer and is generally caused by viral infections or consumption of mutagens, such as alcohol. While liver transplantation and hepatectomy is curative for some patients, many relapse into disease with few treatment options such as tyrosine kinase inhibitors, for example, sorafenib or lenvatinib. The need for novel systemic treatment approaches is urgent.
Methods:
MTH1 expression profile was first analyzed in a HCC database and MTH1 mRNA/protein level was determined in resected HCC and paired paracancerous tissues with polymerase chain reaction (PCR) and immunohistochemistry. HCC cancer cell lines were exposed in vitro to MTH1 inhibitors or depleted of MTH1 by siRNA. 8-oxoG was measured by the modified comet assay. The effect of MTH1 inhibition on tumor growth was explored in HCC xenograft in vivo models.
Results:
MTH1 protein level is elevated in HCC tissue compared with paracancerous liver tissue and indicates poor prognosis. The MTH1 inhibitor Karonudib (TH1579) and siRNA effectively introduce toxic oxidized nucleotides into DNA, 8-oxoG, and kill HCC cell lines in vitro. Furthermore, we demonstrate that HCC growth in a xenograft mouse model in vivo is efficiently suppressed by Karonudib.
Conclusion:
Altogether, these data suggest HCC relies on MTH1 for survival, which can be targeted and may open up a novel treatment option for HCC in the future.
Introduction
Effective treatment strategies for relapsed hepatocellular carcinoma (HCC) are largely missing and the vast majority of patients succumb to the disease. In recent years, some new therapeutic strategies in addition to sorafenib, have been approved for patients with HCC. 1 Unfortunately, the current strategies have only very limited effects in prolonging overall survival in HCC and novel treatments are needed. As cancer often harbors genetic instability and an elevated level of DNA damage, they are often addicted to effective DNA repair. Hence, targeting DNA repair should be a viable strategy exploited in the clinic to target cancer. 2 Here, we wanted to test whether inhibition of DNA repair may provide a promising opportunity for cancer treatment including for HCC.
Oxidative stress is a common pathogenic feature in hepatitis B virus (HBV) infection, hepatitis C virus (HCV) infection, or other precancer conditions leading to HCC as well as in HCC progression. 3 HCV-associated HCC exhibits a high level of oxidative stress, even in the absence of inflammation. 4 Although the underlying molecular mechanism is not entirely clear, it has been demonstrated that the HCV core protein induces mitochondrial injury and oxidative stress, 5 which may be related to its ability to inhibit deoxycholic acid-mediated apoptosis. 6 Altered redox regulation has been reported to contribute to hepatocarcinogenesis owing to the redox-mediated mutagenesis of critical cellular genes. The marker for oxidative stress, 8-oxo-2′-deoxyguanosine (8-oxo-dG), is increased in HCC and has been positively correlated with HCC grades7,8 Moreover, high levels of 8-oxo-dG in noncancerous regions also predicted an increased risk of tumor recurrence in patients with HCC. 9 However, dysfunctional redox regulation and an increased reactive oxygen species (ROS) tension can also cause oxidative damage to DNA directly, or to free bases in the cellular and mitochondrial deoxynucleoside triphosphate (dNTP) pool.10,11
The MTH1 protein is involved in the main defense to oxidative stress and prevents oxidized dNTPs, for example, 8-oxo-dGTP or 2-OH-dATP, from being incorporated into DNA.12,13 Interestingly, the MTH1 protein is nonessential in nontransformed cells and MTH1 knockout mice live and grow old, 14 which altogether suggest that oxidative stress levels are kept low in normal cells. Interestingly, we and others found that MTH1 enzyme is required for survival of cancer cells as a likely result of high levels of oxidative stress in cancer.15–19 Furthermore, we have developed small molecule MTH1 inhibitors that are selectively toxic to cancer cells while sparing normal cells. Karonudib (TH1579) supports clinical investigation of MTH1 inhibitor with excellent pharmacokinetic and pharmacodynamics properties.15,20
Here, we evaluate if the high level of oxidative stress in HCC renders the carcinoma addictive to MTH1. We study MTH1 levels in HCC tissue, the toxicity of MTH1 siRNA and inhibitors and the potential therapeutic effects of MTH1 inhibitors in vivo.
Material and methods
Sample information
All samples were collected in Department of Liver Surgery, Renji Hospital, Shanghai Jiaotong University School of Medicine. Fresh samples, including tumor tissues and portal vein tumor thrombus (PVTT), were obtained from HCC patients during tumor resection. Normal livers were collected from healthy liver donors during liver transplantation. A total of 123 HCC tumor samples were used to generate a second HCC tissue microarray cohort. All samples were Asian HCCs. The median age of this cohort of patients was 50 years (range 17–78 years). The majority of patients were HBV-positive (106/123). Patient samples from healthy liver donors and HCC patients undergoing tumor resection were obtained following informed consent for this study, and the protocol was approved by the ethical review committee of the World Health Organization Collaborating Center for Research in Human Production (authorized by the Shanghai Municipal Government) and the Ethics Committee of Renji Hospital, School of Medicine, Shanghai Jiao Tong University (#2017-001). The present research was carried out according to the provisions of the Helsinki Declaration of 1975. No organs from executed prisoners were used in the present study.
Immunohistochemistry stain and analysis
All tissue samples were fixed in phosphate buffered neutral formalin and routinely embedded in paraffin, and then cut into 4 μm thick sections. The sections were detected with primary antibody for MTH1 overnight at 4°C. After incubation with a suitable second antibody, the sections were treated with diaminobenzidine and counterstained with hematoxylin. To quantify the level of MTH1 protein expression, all the sections were observed and photographed with a microscope (Carl Zeiss) and scored according to the ratio and intensity of positive staining cells: 0–5% scored 0; 6–35% scored 1; 36–70% scored 2; 70–100% scored 3. The final expression level of MTH1 was designated as low or high group: score 0–1, low expression; 2–3, high expression. These scores were determined independently by two experienced pathologists in a blinded manner.
Patient cohorts and statistical analysis
RNA expression profiles generated by the Agilent microarray platform for 377 HCC patients and paired tumor/paratumor tissue were extracted from The Cancer Genome Atlas (TCGA) interface (http://tcga-data.nci.nih.gov/). Of the patients, 187 were white, 161 were Asian, 17 were black or African American, 2 were American Indian or Alaska native, and 10 were not reported. The tumor node metastasis (TNM) staging, histologic grade, and the prognostic data of the patients were obtained from the clinical supplements in the TCGA database. The HCC patients were stratified into two groups with the high and low MTH1 expression, based on the median MTH1 mRNA expression levels in the TCGA database. The Clinical outcome between groups was compared using Kaplan–Meier analysis followed by two-sided log-rank tests (SPSS version 22, IBM Software). Multivariate cox regression (SPSS) was used to generate influence factors and their hazard ratios and 95% confidence intervals (CIs).
Antibodies
The following antibodies were used: rabbit anti-MTH1 (ab197028, Abcam), rabbit anti-53BP1 (A300-272A, Bethyl Laboratories), mouse anti-ATM pS1981 (sc47739, Santa Cruz Biotech), rabbit anticleaved PARP1 (9541, Cell Signalling Technologies), rabbit anticleaved caspase 3 (9661s, Cell Signaling Technologies), rabbit anti-H2AX (05-636, Millipore), and mouse anti-
Quantitative real-time polymerase chain reaction and Western blot
A standard TRIzol method (Invitrogen) was used to extract total RNA from tissues and cultured cells and to synthesize complementary DNA. Quantitative real-time polymerase chain reaction (RT-qPCR) was performed using SYBR Premix Ex Taq (Takara) in an ABI PRIS 7900HT sequence detector. The beta-actin gene was used as an endogenous control. The primer sequences were as follows: beta-actin forward: 5′-CCTGGCACCCAGCACAAT-3′, beta-actin reverse: 5′-GGGCCGGACTCGTCATACT-3′, MTH1 forward: 5′-GTGCAGAACCCAGGGACCAT-3′, MTH1 reverse: 5′-GCCCAC GAACTCAAACACGA-3′. Liver tissue or HCC cell line extracts were prepared for immunoblotting analyses, as described previously.21,22 Immunoblots were probed with antibodies against the related antibodies at the recommended dilutions.
Cell culturing and cellular assays
Human HCC cell lines Hep3B and C3A cells were originating from ATCC and were cultured in MEM. Human HCC cell lines SMMC-7721, MHCC-97L, and MHCC-97H were all preserved at the Shanghai Cancer Institute, Ren Ji Hospital, School of Medicine, Shanghai Jiao Tong University and were cultivated in Dulbecco’s modified Eagle medium (DMEM) supplemented with 10% (v/v) fetal calf serum at 37°C in a humidified incubator under 5% CO2 condition. Cell viability was measured with Resazurin assay, clonogenic outgrowth assays. To determine the effect of MTH1 silencing on cell viability, 1000 cells were seeded onto 10 cm well plates with a mixture of transfection agents and nontarget siRNA control or MTH1 siRNA (10 nM). Culture media was replaced 24 h later and incubated at 37°C, 5% CO
Immunofluorescence
Cells were seeded on coverslips in 24-well plates (10,000–15,000 cells per well) for observation with confocal microscopy. The cells were treated with compounds the next day. Cells were fixed with 3% paraformaldehyde in phosphate-buffered saline (PBS; pH 7.5) with 0.1% Triton X-100 for 15 min at room temperature. Samples were permeabilized with 0.3% Triton X-100 in PBS and blocked in 3% bovine serum albumin (BSA), 0.1% Tween 20 in PBS. Primary and secondary Alexa-Fluor-conjugated antibodies were diluted in 3% BSA, 0.1% Tween 20 in PBS. DNA was counterstained with DAPI (Invitrogen). Images were acquired in a Zeiss LSM-510 confocal microscope with the 488 oil objective. For high-throughput immunofluorescence, cells were seeded in 96-well plates (2500–3000 cells per well). The cells were treated with compounds the next day. Cells were fixed and stained as described above. DNA was counterstained with DAPI. Quantification was done by automatic acquisition of images (500 cells per well) using the In Cell Analyzer 2000 (GE Healthcare) and Developer software (GE Healthcare).
Transfections
For siRNA transfections, cells were seeded at 20–40% confluency and transfected with 10 nM siRNA and INTERFERin (Polyplus Transfections) the next day according to the manufacturer’s protocol. Cells were transfected in media without PeSt. For NT RNA control, the All-stars negative control (Qiagen) was used. The siRNA sequences used were as follows: MTH1 siRNA #1 GACGACAGCUACUGGUUUC; MTH1 siRNA #2 GAAAUUCCACGGGUACUUC; MTH1 siRNA #3 CGACGACAGCUACUGGUUU. Stable cell lines were made by transfecting cells with plasmid DNA and JetPEI (Polyplus Transfections) according to the manufacturer’s protocol. Cells were selected using 600 µg/ml G418 (MutT-myc vector) for 2 weeks before single-cell clones were isolated. Overexpression was verified by Western blot. Bacterial expression constructs were performed as described previously. 15 Overexpression of H2B-GFP in Hep3b cells was established by lentiviral transfection of H2b-GFP pLenti-CMV-hygro plasmid and selection with 200 µg/ml hygromycin for 7 days.
Time-lapse video microscopy
For time-lapse microscopy, we used Hep3B cells stably expressing H2b-GFP. Hep3B H2b-GFP cells were seeded a 96-well plate and the next day treated with 500 nM Karonudib or DMSO alone. Images were acquired in the GFP channel every 5 min for 24 h using an ImageXpress MicroXL (Molecular Devices) microscope. Cells were kept at 37°C with 5% CO2 and the acquisition started after 30 min from the addition of the compounds. Stacked images were analyzed using the ImageJ software. Quantification was performed by following individual cells (25 cells/sample) over time and scoring for time in interphase and mitosis as well as mitotic defects and the outcome of cell division [normal G1, mitotic slippage/polynucleation (MS/PN), aneuploidy, mitotic slippage (MS), bridges, and death in mitosis (DiM)].
Xenograft study
All animals studies were performed in compliance with EU 2010/63 directive on the protection of animals used for scientific purposes and Animal Scientific Procedures Act 1986 and approved by regional animal ethical committee in Stockholm (#N584/11, N2/11, N89/14). All animals were acclimatized for at least 7 days before initiation of study. The laboratory animals had free access to water and food as well as enrichment. The temperature, humidity, light cycle, and cage size were according to laboratory animal guidelines and regulations. The animals were housed 3–5 mice per cage. The group size was based on previous experience of MTH1 inhibitor and disease model (n = 6–8/group). The exclusion/inclusion criteria was predefined in ethical license as was the human end point (0.6p according to Karolinska Institutet scoring for animal health) and maximal tumor burden was set as 1000 mm3. Tumor volume was measured at least twice weekly by using an electrical caliper and calculated as length × width × width × 0.52. Body weight was measured twice weekly and the general status of the treated animals were checked daily. NOD-SCID mice (5–6 weeks, male and female, local breeder Karolinska Institutet, Sweden) were used in the HepB3 xenograft model. Cancer cells (1 × 10⁶ Hep3B cells) were diluted in Matrigel (1:1, BD Bioscience) and injected subcutaneously in the sacral area of the mice. When tumor reached approximately 100 mm3, the animals were randomized into the various groups and treatment initiated (baseline average ± SD tumor size and body weight, respectively; vehicle group, 82 ± 26 mm3, 21 ± 3 g, n = 8; Karonudib group, 78 ± 13 mm3, 23 ± 4 g, n = 8; sorafenib group, 79 ± 12 mm3, 21 ± 3 g, n = 6). Karonudib and sorafenib were diluted in 5% DMSO, 10% Cremaphore, 10% Tween 80, and 75% water, and pH adjusted with acetic acid (1M) to pH 4.5–5.0. Control animals obtained vehicle with 5% DMSO, 10% Cremaphore, 10% Tween 80, and 75% water, and pH adjusted to 4.5–5. Karonudib (90 mg/kg b.i.d., p.o.) or vehicle was administrated Monday, Wednesday, and Friday and sorafenib (30 mg/kg q.d., p.o.) was administrated daily. All the mice were treated for a maximum allowable period of 6 weeks.
Statistical analysis
The quantitative data were compared between groups using the one-way and two-way analysis of variance (ANOVA). The cumulative survival rates were determined using the Kaplan–Meier method and log-rank test. The Cox proportional hazards model was used to determine the independent factors that influence survival. A value of p < 0.05 was considered to be significant. All the analyses were performed using the SPSS software (version 18.0). For the in vivo xenograft study, two-way ANOVA with repeated measures and the Bonferroni test were used for statistical analysis.
Results
MTH1 levels are upregulated in pathologically verified HCC tissue as compared with noncancer hepatic tissue
Given the high levels of oxidative stress reported in HCC, we wanted to determine whether this results in corresponding high levels of MTH1 protein levels, as a defense mechanism to counteract the oxidative stress. First, we investigated the localization and expression of MTH1 in liver in surgical specimens obtained from HCC patients. Following pathological evaluation, a higher MTH1 expression level was detected in the HCC and tumor thrombus tissues as compared with that in the normal liver and paracancerous tissues. In the normal liver and paracancerous tissues, MTH1 was mainly expressed in macrophages and proliferative biliary tracts but not in hepatocytes (Figure 1A). To determine whether the increased MTH1 protein level was also reflected by a corresponding increase in gene expression, we isolated RNA from the specimen and determined MTH1 mRNA levels by RT-qPCR. Elevated mRNA gene expression of MTH1 was observed in cancerous tissues as compared with paracancerous tissues and correlated with the corresponding protein levels observed (Figure 1B and C). The results demonstrate upregulation of MTH1 in HCC tissue, which suggest that MTH1 may play an important role during HCC development.
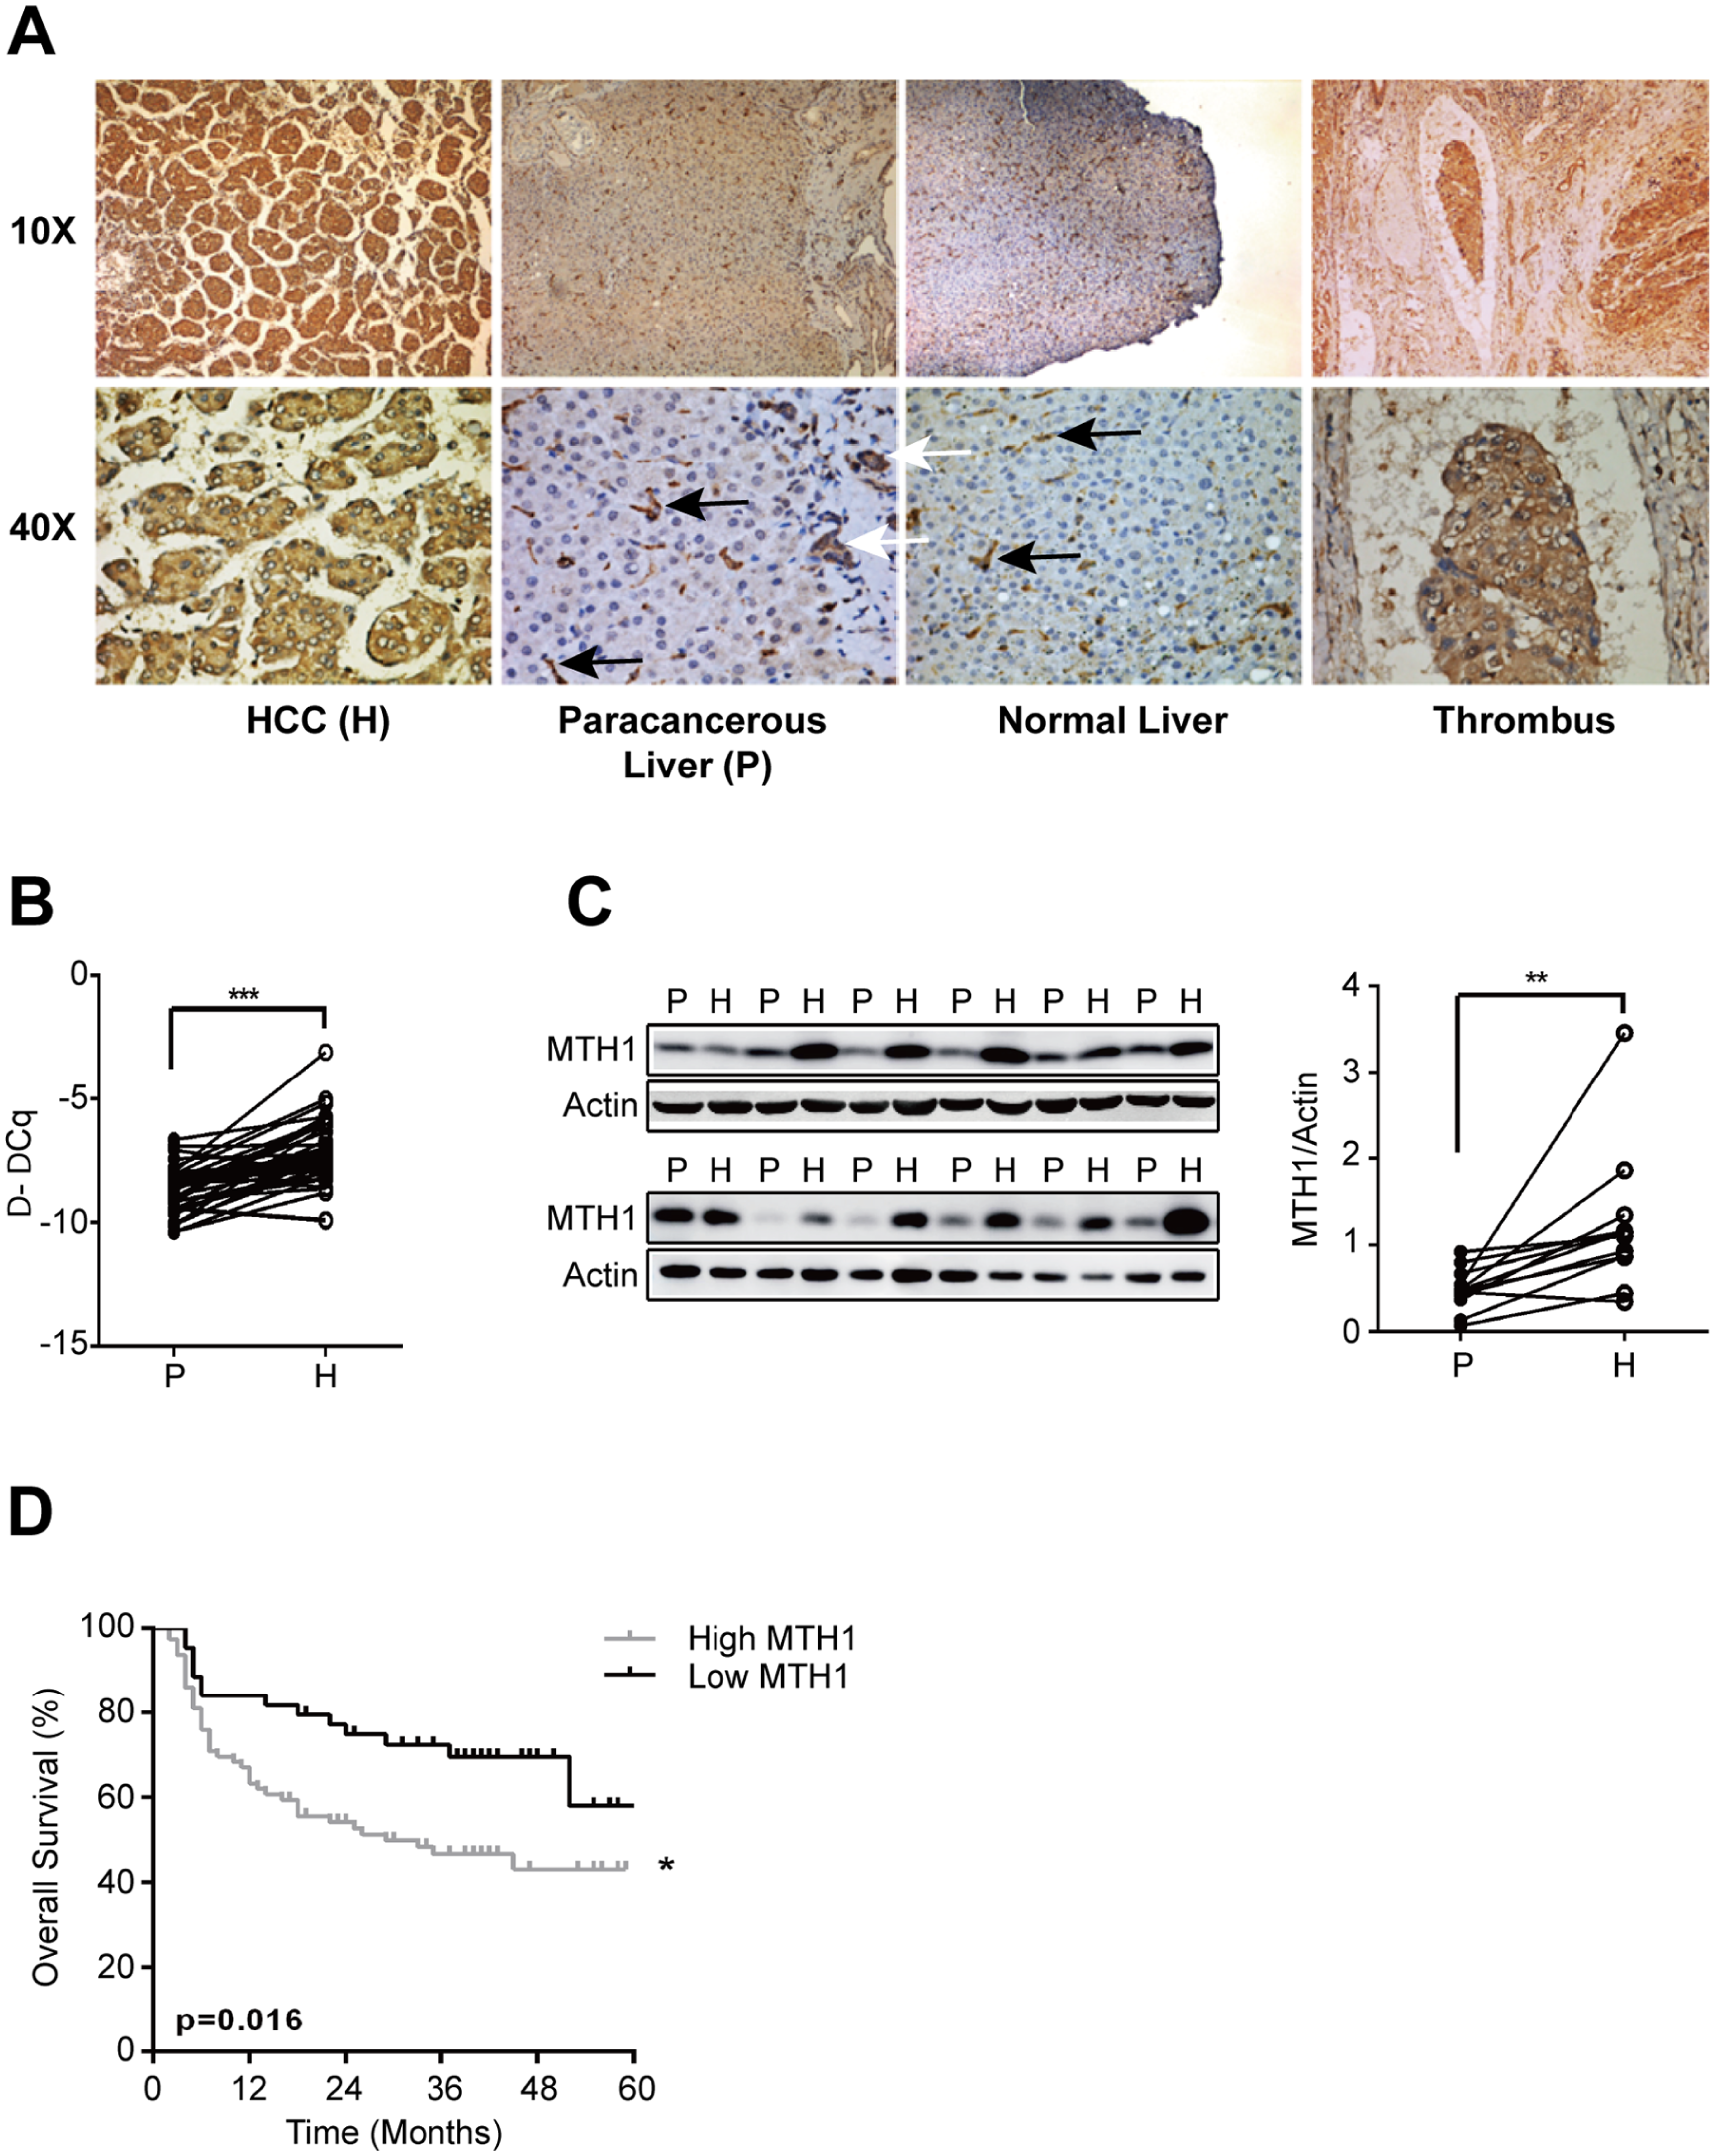
MTH1 expression in liver tissues. (A) Immunostaining of MTH1. The black arrows indicate inflammatory cells, and the white arrows indicate proliferated biliary tracts. (B) Relative mRNA expression of MTH1 (***p < 0.001). (C) Western blot analysis of MTH1. (D) Kaplan–Meier analysis indicated statistically significantly shorter survival of patients in the MTH1 high expression group than the low expression group. P refers to paracancerous liver tissues and H refers to HCC tissues (*p < 0.05, **p < 0.01, ***p < 0.001).
MTH1 levels are associated with adverse biological behaviors of HCC and indicates poor prognosis
To further investigate the clinical significance of MTH1 expression in HCC, we examined the correlation between the MTH1 expression status and clinicopathological characteristics of 123 HCC patients who were divided into two groups: the high expression group (n = 79) and the low expression group (n = 44). The results indicated that high levels of MTH1 was significantly associated with adverse clinicopathological parameters of HCC, including serum alpha fetoprotein (AFP), vascular invasion, histologic grade, and TNM stage (Table 1). Moreover, Kaplan–Meier survival analysis in the 123 patients with follow up demonstrated a poor survival in patients with high MTH1 expression (Figure 1D).
Clinicopathological correlation of MTH1 expression in 123 HCC patients using Pearson’s χ2 test.

AFP, alpha fetoprotein; HCC, hepatocellular carcinoma; TNM, tumor node metastasis.
Next, we analyzed the expression pattern of MTH1 in the TCGA cohort. The results verified the higher expression of MTH1 in cancerous tissue compared with paracancerous liver tissue and that MTH1 is associated with adverse biological behaviors of HCC (Figure 2A–D). Moreover, multivariate cox analysis showed MTH1 level, TNM staging or histologic grade is correlated with the poor prognosis of HCC patients (Figure 2E).

MTH1 expression in hepatocellular carcinoma (HCC) in The Cancer Genome Atlas (TCGA) database. (A) Relative mRNA expression of MTH1. (B) Kaplan–Meier analysis of overall survival for the expression of MTH1. (C, D) MTH1 expression in different tumor node metastasis (TNM) stages and histologic grades. (E) Multivariate Cox analysis for the survival of HCC patients (*p < 0.05, **p < 0.01, ***p < 0.001).
HCC cells require MTH1 for survival
These results suggest that HCC is highly dependent on MTH1 for their survival. To investigate whether MTH1 could be a target for HCC treatment, we depleted MTH1 using three different short interfering RNAs (siRNAs) in two HCC different cell lines, resulting in reduced clonogenic survival and viability in colony formation assay (Figure 3A). To determine whether a similar response could be obtained using the MTH1-specific inhibitor Karonudib, we treated the five different HCC cell lines with increasing concentrations of Karonudib (Figure 3B and C). The results show that all HCC cell lines are sensitive to MTH1 inhibition in both in the colony formation assay and the resazurin viability assay, indicating that Karonudib is a potential treatment for HCC.
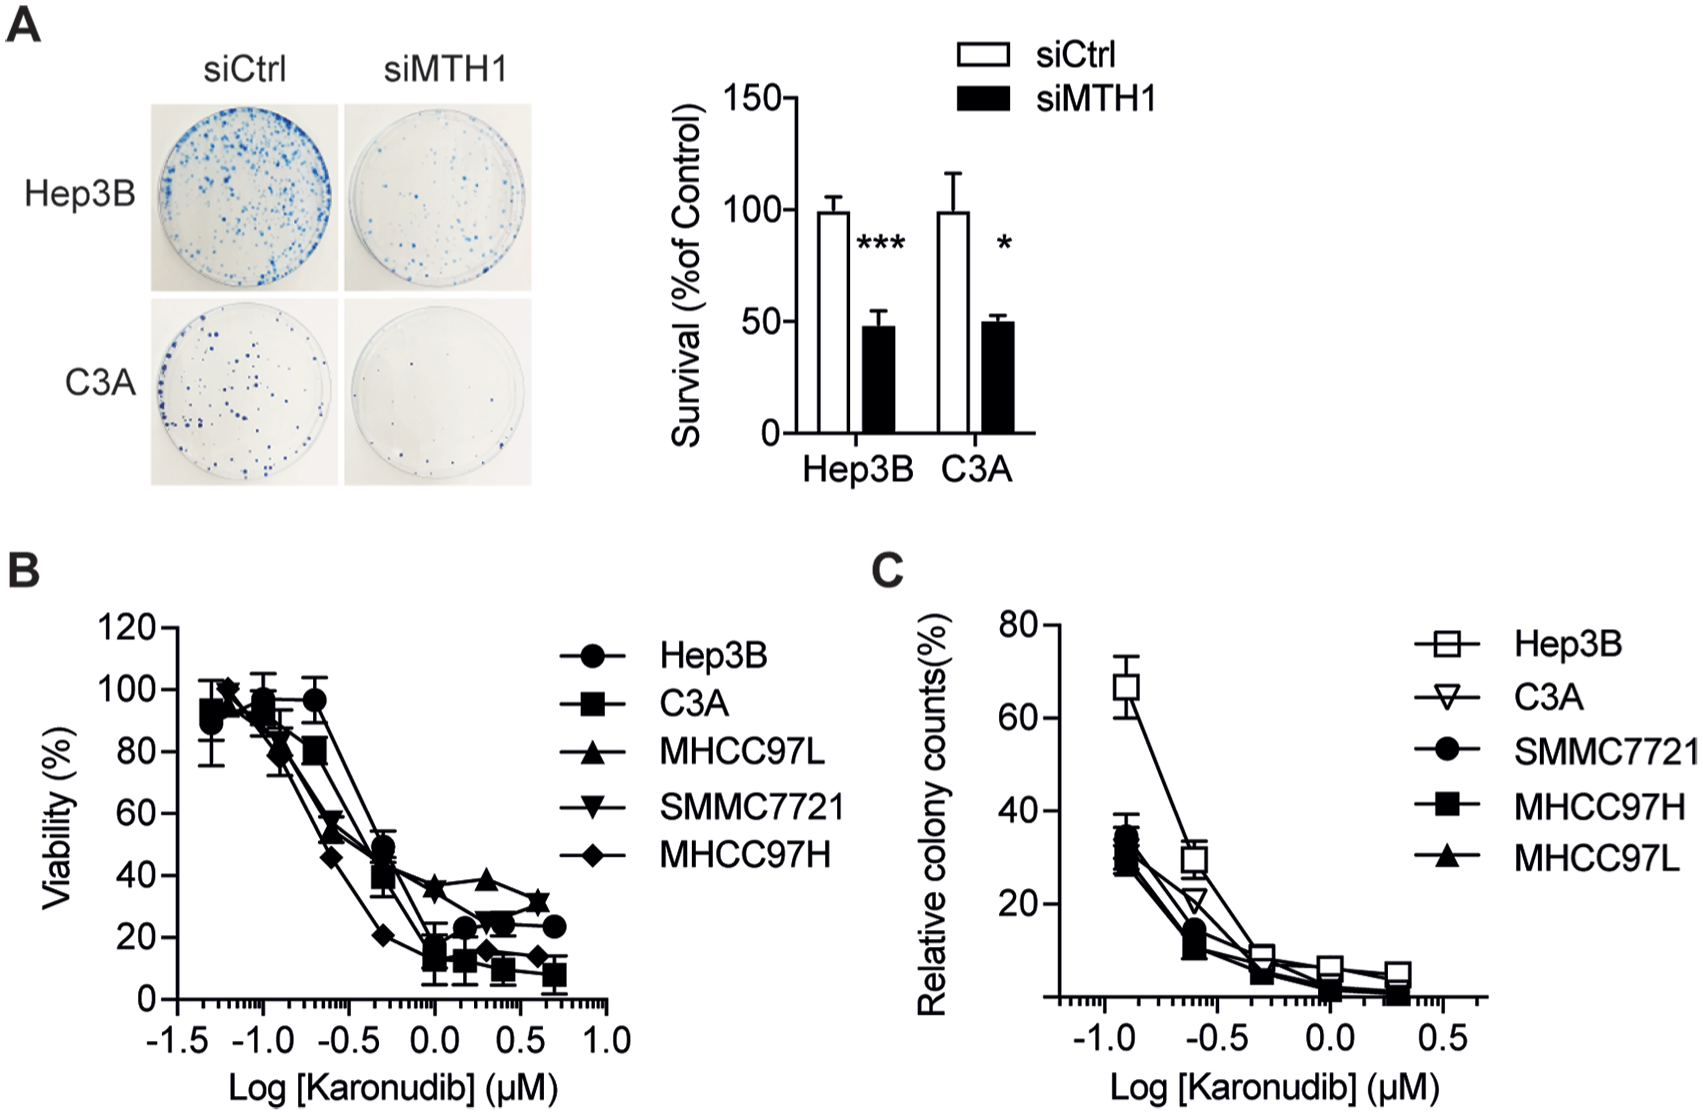
MTH1 is required for hepatocellular carcinoma (HCC) cancer cell survival. (A) Clonogenic survival of Hep3B and C3A cells transiently transfected with MTH1 siRNA (M) or non-targeting siRNA (NT); (B) Viability of HCC cells after 72 h Karonudib treatment; (C) Colony counts of HCC cells after 72 h Karonudib treatment. Values represent percentage of colonies in relation to DMSO-treated controls. Data shown as average ± standard error of the mean of at least two independent experiments.
Karonudib treatment induces incorporation of 8-oxo-dG in HCC cancer cells
Previously, it was demonstrated that Karonudib treatment results in elevated levels of 8-oxo-dG in DNA, which could be reversed by overexpression of MTH1, treatment with antioxidants, or more elegantly overexpression of the bacterial 8-oxo-dGTPase MutT fused to nuclear and mitochondrial localization signals. 20 Here, we confirm Karonudib significantly increases the level of 8-oxo-dG in DNA also in Hep3B cells and that overexpression of the bacterial homologue to MTH1, MutT, reversed the Karonudib-induced elevation of 8-oxo-dG in DNA (Figure 4A and B). Next, we observed Karonudib-induced DNA damage (53BP1 foci, ATM, cleaved PARP), and apoptosis (cleaved Caspase-3) (Figure 4C–E). Furthermore, Karonudib treatment caused a block in mitosis (Figure 4F–H) and defects in chromosome congression causing aneuploidy as well as mitotic slippage and polynucleation (MS/PN), indicating a mitotic defect during prometaphase (Figure 4F–H).

MTH1 inhibitor Karonudib causes hepatocellular carcinoma (HCC) cancer cell DNA damage. (A) Hep3B cells overexpressing MutT or with no overexpression (vector) were treated with 1 µM Karonudib for 24 h before being incubated with OGG1, to selectively cut out 8-oxodG from DNA, and run in alkaline Comet assay. (B) Quantification of comet tail moment. Data shown as average ± standard error of the mean (SEM) of at least two independent experiments (⩾200 cells per sample size) (***p < 0.001, one-way analysis of variance). (C) Induction of 53BP1 foci in Hep3B cells treated with Karonudib for 72 h. (D) Quantification of 53BP1 foci formation in Hep3B cells after Karonudib treatment for 72 h. Data shown as average ± SEM of at least two independent experiments. (E) Western blot analysis of Hep3B cells treated with increasing concentrations of Karonudib (0, 200, 500, and 1000 nM). (F–H) Hep3B cells treated with Karonudib show prolonged time in mitosis. (F) The mitotic progression was analyzed with time-lapse microscopy for Hep3B H2B-GFP cells and mitotic defects and the outcome of cell division [normal G1, mitotic slippage/polynucleation (MS/PN), aneuploidy, mitotic slippage (MS), bridges, and death in mitosis (DiM)] were scored. Acquisition was started 30 min after addition of 500 nM Karonudib and images were acquired for 20 h; (G) Data shows time in mitosis from one representative experiment from 25 cells per condition. The experiment was repeated twice with similar results (*p < 0.05, Student’s t test). (H) Representative time-lapse images showing the mitotic progression. Note the congression defect (arrowheads) and micronuclei (arrows) after Karonudib treatment. Numbers indicate time in minutes. Scale bar: 10 µm.
In vivo activity of Karonudib
Next, we evaluated the efficacy of Karonudib in comparison with Sorafenib, an approved and widely used treatment for HCC patients. In NOD-SCID mice, Hep3B cancer cell xenografts were treated with sorafenib, Karonudib, or vehicle alone: only Karonudib showed significant tumor growth inhibition, while sorafenib treatment alone was not effective in delaying tumor growth (Figure 5A). Karonudib was well tolerated without body weight loss (Figure 5B). Our results confirmed previous findings that Karonudib effectively inhibited tumor progression in xenograft mice. 20 Karonudib treated tumor-bearing mice had significantly longer survival time before tumor volume reached the cut off size of 1 cm3 (Figure 5C).

MTH1 inhibitor Karonudib significantly hinders tumor development in the in vivo study. (A) Inhibition of tumor growth in Hep3B xenograft mice treated with Karonudib, sorafenib, or vehicle control (n sorafenib = sorafenib 6–8/group). Two-way analysis of variance with repeated measures indicated significant tumor growth inhibition between the groups. Bonferroni’s test indicated significant difference in tumor volume growth between Karonudib- and vehicle-treated groups (**p < 0.01). (B) Effect on body weight of Karonudib, sorafenib, and vehicle control in Hep3B xenograft model. Values are shown as mean ± standard error of the mean and treatment as indicated. (C) Kaplan–Meier survival curve of NOD-SCID mice with Hep3B xenograft, orally treated with Karonudib, sorafenib, or vehicle for a maximum allowable period of 6 weeks. Median survival for Karonudib treated animals was 29.5 versus 18 days for sorafenib and 16.5 days for vehicle control (**p < 0.01).
Discussion
To date, no anticancer treatment has generated satisfactory clinical outcomes in HCC patients. In the pursuit of novel targeted drugs, we report that the MTH1 inhibitor Karonudib can significantly suppress the proliferation of HCC in vitro and in vivo by causing incorporation of 8-oxo-dGTP into DNA, mitotic arrest, and DNA damage.
Previously, MTH1 has been reported to be essential for survival in some types of tumor.18,23–25 In this study, we found MTH1 was overexpressed in HCC tissue compared with paracancerous or normal liver tissues and the elevated expression of MTH1 correlated with poor prognosis in HCC patients. The high expression of MTH1 in the microvascular thrombus in HCC tissues indicates that MTH1 may play an important part in HCC intrahepatic and remote metastasis and influences the long-term survival of HCC patients. When we compared our results of MTH1 expression in tumor and paired paratumor tissue both in our HCC tissue microarray cohort and the TCGA database, we found that MTH1 expression was increased with the progression of tumor tissue (increased TNM staging and histological staging). Therefore, the role of MTH1 may become more critical as the tumor progresses to advanced stages. In addition, MTH1, as an independent predictor, was correlated with the adverse overall survival of HCC patients. The results from clinical samples and the TCGA database suggest that inhibition of MTH1 could be a promising therapeutic target for treatment of HCC.
Previously, we validated MTH1 as an anticancer target and developed TH287 and TH588 as first-in-class Nudix hydrolase family inhibitors that potently inhibit the tumor progression in melanoma and breast cancer. 15 Concurrently it was demonstrated that (S)-crizotinib could induce DNA damage and therefore suppress tumor proliferation in colon cancer via MTH1 inhibition. 16 However, in 2016, other studies questioned the validity of MTH1 as a target and described controversial results showing MTH1 inhibitors that failed to kill cancer cells.26–28 Since then, there has been a debate about the role of MTH1 in cancer and potential off-targets of MTH1 inhibitors that may explain the cytotoxic discrepancy of the various published chemical series. Here we used a siRNA approach to demonstrate MTH1 is critical for HCC cancer cell survival. This is in line with previous MTH1 knockdown results reported by us and others,15,20,29–31 as well as with the finding that CRISPR-Cas9 depletion of MTH1 in a human ovarian cancer xenograft model significantly reduced tumor growth and cell proliferation. 25 Recently, a new small molecule, SB2001, was identified by a phenotypical screen in human cervical cancer and shown to be cytotoxic. The effect was demonstrated to be mediated by a combination of MTH1 inhibition and inhibition of LTA4H leading to increased oxidative DNA damage. 32
We have previously shown that the problem underlying the noncytotoxic MTH1 inhibitors lies in its failure to increase the DNA-incorporation of oxidized nuclear bases 20 and that this in turn may be due to these compounds’ inability to cause a mitotic arrest. 33 Karonudib, which in this study showed cytotoxic effects on HCC cells lines, significantly increased the accumulation of 8-oxo-dG into DNA in HCC cancer cells. Moreover, overexpression of MutT (the bacterial MTH1 homolog) rescued the 8-oxo-dGTPase activity of MTH1 in HCC cancer cells treated with Karonudib. Theoretically, the incorporation of toxic dNTPs into the nuclear DNA could cause irreversible DNA damage, leading to the ultimate cell death.2,34 Our experiments showed that treatment with Karonudib resulted in accumulation of nuclear 53BP1 foci and elevated expression of ATM and γH2AX, indicating the existence of DNA double-strand breaks (DSBs) and DNA damage. Karonudib treatment also prolonged the time in mitosis followed by aneuploidy, indicating a mitotic defect during prometaphase.
While we have demonstrated that Karonudib introduces 8-oxo-dG into DNA, DNA damage, and mitotic arrest, this study does not specifically address the mechanism of action of Karonudib, which appears to be more complex than described previously. 20 Our recent data suggests a dual mechanism of action of Karonudib: (i) disturbance of microtubule polymerization causing a mitotic arrest and (ii) increased incorporation of oxidized nucleotides, such as 8-oxo-dG, into DNA, resulting in DNA damage and cancer cell death. 33 More detailed mechanistic studies fall beyond the scope of this current manuscript and are addressed separately. 33
In our in vivo study, Karonudib was more effective in slowing down Hep3B tumor progression compared with sorafenib. Although sorafenib is currently the standard therapy for HCC patients, the efficiency is not satisfactory and the side effects, especially diarrhea and weight loss, are a severe problem in the clinic. 35 Here, we used a dose of 30 mg/kg sorafenib, a treatment that was reported to show a better survival with fewer side effects. 36 Similar to some previous studies, sorafenib treatment had only marginal antitumor efficacy in the mouse Hep3B xenograft model, especially in the early stages of tumor progression.36–38 Interestingly, although a population of cells seems to be resistant to Karonudib treatment in vitro, Karonudib treatment significantly reduced Hep3B xenograft tumor growth. Indeed, Karonudib treated mice showed better survival compared with sorafenib- or vehicle-treated animals. Our results indicated that Karonudib may serve as a potential drug candidate for the treatment of liver cancer.
In conclusion, we have described MTH1 as an independent prognosticator of HCC patient survival and a novel molecular target in HCC development and therapy. The MTH1 inhibitor Karonudib potently kills HCC cancer cells both in vitro and in vivo. Therefore, Karonudib is a promising anti-HCC drug. These findings strongly suggest that more preclinical studies and clinical trials should be conducted to evaluate the efficacy of MTH1 inhibitors in preventing HCC progression.
Footnotes
Acknowledgements
We thank Dr Martin Scobie and Tobias Koolmeister for synthesizing Karonudib.
Authors’ Note
Thomas Helleday is also affiliated to Weston Park Cancer Centre, Department of Oncology and Metabolism, University of Sheffield, Sheffield, United Kingdom.
Author contributions
X.H., J.Z., Q.X., and T.H. devised concept. U.W.B, H.G., and T.H. supervised the project. X.H., J.Z., and Q.X. designed and determined MTH1 expression in clinical specimens. X.H., Z.Z, K.S, H.G., U.W.B., and T.H. designed, performed, and analyzed cell biology experiments. U.W.B, X.H, T.P., C.G., and A.R. designed and performed the xenograft study. X.H., U.W.B., Z.Z., Q.X., and T.H. wrote the paper. All authors discussed results and approved the manuscript.
Funding
The author(s) disclosed receipt of the following financial support for the research, authorship, and/or publication of this article: This work was primarily funded by a China Scholarship Council award (X.H.) and additional support was given by The Knut and Alice Wallenberg Foundation (KAW 2014.0273) and the Swedish Foundation for Strategic Research (RB13-0224) (T.H.), Swedish Cancer Society (CAN 2015/255, T.H.), and the Swedish Pain Relief Foundation (SSF/01-05) (T.H.).
Conflict of interest statement
Ulrika Warpman Berglund, Helge Gad, and Thomas Helleday are board members of Helleday foundation, which is the sponsor of an ongoing clinical phase I trial with Karonudib. Thomas Helleday is inventor on a patent application with MTH1 inhibitors. The other authors have no conflicts of interest to declare.