
Abstract
Background:
Our aim was to investigate preoperative chemoradiation therapy (pCRT) response in locally advanced rectal cancer (LARC) comparing standardized index of shape (SIS) obtained from dynamic contrast-enhanced magnetic resonance imaging (DCE-MRI) with intravoxel-incoherent-motion-modelling-derived parameters by diffusion-weighted imaging (DWI).
Materials and methods:
Eighty-eight patients with LARC were subjected to MRI before and after pCRT. Apparent diffusion coefficient (ADC), tissue diffusion (Dt), pseudodiffusion (Dp) and perfusion fraction (f) were calculated and percentage changes ∆ADC, ∆Dt, ∆Dp, ∆f were computed. SIS was derived comparing DCE-MRI pre- and post-pCRT. Nonparametric tests and receiver operating characteristic (ROC) curves were performed.
Results:
A total of 52 patients were classified as responders (tumour regression grade; TRG ⩽ 2) and 36 as not-responders (TRG > 3). Mann–Whitney U test showed statistically significant differences in SIS, ∆ADC and ∆Dt between responders and not-responders and between complete responders (19 patients with TRG = 1) versus incomplete responders. The best parameters to discriminate responders by nonresponders were SIS and ∆ADC, with an accuracy of 91% and 82% (cutoffs of −5.2% and 18.7%, respectively); the best parameters to detect pathological complete responders were SIS, ∆f and ∆Dp with an accuracy of 78% (cutoffs of 38.5%, 60.0% and 83.0%, respectively). No increase of performance was observed by combining linearly each possible couple of parameters or combining all parameters.
Conclusion:
SIS allows assessment of preoperative treatment response with high accuracy guiding the surgeon versus more or less conservative treatment. DWI-derived parameters reached less accuracy compared with SIS and combining linearly DCE- and DWI-derived parameters; no increase of accuracy was obtained.
Introduction
Preoperative radiation therapy and concomitant chemotherapy (pCRT) combined with total mesorectal excision (TME) is the standard of care in locally advanced rectal cancer (LARC).1–7 Recently, conservative surgical approaches are being developed for early rectal cancer and for patients with significant response after pCRT,1–4 while a ‘wait and see’ policy was adopted when a complete clinical response is reached after pCRT reducing morbidity and provides a ‘true’ organ-sparing approach.5,6 Complete response (CR) was obtained after pCRT with a percentage of 24% of patients.8,9 However, several studies report that morphological magnetic resonance imaging (mMRI) alone cannot to detect pCRT changes in the early phase. In fact, in this phase, tumour change induced by pCRT cannot correspond to a visible and appreciable lesion size reduction; 10 it’s difficult to differentiate residual tumour by fibrosis. 11 Several authors focus their attention on the study of functional quantitative imaging modality10–13 such as dynamic contrast-enhanced MRI (DCE-MRI) and diffusion-weighted imaging (DWI). DCE-MRI has proven useful in detecting residual tumour after pCRT.10,14 Authors have previously examined DCE-MRI data to assess pCRT response in LARC,15–17 individuating the standardized index of shape (SIS), 15 a simple semiquantitative parameter capable of detecting significant and CR after CRT in LARC with high accuracy. Moreover, several researchers have proposed functional parameters derived by DWI as potential biomarkers for treatment response. 18 Apparent diffusion coefficient (ADC) can be used as an imaging biomarker to reflect biological tumour changes and to monitor tumoural response to pCRT. 10 The intravoxel incoherent motion (IVIM) model for analysing DWI data allows obtaining tissue diffusion and perfusion parameters and can be used to predict therapy response19–23
The objective of this study is to examine DCE-MRI and DWI diagnostic accuracy in the pathological-response assessment after pCRT in LARC: SIS by DCE-MRI was compared to diffusion parameters derived IVIM model by DWI.
Materials and methods
Patient selection
Eighty-eight consecutive patients with median age of 64.6 years (range 44–84 years) were enrolled in this prospective study, from March 2013 to December 2016. All patients had rectal adenocarcinoma, histologically proven. Inclusion criteria were: clinical T4–3 or nodal involvement. Exclusion criteria were: inability to give informed consent, previous rectal surgery, and contraindications to MRI. The present study was approved by the National Cancer Institute of Naples local ethical committee (institutional deliberation n. 357 of 20.04.2010). All participants provided written informed consent for inclusion in the present study. In this protocol, sample size is obtained using the one-sided t test in a one-sample proportion condition. The significance level of the test was targeted at 0.50. Group sample size of at least 82 cases achieves 80% power to detect a difference between the response accuracy rate of 0.6, considering a known success proportion of 89% (accuracy of SIS reported by Petrillo and colleagues 16 ), an expected success proportion of sample of 95% and a true difference of response accuracy rate δ = 0.
Table 1 reports patient characteristics.
Patient characteristics and histopathological findings.

Not measurable for intraperitoneal lesion.
TRG, tumour regression grade; T0–4, size and extent of tumour; N0–2, extent of lymph node spread.
Neoadjuvant therapy and surgical approach
External radiation therapy was executed using one posterior–anterior and two lateral fields or intensity-modulated radiation therapy (IMRT) system. Standard fractions of 1.8 Gy/day were given, five times a week up to a total dose of 50.4 Gy in 28 fractions. Treatment planning details have been previously reported.24–26 Planning target volume (PTV) for IMRT was produced according to the 83 recommendations of the International Commission for Radiation Units. 27 Each patient received the standard treatment with capecitabine at a dose of 825 mg/m2 twice daily, 5 days a week, for 5 weeks.
Patients underwent TME 8 weeks ± 1 week after the end of pCRT.
Magnetic resonance imaging data acquisition
DCE-MRI was performed before and after pCRT (84–95 days as the range for two MRI exams) with a 1.5T scanner (Magnetom Symphony, Siemens Medical System, Erlangen, Germany) and phased-array body coil. Precontrast coronal T1-weighted two-dimensional (2D) turbo spin-echo (TSE) images, sagittal and axial T2 weigthed (T2w) 2D TSE images were acquired. Axial DW images were obtained with spin-echo diffusion-weighted echo–planar sequence (SE-DW-EPI) at b values equal to 0, 50, 100, 150, 300, 600, 800 s/mm2. Axial dynamic contrast-enhanced T1-weighted fast low angle shot three-dimensional gradient-echo images were obtained: 1 sequence before and 10 sequences, after intravenous injection of 0.1 mmol/kg of a positive, gadolinium-based paramagnetic contrast agent (Gd-DOTA, Dotarem, Guerbet, Roissy-CdG-Cedex, France) at 2 ml/s of flow rate, followed by a 10 ml saline flush at the same rate. Sagittal, axial and coronal postcontrast T1-weighted 2D TSE images, with and without fat saturation were also acquired. Table 2 reports MR sequence parameters. In order to reduce respiratory artefacts, each patient received bowel preparation and antispasmodic medication.
Pulse sequence parameters on magnetic resonance studies.

AT, acquisition time; DW, diffusion weighted; EPI, echo–planar sequence image; FA, flip angle; FLASH, fast low angle shot; FOV, field of view; SE, spin echo; ST, slice thickness; TE, echo time; TF, turbo factor; T1w, T1 weighted; TSE, turbo spin echo; T2w, T2 weighted; TR, repetition time; 2D, two dimensional; 3D, three dimensional.
Magnetic resonance image data analysis
Image evaluation was done by consensus of two radiologists with 25 years and 10 years of experience in abdominal MRI reading and assessing.
Radiologists, using precontrast T1-weighted images, 28 drawn manually regions of interests (ROIs) along tumour contours, covering the whole lesion with exclusion of peripheral fat, avoiding artefact and blood vessels. For DW-MRI, the radiologists, using DWI with the highest b value, manually drew ROIs along tumour contours to obtain DW-MR volume of interest (VOI).
In order to perform SIS analysis, an OsiriX (Pixmeo SARL, Bernex, Switzerland) plugin has been developed by the authors. 29 For each VOI using the time intensity, curves were calculated using the median value of two dynamic parameters: the maximum signal difference (MSD) and the washout slope (WOS). 30 Then, the percentage changes were calculated before and after pCRT (ΔMSD = (MSD1 − MSD2)/MSD1 × 100 and ΔWOS = (WOS1 − WOS2)/WOS1 × 100), and their combination as defined by Petrillo and colleagues. 15
ADC was calculated using the mono-exponential model,19,20 while IVIM-derived parameters19,20,23,31–34 were calculated by means of variable projection (VARPRO) algorithm. 35 In a previous study we reported that the VARPRO algorithm is superior to the conventional Levenberg–Marquardt algorithm for nonlinear curve fitting in the IVIM method for DW-MRI data analysis. 36
All analyses were performed using Matlab R2007a (The MathWorks Inc., Natick, MA).
No image coregistration was used: we took care to avoid slices where motion artefacts were visible; moreover, a volumetric analysis in order to estimate functional parameters was done to minimize voxel misalignment errors.
Evaluation of pathologic response
Pathologic response evaluation was effected using the procedure described by both Avallone and colleagues 24 and Andreola and colleagues, 37 considering the TRG used by Mandard and colleagues, 38 assessed by two experienced pathologists; patients with TRG 1 or 2 were classified as major responders, while the remaining patients (TRG 3, 4, or 5) were considered as nonresponders. Patients with TRG 1 were categorized as complete responders.
Statistical analysis
Data were expressed as median ± standard deviation values. Percentage changes of perfusion and diffusion parameters among responders and nonresponders and among pathological complete responders and incomplete responders were analysed using the Mann–Whitney nonparametric test. Receiver operating characteristic (ROC) curves were calculated to obtain diagnostic performance of SIS and diffusion parameters. Area under the ROC curve (AUC) was considered and optimal thresholds were obtained maximizing the Youden index. Sensitivity, specificity, positive predictive value (PPV) and negative predictive value (NPV) were performed. Fisher’s exact tests were used to assess if the results were statistically significant. McNemar tests were used in order to compare diagnostic performance for each modality and derived parameters. Moreover, a linear classifier was used to assess diagnostic performance of the parameters’ couple combinations, using percentage change of each single parameter and of all derived parameters obtaining sensitivity, specificity, PPV, NPV and accuracy.
A p value < 0.05 was considered significant for all tests. All analyses were performed using Statistics Toolbox of Matlab R2007a.
Results
Each patient had rectal adenocarcinomas; after pCRT and TME, 19 patients had TRG 1, 33 had TRG 2, 21 had TRG 3, 15 had TRG 4, while there were none with TRG 5. Consequently, 52 patients were responders and 19 complete responders by TRG.
Table 1 reports patient characteristics, SIS, ΔADC, ΔDt, ΔDp, Δf and histopathological findings.
Mann–Whitney nonparametric test showed statistically significant differences in SIS, ΔADC and ΔDt median values between responder patients and nonresponders (Table 3). Table 4 reports SIS and diffusion parameters performance, while Table 5 shows the performance of each parameter’s couple combination (Δf and ΔDp, Δf and ΔDt, ΔDp and and ΔDt, SIS and ΔADC, SIS and Δf, SIS and ΔDt, SIS and ΔDp, ΔADC and Δf, ΔADC and ΔDt, ΔADC and ΔDp) to differentiate responders from nonresponders and to detect complete responders versus incomplete responders. Results were statistically significant for each parameter (Fisher’s exact test p < 0.01). SIS diagnostic performance to assess pCRT response was statistically powerful compared with ∆ADC, ∆f, ∆Dt and ∆Dp performance, resulting in an increase of values of sensitivity and specificity (p < 0.05 at McNemar test). Conversely, in the discrimination of complete pathological responders, SIS obtained the same accuracy (78%) of ∆f and ∆Dp. However, ∆f and ∆Dp had a very low sensitivity.
Standardized index of shape change and diffusion parameter change median values for responders and nonresponders groups.
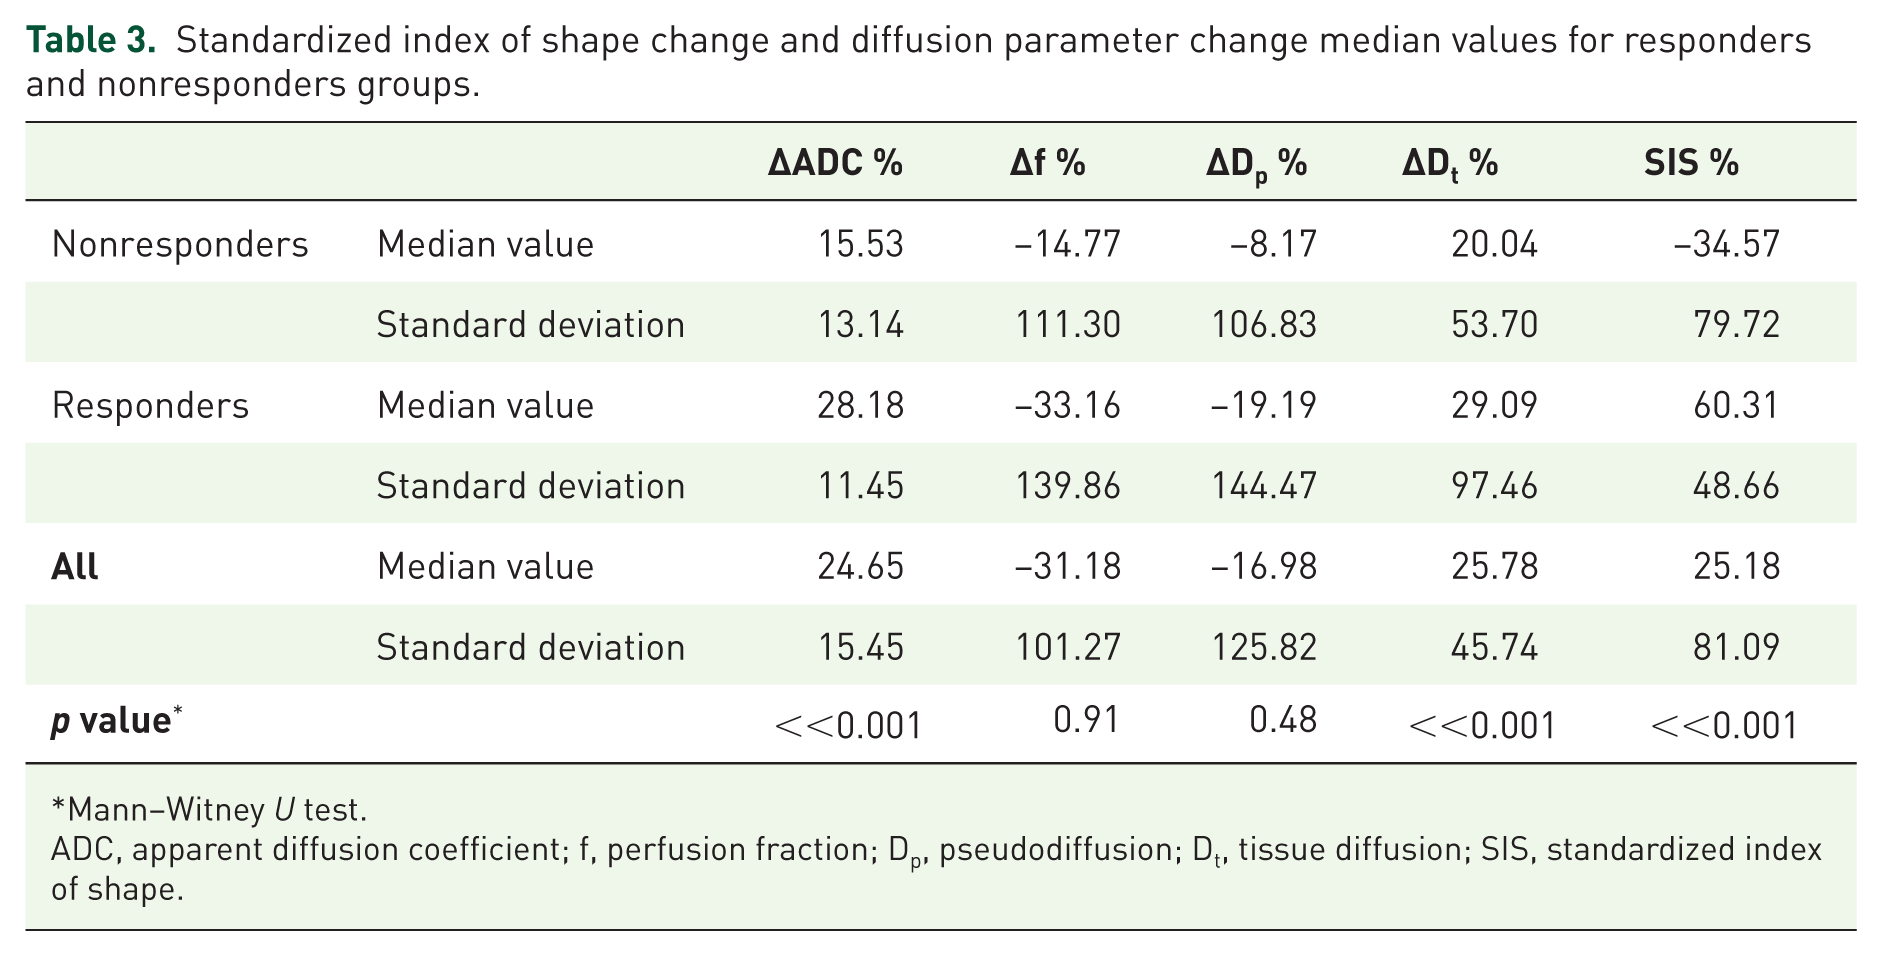
Mann–Witney U test.
ADC, apparent diffusion coefficient; f, perfusion fraction; Dp, pseudodiffusion; Dt, tissue diffusion; SIS, standardized index of shape.
Performance of standardized index of shape and diffusion parameters’ change.
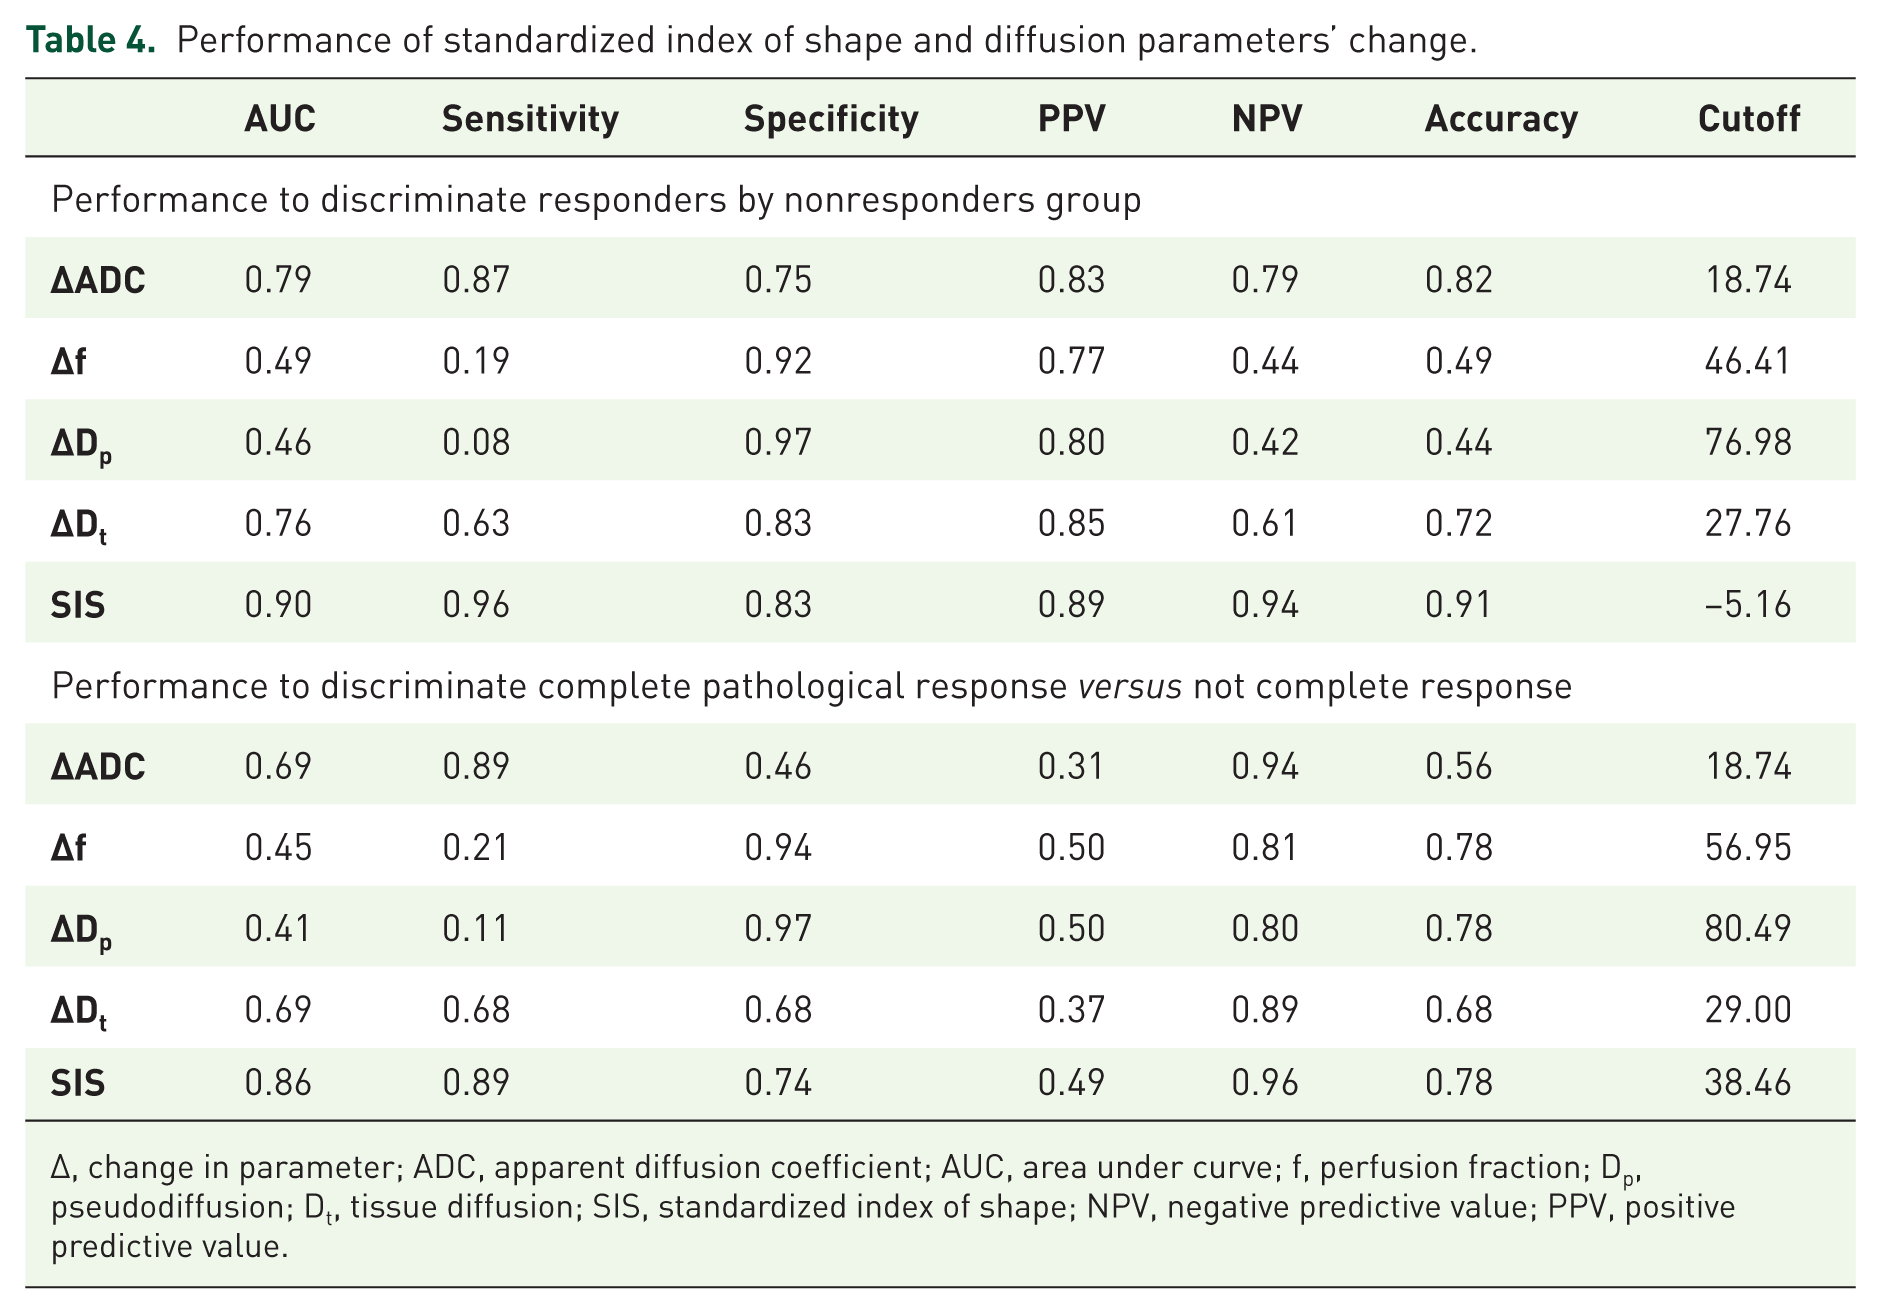
∆, change in parameter; ADC, apparent diffusion coefficient; AUC, area under curve; f, perfusion fraction; Dp, pseudodiffusion; Dt, tissue diffusion; SIS, standardized index of shape; NPV, negative predictive value; PPV, positive predictive value.
Performance of combinations of standardized index of shape with the diffusion parameters’ change.

∆, change in parameter; ADC, apparent diffusion coefficient; AUC, area under curve; f, perfusion fraction; Dp, pseudodiffusion; Dt, tissue diffusion; SIS, standardized index of shape; NPV, negative predictive value; PPV, positive predictive value.
Couple parameter combinations and linear combinations of all MR-extracted parameters did not increase diagnostic performance compared with SIS, both to discriminate responders versus nonresponders and to detect pathological complete responders.
Figure 1(a) reports ROC analysis for SIS and diffusion-derived parameters differentiating responders from nonresponders. Figure 1(b) shows ROC analysis for SIS and diffusion-extracted parameters to detect complete pathological response.
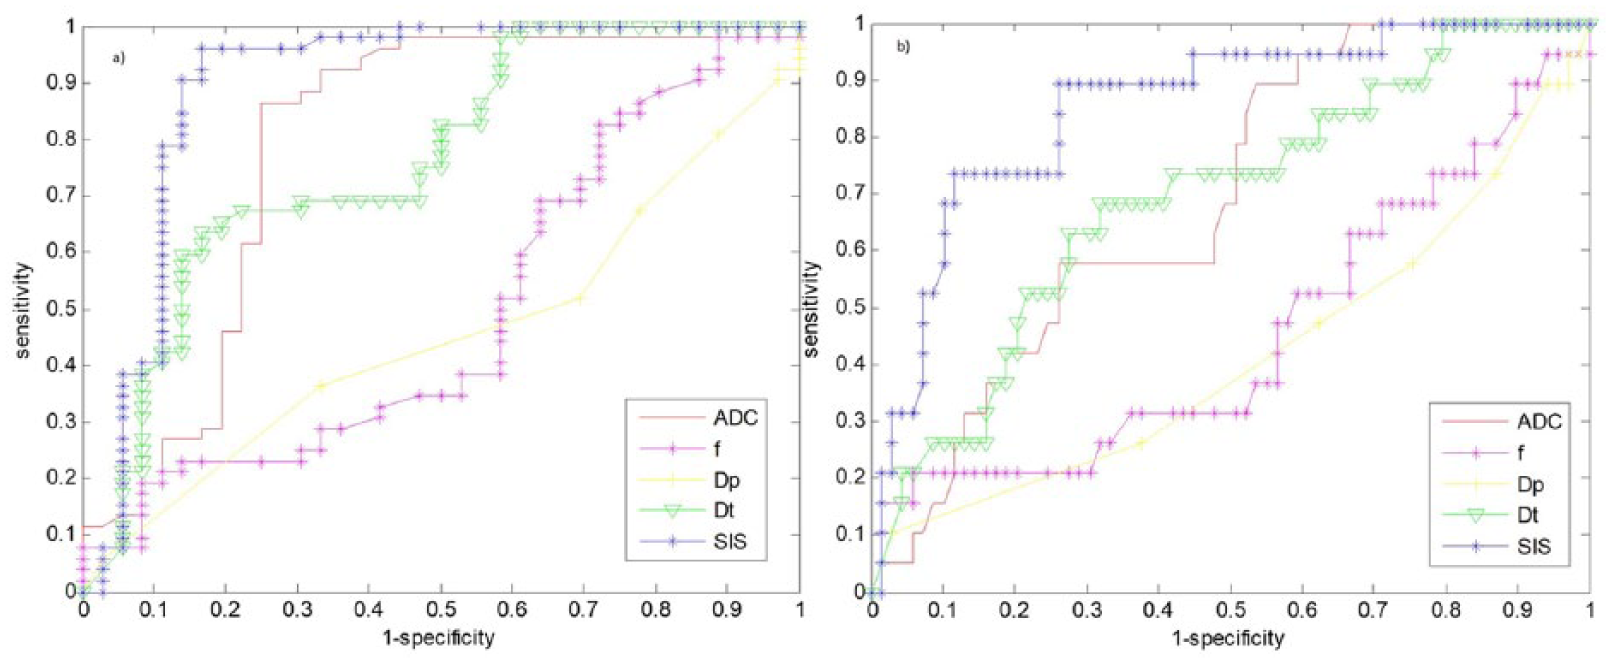
Receiver operating characteristic analysis for the standardized index of shape and diffusion parameters by intravoxel incoherent motion.
Figure 2(a), (c) and (e) show DCE-MRI images and SIS evaluation for a responder patient with TRG 2 and SIS = 13.34%. For the same patient, Figure 2(b) and (c) show the ADC map pre- and post-treatment. ΔADC value was 38.79%.
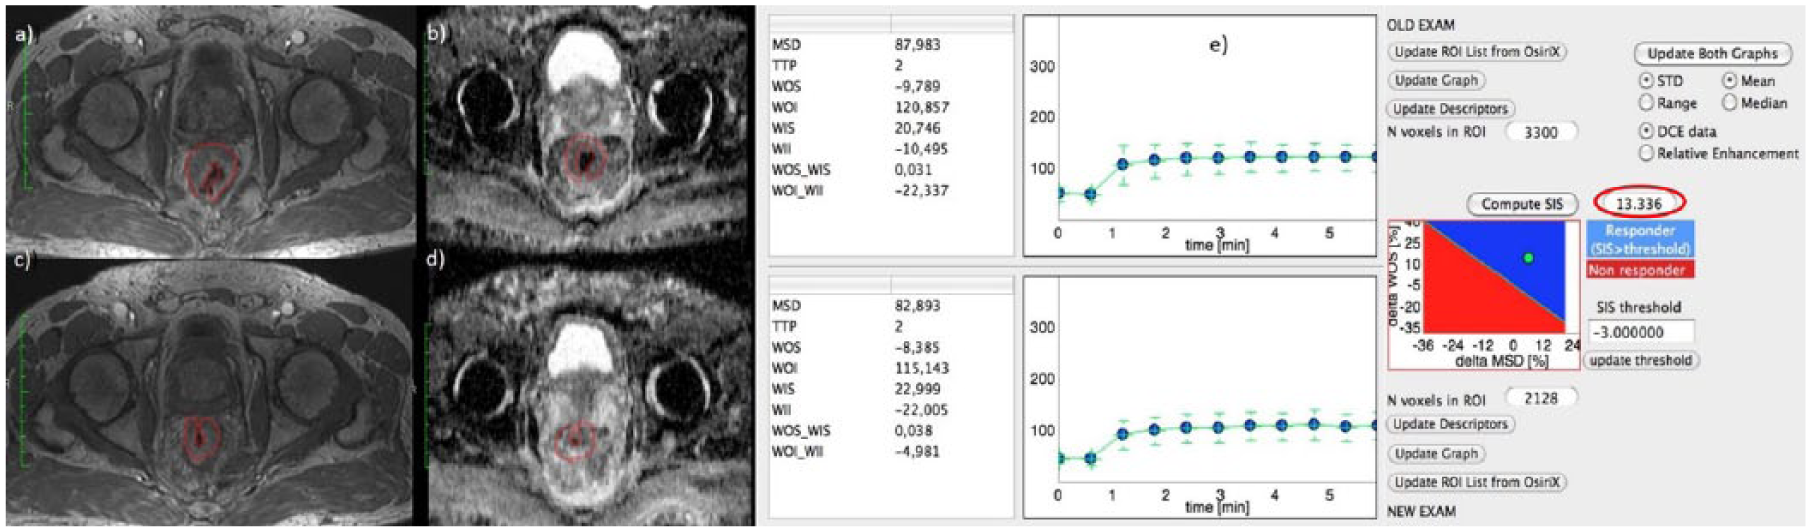
Dynamic contrast-enhanced magnetic resonance images and standardized index of shape analysis for a responder patient with tumour regression grade 2.
Figure 3(a), (c) and (e) show DCE-MRI images and SIS evaluation for a nonresponder patient with TRG 4 and SIS = −75.19%. For the same patient, Figure 3(b) and (c) show the ADC map pre- and post-treatment. ΔADC value was 8.92%.

Dynamic contrast-enhanced magnetic resonance imaging and standardized index of shape analysis for a nonresponder patient.
Figure 4(a), (c) and (e) show DCE-MRI images and SIS evaluation for a complete pathological responder patient with TRG 1 and SIS = 117.64%. For the same patient, Figure 4(b) and (c) show the ADC map pre- and post-treatment. ΔADC value was 54.86%.
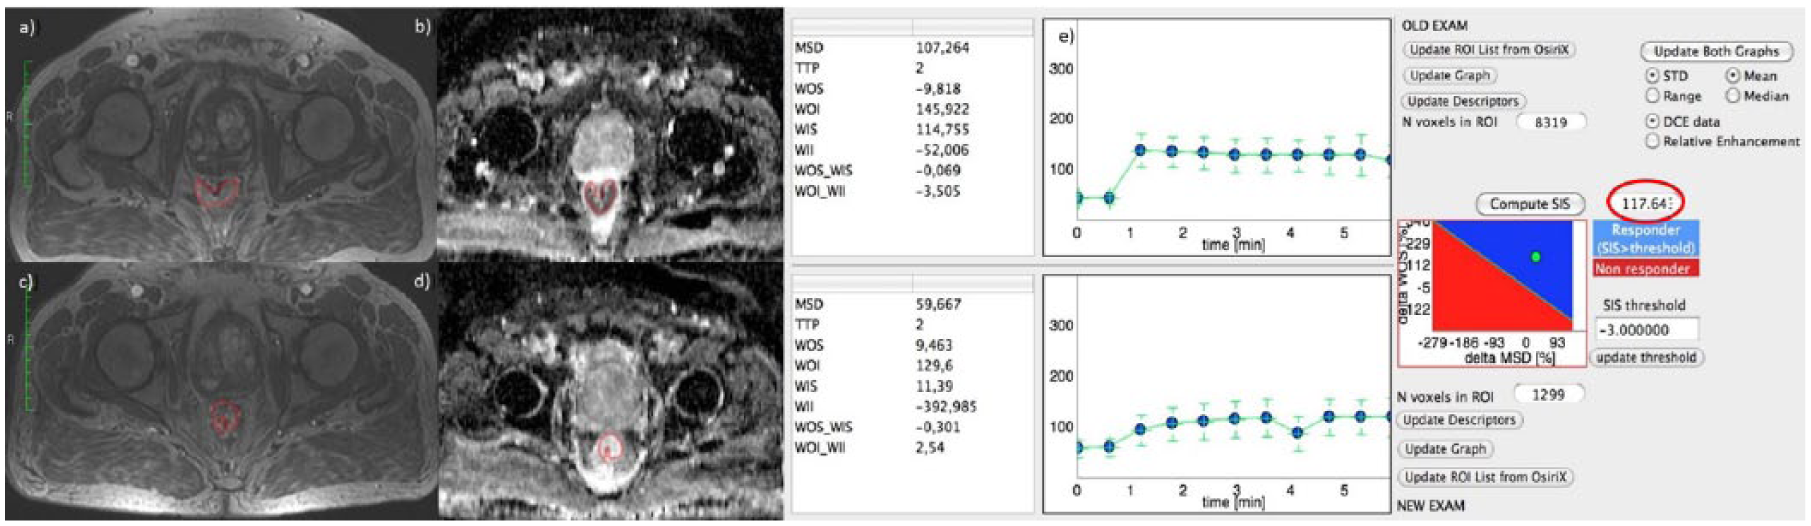
Dynamic contrast-enhanced magnetic resonance imaging and standardized index of shape analysis for a complete pathological responder patient.
Discussion and conclusion
Recently, there has been emergent interest in functional imaging to improve treatment-response assessment allowing detection of treatment-induced changes before morphological changes are visible. 10 DCE-MRI and DWI have emerged as powerful tools for predicting pCRT response in several types of tumours and also in rectal cancer. The objective of this study was to examine DCE-MRI and DWI diagnostic accuracy in the pathological-response assessment after pCRT in LARC: SIS by DCE-MRI was compared with the diffusion-parameter-derived IVIM model by DWI.
To the best of our knowledge, there are no other studies that compare DCE-MRI and DWI data in LARC and their combination for therapy-response assessment after pCRT. There are several studies that with a single modality examine the capability of evaluating therapy response.11–16,39,40 We demonstrated the ability of SIS to detect complete and significant response after pCRT in LARC 15 and the strength of SIS compared with fluorodeoxyglucose positron-emission tomography ( 18 F-FDG-PET) examination. 41 Some studies demonstrated the role of DWI in LARC for assessing therapy response39,40 and several studies evaluated the use of the IVIM model for extracting DWI data by both perfusion and diffusion parameters in different types of tumours.32,33,42 In our previous study, 10 we compared SIS with diffusion parameters and their combination after short-course radiotherapy in LARC, demonstrating that no accuracy increase was obtained combining linearly each possible perfusion and diffusion parameter couple extracted by DCE-MRI and DWI or combining all functional MR-derived parameters with respect to SIS alone.
Our results showed that there were statistically significant differences between responders and nonresponder patients for SIS, ∆ADC and ∆Dt (p < 0.001 with Mann–Whitney U test). The best parameters for classifying responder and nonresponder patients were ∆ADC and SIS, with a sensitivity of 87% and 96%, a specificity of 75% and 83% and an accuracy of 82% and 91%, respectively, using cutoffs of 18.74% and −5.16%, respectively. SIS diagnostic performance to assess pCRT response was statistically significant compared with ∆ADC, ∆f, ∆Dt and ∆Dp performance, resulting in an increase both of sensitivity and specificity (p < 0.05 with McNemar test).
Patients with pathological CR have a favourable long-term outcome with very good local control and disease-free survival. 38 Adopting a ‘wait and see’ policy for clinical complete responders helps prevent surgical morbidity and mortality risks.43–45 Choi and colleagues 39 reported that ADC low percentile values have significant difference between pathological CR and nonpathological CR groups. Our findings showed that the best parameter for detecting complete responders was SIS, with a sensitivity of 86% and a specificity of 74%, with a cutoff of 38.46%. SIS showed the same accuracy (78%) as IVIM-derived ∆f and ∆Dp. However, ∆f and ∆Dp had a very low sensitivity, probably due to major complexity in the IVIM-derived parameter calculation which is more influenced by image noise. Combining different functional imaging techniques could increase the specificity of therapy response. Lambrecht and colleagues 46 demonstrated that combining 18F-FDG PET/computed tomography (CT) with DWI may further increase the response assessment specificity. In our study, instead, each parameter couple combination and the linear classifier of all MR-extracted parameters did not determine an increase of the diagnostic performance compared with SIS alone, both in detecting significant and complete responders.
There are some possible limits in our study: two radiologists evaluated the MR images by consensus in a single session, therefore intraobserver variability was not evaluated. IVIM-extracted parameter reproducibility was not assessed; however the use of median values for VOI for each DCE and DW parameter allows obtaining more robust measures. In this study, our aim was to assess pathological complete and significant response after neoadjuvant therapy. Other modalities having an important role in clinical diagnosis (CT, endoscopy and endoscopic ultrasound) were not included, however, these could be added in a future study for patient stratification.
SIS is an encouraging DCE-MRI semiquantitative functional biomarker suitable for assessing and predicting pCRT response guiding surgeon versus more or less conservative treatment. SIS allows assessment of preoperative treatment response with high accuracy while DWI-derived parameters reached less accuracy compared with SIS. Moreover, in combining linearly DCE- and DWI-derived parameters, no increase in accuracy was obtained.
Footnotes
Acknowledgements
Writing/editorial support in the preparation of this manuscript was provided by Manuela Di Giovanni, University of Technology, Sydney, Australia.
Funding
This research received no specific grant from any funding agency in the public, commercial, or not-for-profit sectors.
Conflict of interest statement
The authors declare that there is no conflict of interest.