
Abstract
Background:
The application of genomic technologies to patient tumor samples identified groups of signaling pathways which acquire activating mutations. Some cancers are dependent on these mutations and the aberrant proteins resulting from these mutations can be targeted by novel drugs which can eradicate the cancer.
Methods:
We used www.cbioportal.org to determine the frequency of ERBB mutations in solid tumors. We then determined the sensitivity of a panel of cell lines to clinically available PI3K inhibitors. Using proliferation and apoptosis assays as well as functional interrogation with reverse phase protein arrays we demonstrated the impact of targeting ERBB-mutant cancers with the combination of a PI3K inhibitor and the pan-HER family inhibitor afatinib.
Results:
In over 14,000 patients we found that 12% of their tumors have an ERBB family gene mutation (EGFR, ERBB2, ERBB3 and ERBB4). In cancers not commonly associated with HER family protein overexpression, such as ovarian, endometrial, melanoma and head and neck cancers (n = 2116), we found that ERBB family mutations are enriched, occurring at rates from 14% to 34% and commonly co-occur with PIK3CA mutations. Importantly, we demonstrate that ERBB family mutant cancers are sensitive to treatment with PI3K inhibitors. Finally we show that the combination of afatinib and copanlisib represents a novel therapeutic strategy for patients whose cancers harbor both ERBB family and PIK3CA mutation.
Conclusions:
We demonstrate that ERBB family mutations are common in cancers not associated with overexpression or amplification of HER family proteins. These ERBB family mutant cancers are sensitive to treatment with PI3K inhibitors, and when combined with pan-HER inhibitors have synergistic antiproliferative effects.
Introduction
The application of genomic technologies to tumors has found certain signaling pathways commonly acquire activating mutations in a variety of cancers. In some cases, cancers are dependent on these mutations and the resulting aberrant proteins can be targeted by novel drugs. This has led to a paradigm shift in cancer therapy, from choosing nonselective cytotoxic drugs to targeted therapies, where the molecular and genetic characteristics of the tumor are used to select a particular therapy. 1 Some tumors thus contain mutations within oncogenes or tumor suppressor genes that predict responses to targeted anticancer therapies. Examples include epidermal growth factor receptor (EGFR) mutations which are found in up to 15% of non-small cell lung cancers and are targetable by EGFR inhibitors (erlotinib and gefitinib). 2 However, while considerable progress has been made in treatment options for some cancer types based on targeted therapies, only a minority of patients with cancer have tumors with targetable molecular aberrations. Therefore, we need to augment these successes with therapies that target alternate molecular aberrations and signaling pathways.
The four erb-B receptor tyrosine kinase family members [ERBB1 (EGFR), ERBB2 (HER2), ERBB3 (HER3) and ERBB4 (HER4)] (ERBB-family) encode type I transmembrane proteins that share common structural properties and are activated by either homo- or hetero-dimerization with other ERBB family members.3,4 Dimerization results in activation of signal transduction pathways such as the PI3K/AKT and MAPK/ERK pathways, which are associated with oncogenesis and cancer therapy resistance. 3 Recent studies found that somatic ERBB2, ERBB3 and ERBB4 mutations occur in breast, colorectal and gastric cancers,5–7 with ERBB3 mutations being associated with an aggressive phenotype. Modeling experiments of ERBB4 mutations have shown their ability to alter the signaling properties of the HER family members. Our study identifies that ERBB family mutations which are commonly enriched in cancers which are not HER2 amplified are targetable with PI3K inhibitors. We also demonstrate that cancers which have both an ERBB family and PIK3CA mutation are most sensitive to the combination of the pan-HER kinase inhibitor afatinib and the PI3K inhibitor copanlisib, identifying a new therapeutic strategy for treating patients who harbor ERBB family mutations.
Results
ERBB family mutations occur in more than 10% of analyzed tumors from www.cbioportal.org
Individual ERBB family (EGFR, ERBB2, ERBB3 and ERBB4) somatic mutations were detected in 12% of cancers identified from www.cbioportal.org. Our analysis included 14,539 cases of cancer from 81 different datasets (Table 1), and found PIK3CA mutations occur in 13% of patient tumors, 14% have an ERBB family gene mutation, while 2% have a co-occurring PIK3CA and ERBB family gene mutation [Figure 1(a)].
Analysis of % of ERBB family gene mutations and PIK3CA mutations in 81 different cancer databases reported on the www.cbioportal.org website as of 26 July 2016. 8 The table includes data for % of individual ERBB mutations, as well as the % of tumors which have dual ERBB family/PIK3CA mutations.

Mut, mutation; WT, wild type.

Frequency of somatic ERBB family mutations in (a) all 81 datasets available on www.cbioprtal.org (n = 14,539 cancers) or (b) in datasets where ERBB family mutations are enriched, including esophageal, ovarian, endometrial, melanoma, stomach, head and neck, bladder and colorectal cancers. Mut, mutated (somatic); WT, wild type. ERBB family/PIK3CA WT, blue; ERBB family WT/PIK3CA Mut, red; ERBB family Mut/PIK3CA WT, green; ERBB family/PIK3CA Mut, purple.
Mutations in the PIK3CA gene are some of the most commonly occurring targetable mutations detected in solid tumors. Using PIK3CA mutation frequency (13% of tumors analyzed) as a benchmark, we restricted the studies we analyzed to cases where ERBB family mutations were detected at a comparable or higher frequency. In these studies we found somatic ERBB family mutations in 29% of cases (both alone and co-occurring with PIK3CA mutations), whilst PIK3CA mutations alone occur in 15% of cancers [Figure 1(b)]. We also found that ERBB family mutations and PIK3CA mutations co-occur in 6% of these cancers. Our findings demonstrate that even in cancer subtypes not commonly associated with HER family protein overexpression such as ovarian, endometrial, melanoma and head and neck cancer that ERBB family mutations are enriched and can co-occur with PIK3CA mutations.
Somatic ERBB family mutations are enriched in specific cancer subtypes
We selected datasets for further analysis which were enriched for ERBB family mutations (>12% ERBB family mutated, comparable to 13% of PIK3CA mutation rate) and included the largest numbers of patients (Table 2).
Frequency of PIK3CA and ERBB family mutations detected in the largest cancer studies listed on www.cbioportal.org (n = 3454). The cancer subsets selected for this analysis must have a frequency of ERBB family mutations over 12%.

We found that somatic ERBB family mutations occur between a rate of 14.7% in head and neck squamous cell carcinoma and 27.7% in skin cutaneous melanoma. Analysis of ERBB family mutations reveals that over 20% of bladder urothelial carcinoma (n = 33/130), colorectal adenocarcinoma (n = 130/619), esophageal carcinoma (n = 38/185), pan-lung cancer (n = 271/1144), stomach adenocarcinoma (n = 98/289) and skin cutaneous melanomas (n = 101/366) have an ERBB family mutation which does not co-occur with a PI3KCA mutation.
Analysis of the datasets for which somatic ERBB family mutations are enriched (>12%) reveals that somatic PIK3CA mutation rates vary between 1.4% in melanoma and 41.7% in uterine corpus endometrioid carcinoma (Table 3). We found in cervical squamous cell carcinomas and endocervical adenocarcinomas and uterine corpus endometrioid carcinomas that over 20% of these cancers had a PIK3CA mutation which occurred without an ERBB family mutation.
The number and percentage of ERBB family mutations detected in the largest cancer studies listed on www.cbioportal.org (n = 3454). The cancer subsets selected for this analysis must have a frequency of ERBB family mutations over 12%.
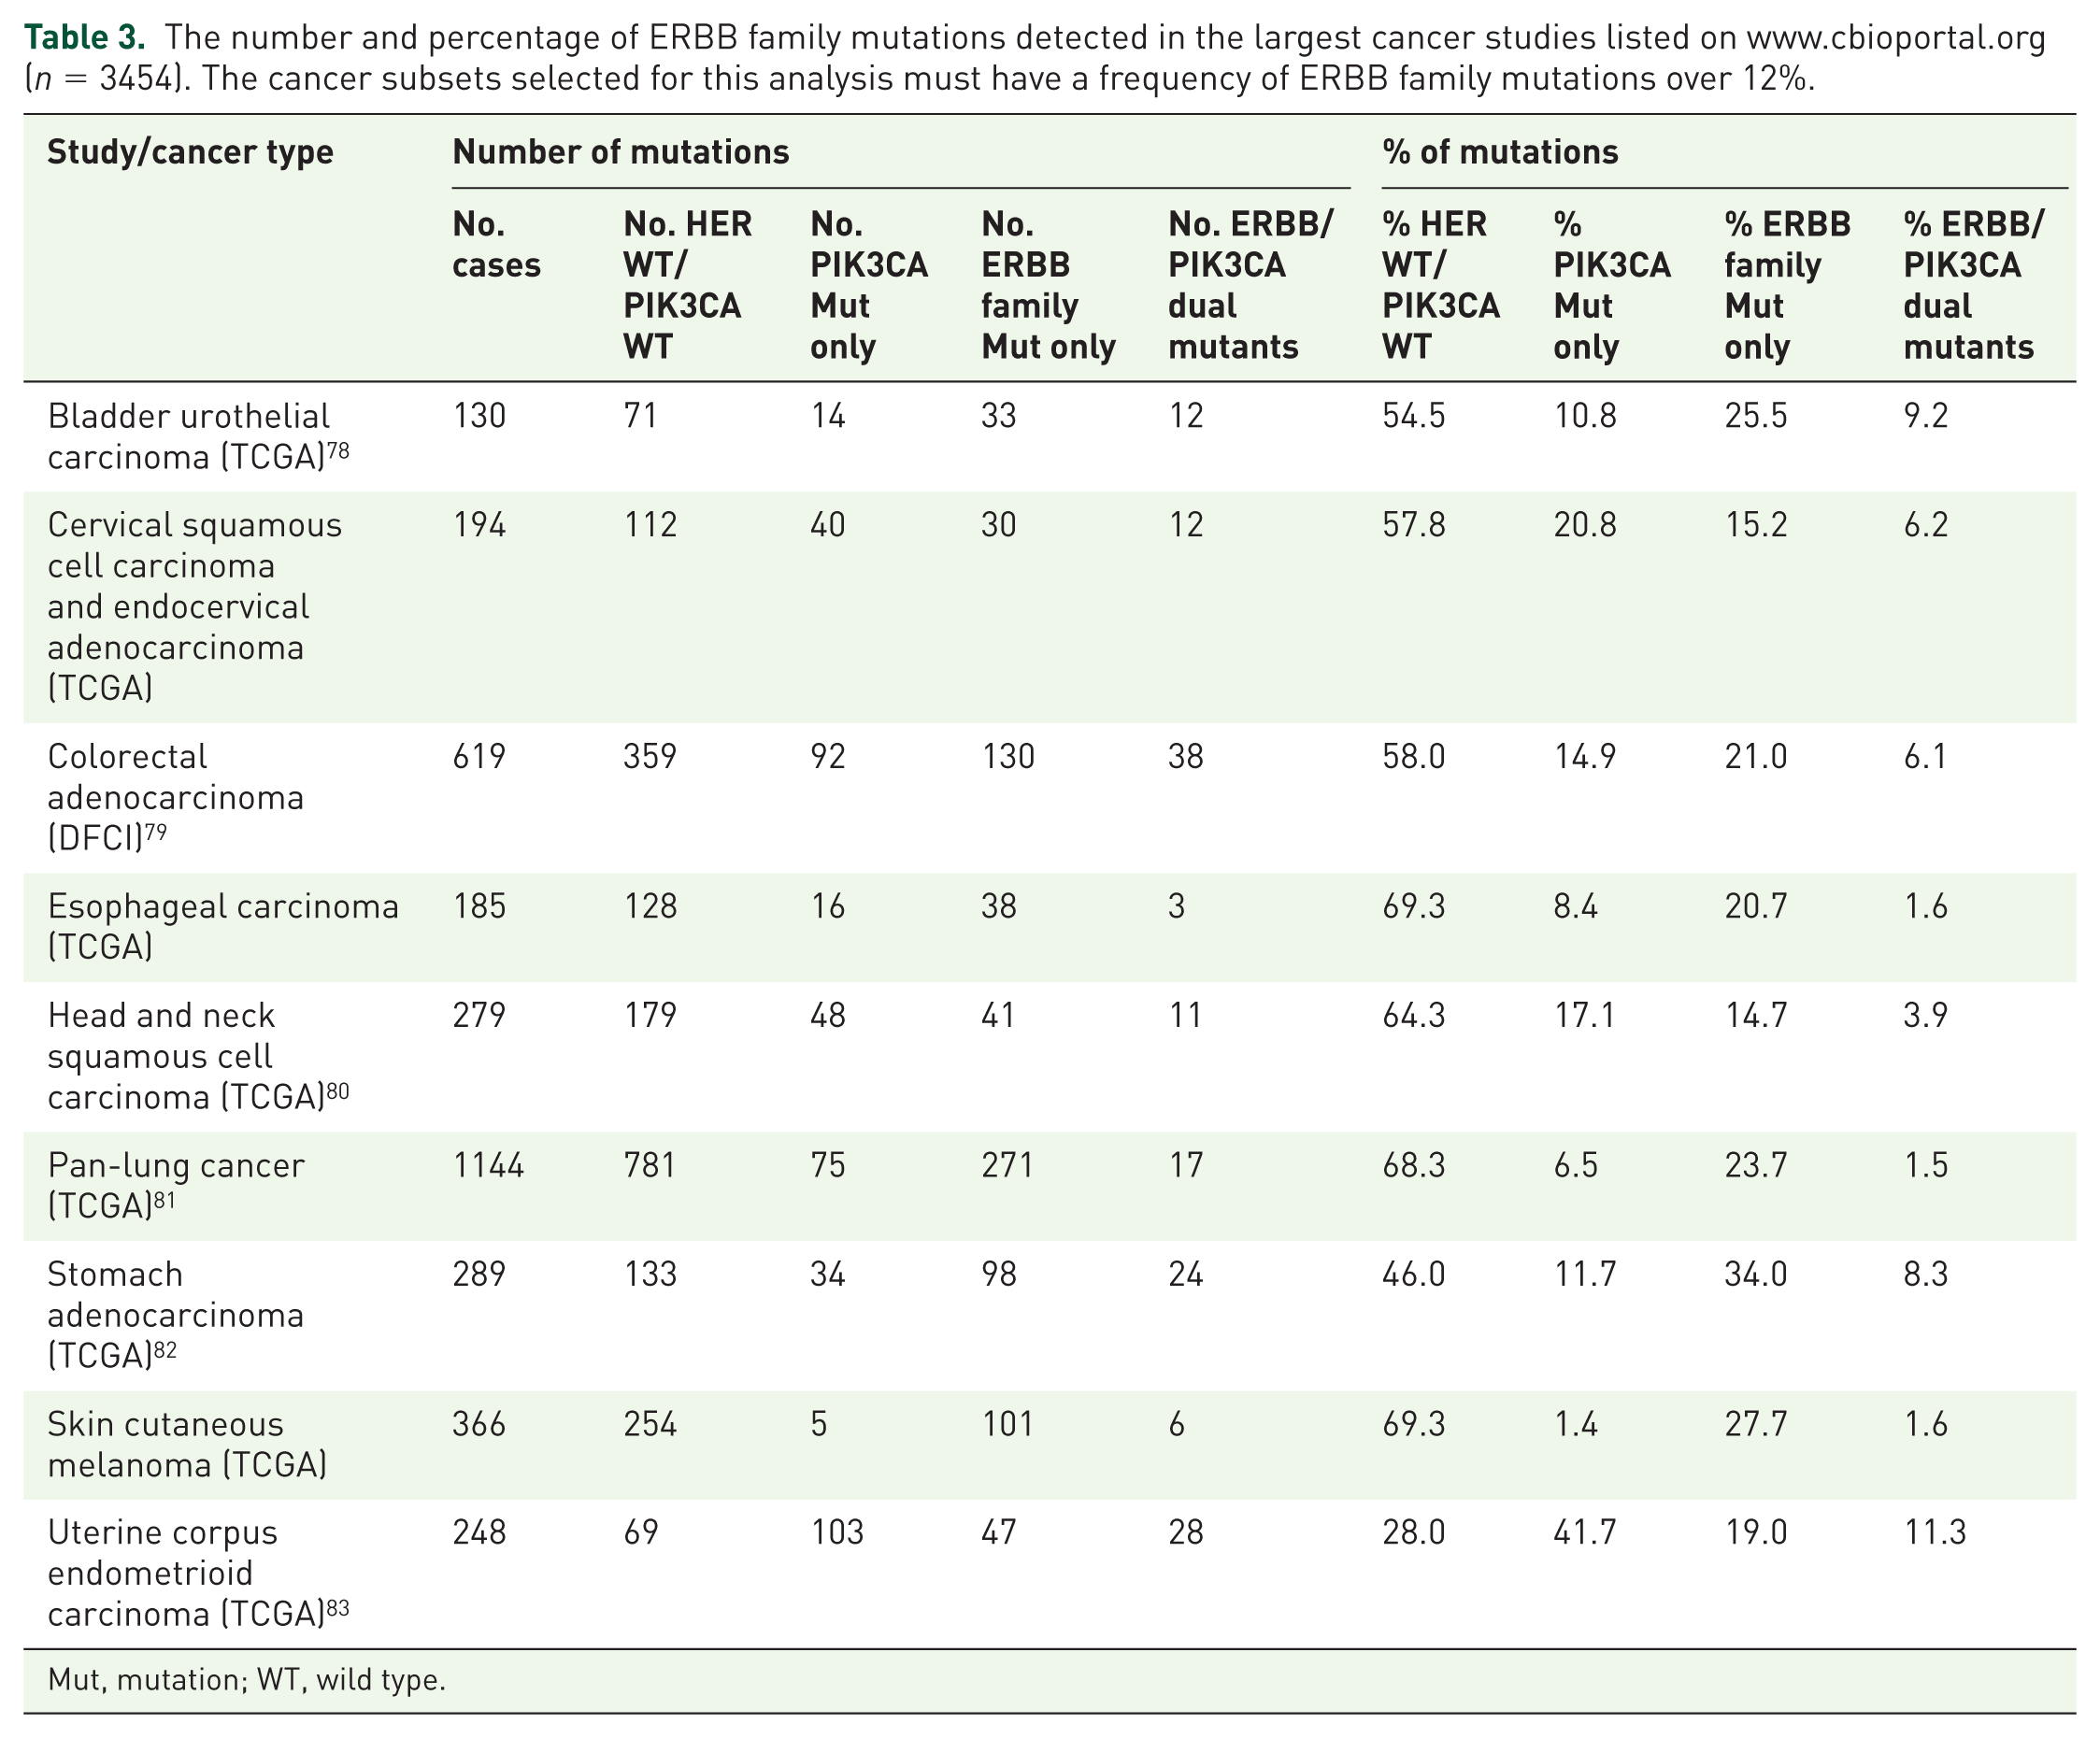
Mut, mutation; WT, wild type.
We finally found that co-occurring ERBB family and PIK3CA mutations can be identified in this subset of patient tumors at rates ranging between 1.5% in pan-lung cancer patients and 11.3% in uterine corpus endometrioid carcinomas. Interestingly, in bladder urothelial carcinomas, stomach adenocarcinomas and uterine corpus endometrioid carcinomas more than 8% of patient tumors have a co-occurring PIK3CA and ERBB family mutation.
The predominant mutated ERBB family members identified in bladder urothelial carcinomas were ERBB2 (9%) and ERBB3 (11%) (Table 2). In the pan-lung cancers these were EGFR (10%) and ERBB4 (9%) whilst in the stomach adenocarcinomas these were ERBB3 (11%) and ERBB4 (13%). Finally ERBB4 (16%) was the most commonly mutated in the skin cutaneous melanomas.
ERBB family mutations and PIK3CA mutations commonly co-occur in patient tumors
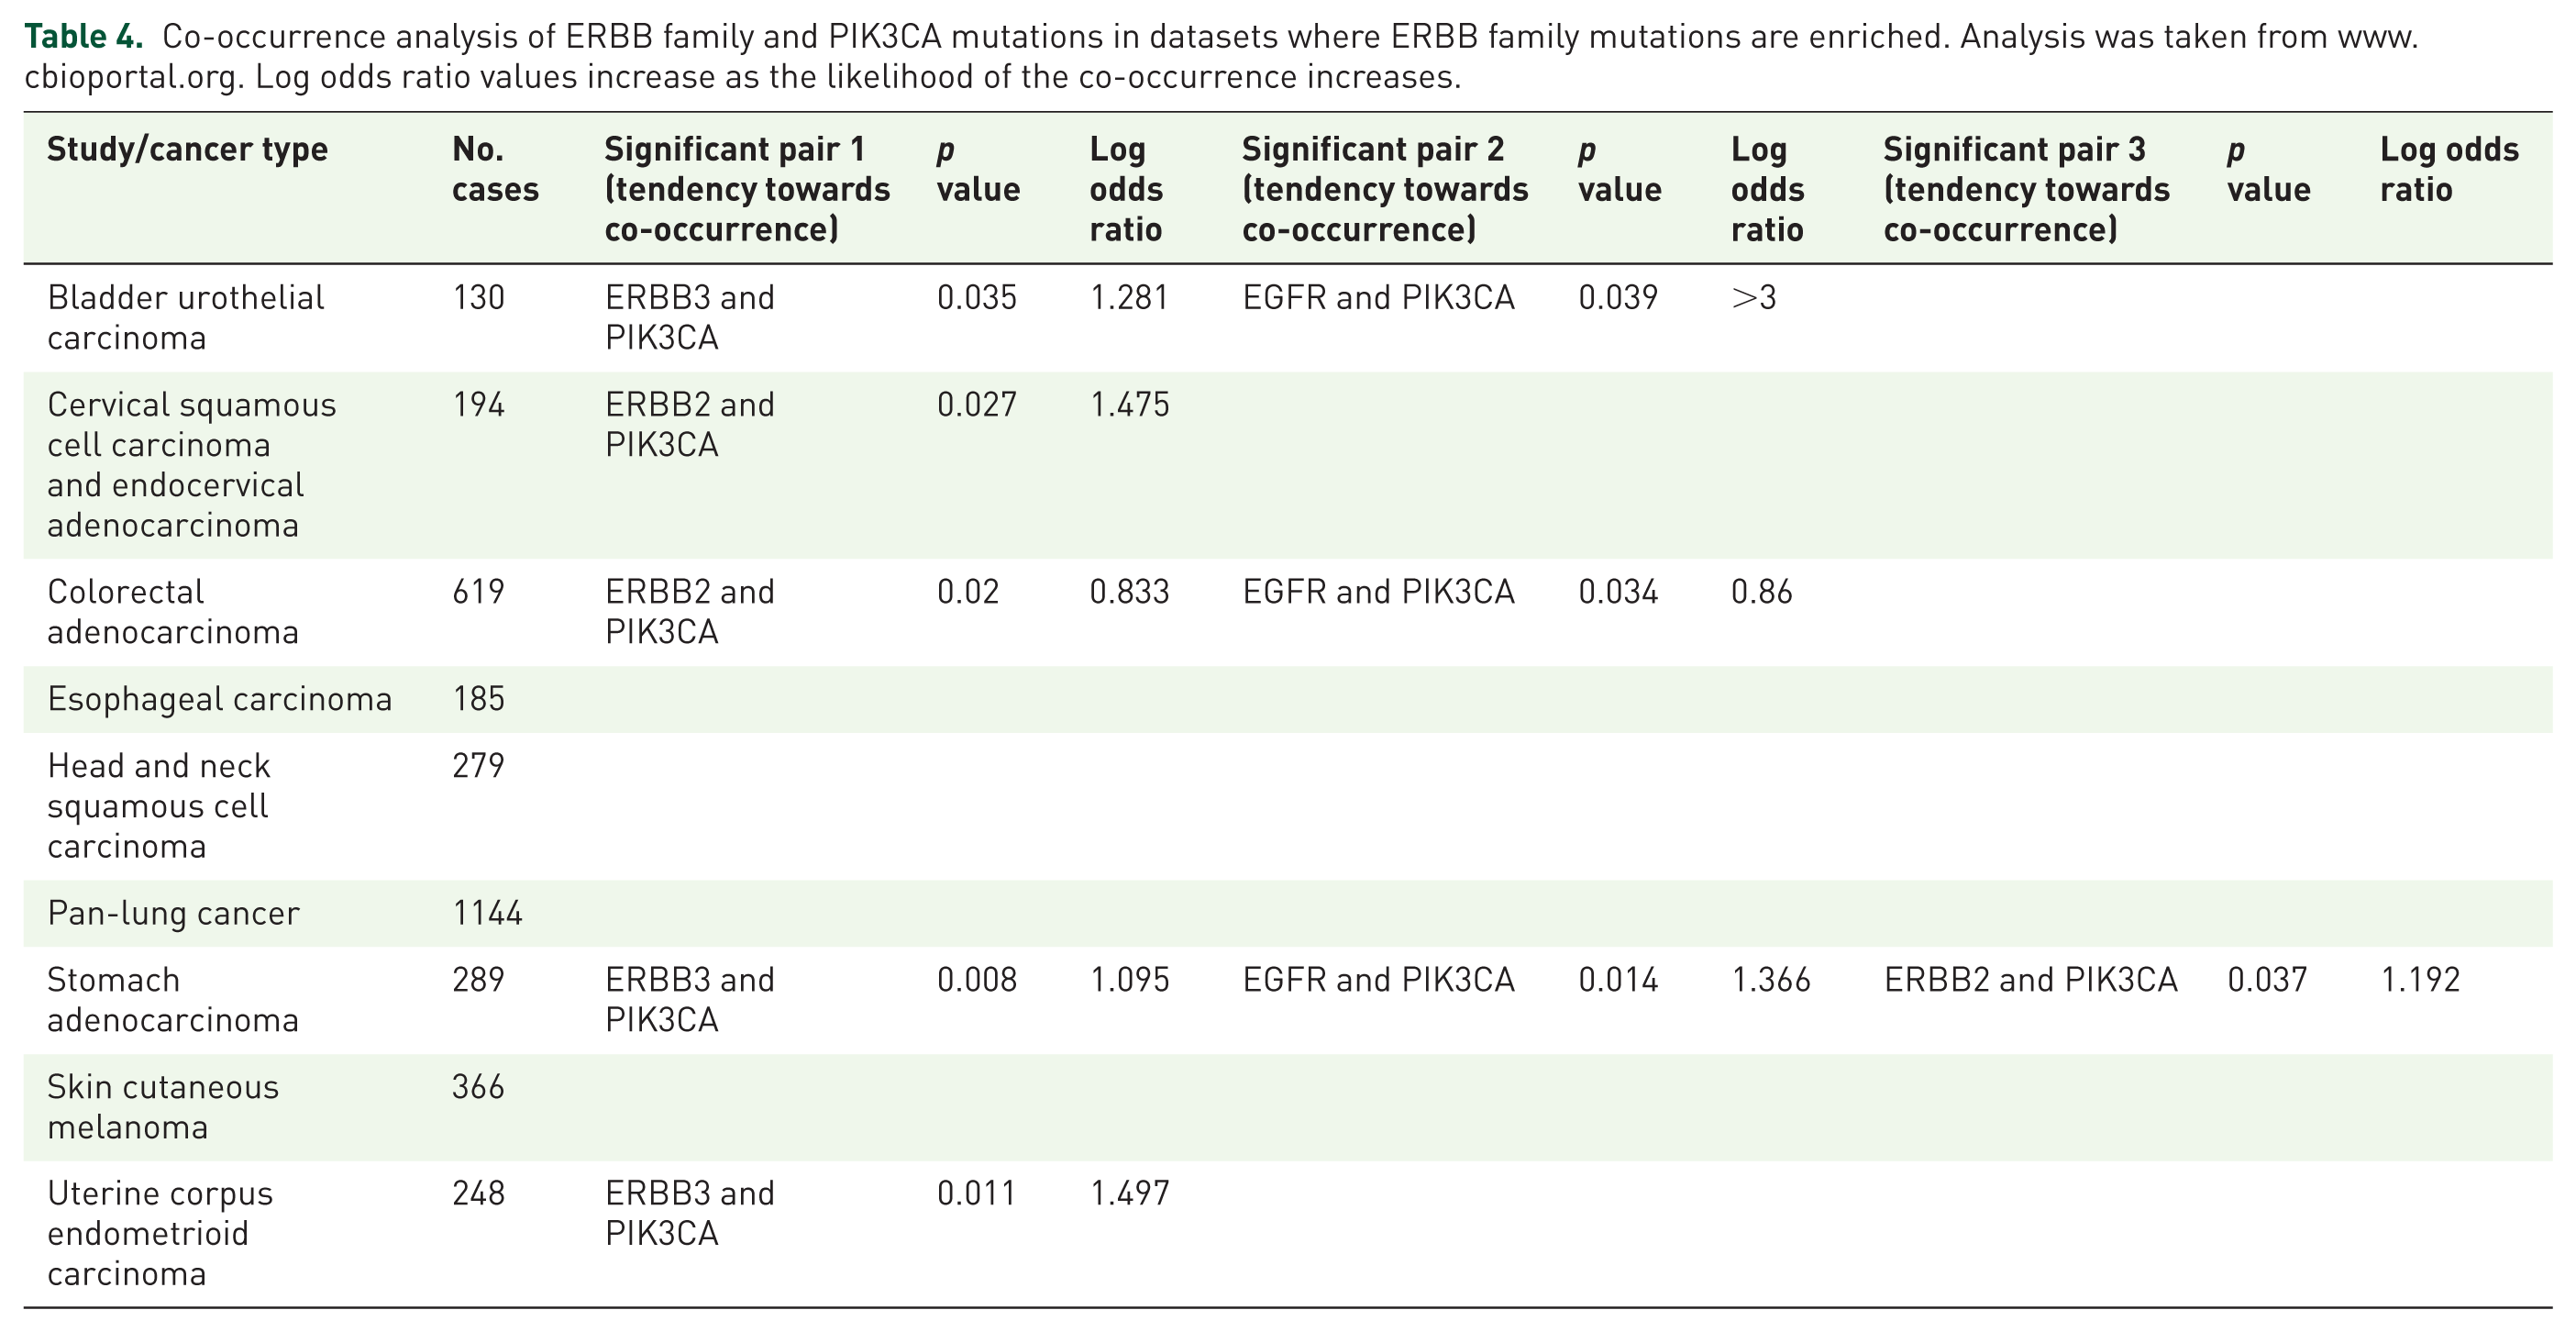
In patients with bladder urothelial carcinomas PIK3CA mutations significantly co-occur with ERBB3 (p = 0.035) and EGFR (p = 0.039), whilst in cervical squamous cell carcinomas and endocervical adenocarcinomas PIK3CA mutations significantly co-occur with ERBB2 (p = 0.027). In colorectal adenocarcinomas PIK3CA co-occurs with ERBB2 (p = 0.02) and EGFR (p = 0.034), whilst in uterine corpus endometrioid carcinomas PIK3CA co-occurs with ERBB3 (p = 0.011). Finally, in stomach adenocarcinomas there is a significant likelihood that tumors which have a PIK3CA mutation have a co-occurring mutation in ERBB3 (p = 0.008), EGFR (p = 0.014) and ERBB2 (p = 0.037) (Table 4). Despite the obvious co-occurrence of mutations in these families of genes, little work to date has been performed to understand the functional and prognostic importance of co-occurring mutations in PIK3CA and ERBB family mutations in cancer.
Co-occurrence analysis of ERBB family and PIK3CA mutations in datasets where ERBB family mutations are enriched. Analysis was taken from www.cbioportal.org. Log odds ratio values increase as the likelihood of the co-occurrence increases.
The PI3K inhibitors copanlisib, pictilisib and gedatolisib induce antiproliferative effects in somatic ERBB-family-mutant cell-line models
We divided cell lines into four groups depending on their ERBB family and PIK3CA mutational status. Group (A) ERBB family/PIK3CA wild type (WT), group (B) PIK3CA Mut/ERBB family WT, group (C) ERBB family Mut/PIK3CA WT and group (D) ERBB family/PIK3CA Mut. In-vitro analysis of the antiproliferative effects of the PI3K inhibitors copanlisib (61 cell lines) 84 , pictilisib (23 cell lines) 85 and gedatolisib (17 cell lines) 86 representing multiple cancer types identified that cells with a PIK3CA mutation were 6.45 fold more sensitive to copanlisib (n = 8, p = 0.046), 2.14 fold more sensitive to pictilisib (n = 4, p = 0.025) and 6.27 fold more sensitive to gedatolisib (not significant, n = 5) than those cell lines which were wild type for PIK3CA (Table 5). This result demonstrates the importance of PIK3CA mutations as a biomarker of response to PI3K inhibitors.

Mut, mutation; WT, wild type; IC50, half-maximal inhibitory concentration.
Interestingly, we also demonstrated that cell lines with only an ERBB family mutation are more sensitive to PI3K inhibition with copanlisib (p = 0.039) and gedatolisib (p = 0.002) relative to those cells which are WT for both PIK3CA and ERBB family genes (Figure 2). However, we also found cell lines with an ERBB family mutation (both ERBB family Mut and PIK3CA/ERBB family Mut cells) were 8.39 fold more sensitive to copanlisib (n = 22, p = 0.005), 2.86 fold more sensitive to pictilisib (n = 10, p = 3 × 10⁻⁴), and 6.33 fold more sensitive to gedatolisib (n = 5, p = 0.048) than cell lines which were ERBB family/PIK3CA WT (Table 6). There were no significant differences between the copanlisib and pictilisib half-maximal inhibitory concentration IC50s in cells with only an ERBB family mutation versus either only PIK3CA-mutated cells or cell lines with both an ERBB family and a PIK3CA mutation.

Comparison of IC50 values for copanlisib in green (n = 61), 84 pictilisib in blue (n = 23) 85 and gedatolisib in red (n = 17) 86 when assessed relative to the ERBB family or PIK3CA mutational status of each cell line. Displayed p values were calculated using Student’s t test and were deemed significant if p < 0.05. Mut, mutation; WT, wild type.

Mut, mutation; WT, wild type.
Cell lines which are ERBB family/PIK3CA mutant are sensitive to the combination of afatinib and copanlisib
We tested copanlisib alone and in combination with the pan-HER inhibitor afatinib in a panel of cell lines (Table 7). Combination index (CI) values were calculated and identified that cell lines which are ERBB family Mut/PIK3CA Mut are most sensitive to the combination of copanlisib and afatinib (Table 8; Figure 3). CI at effective dose (ED)75 demonstrates that cell lines which are ERBB family Mut/PIK3CA Mut are borderline significantly more likely to have a synergistic response to the combination of afatinib and copanlisib (p = 0.064). The combination of copanlisib and afatinib also has efficacy in SW620, LoVo and C2BBE1 cell lines. SW620 and LoVo cell lines are both KRAS mutant whilst C2BBE1 cells have an Mammalian target of rapamycin (mTOR) mutation. These specific mutations could account for the sensitivity of the cell line to the combination of drugs.
Mutational status of the panel of cell lines used for the in vitro assays in this manuscript representing the ERBB family and PIK3CA mutational status of the cell lines. We also included potential confounding mutations such as RAS, RAF and PTEN mutations, which may confound the effects of ERBB family or PIK3CA mutations.
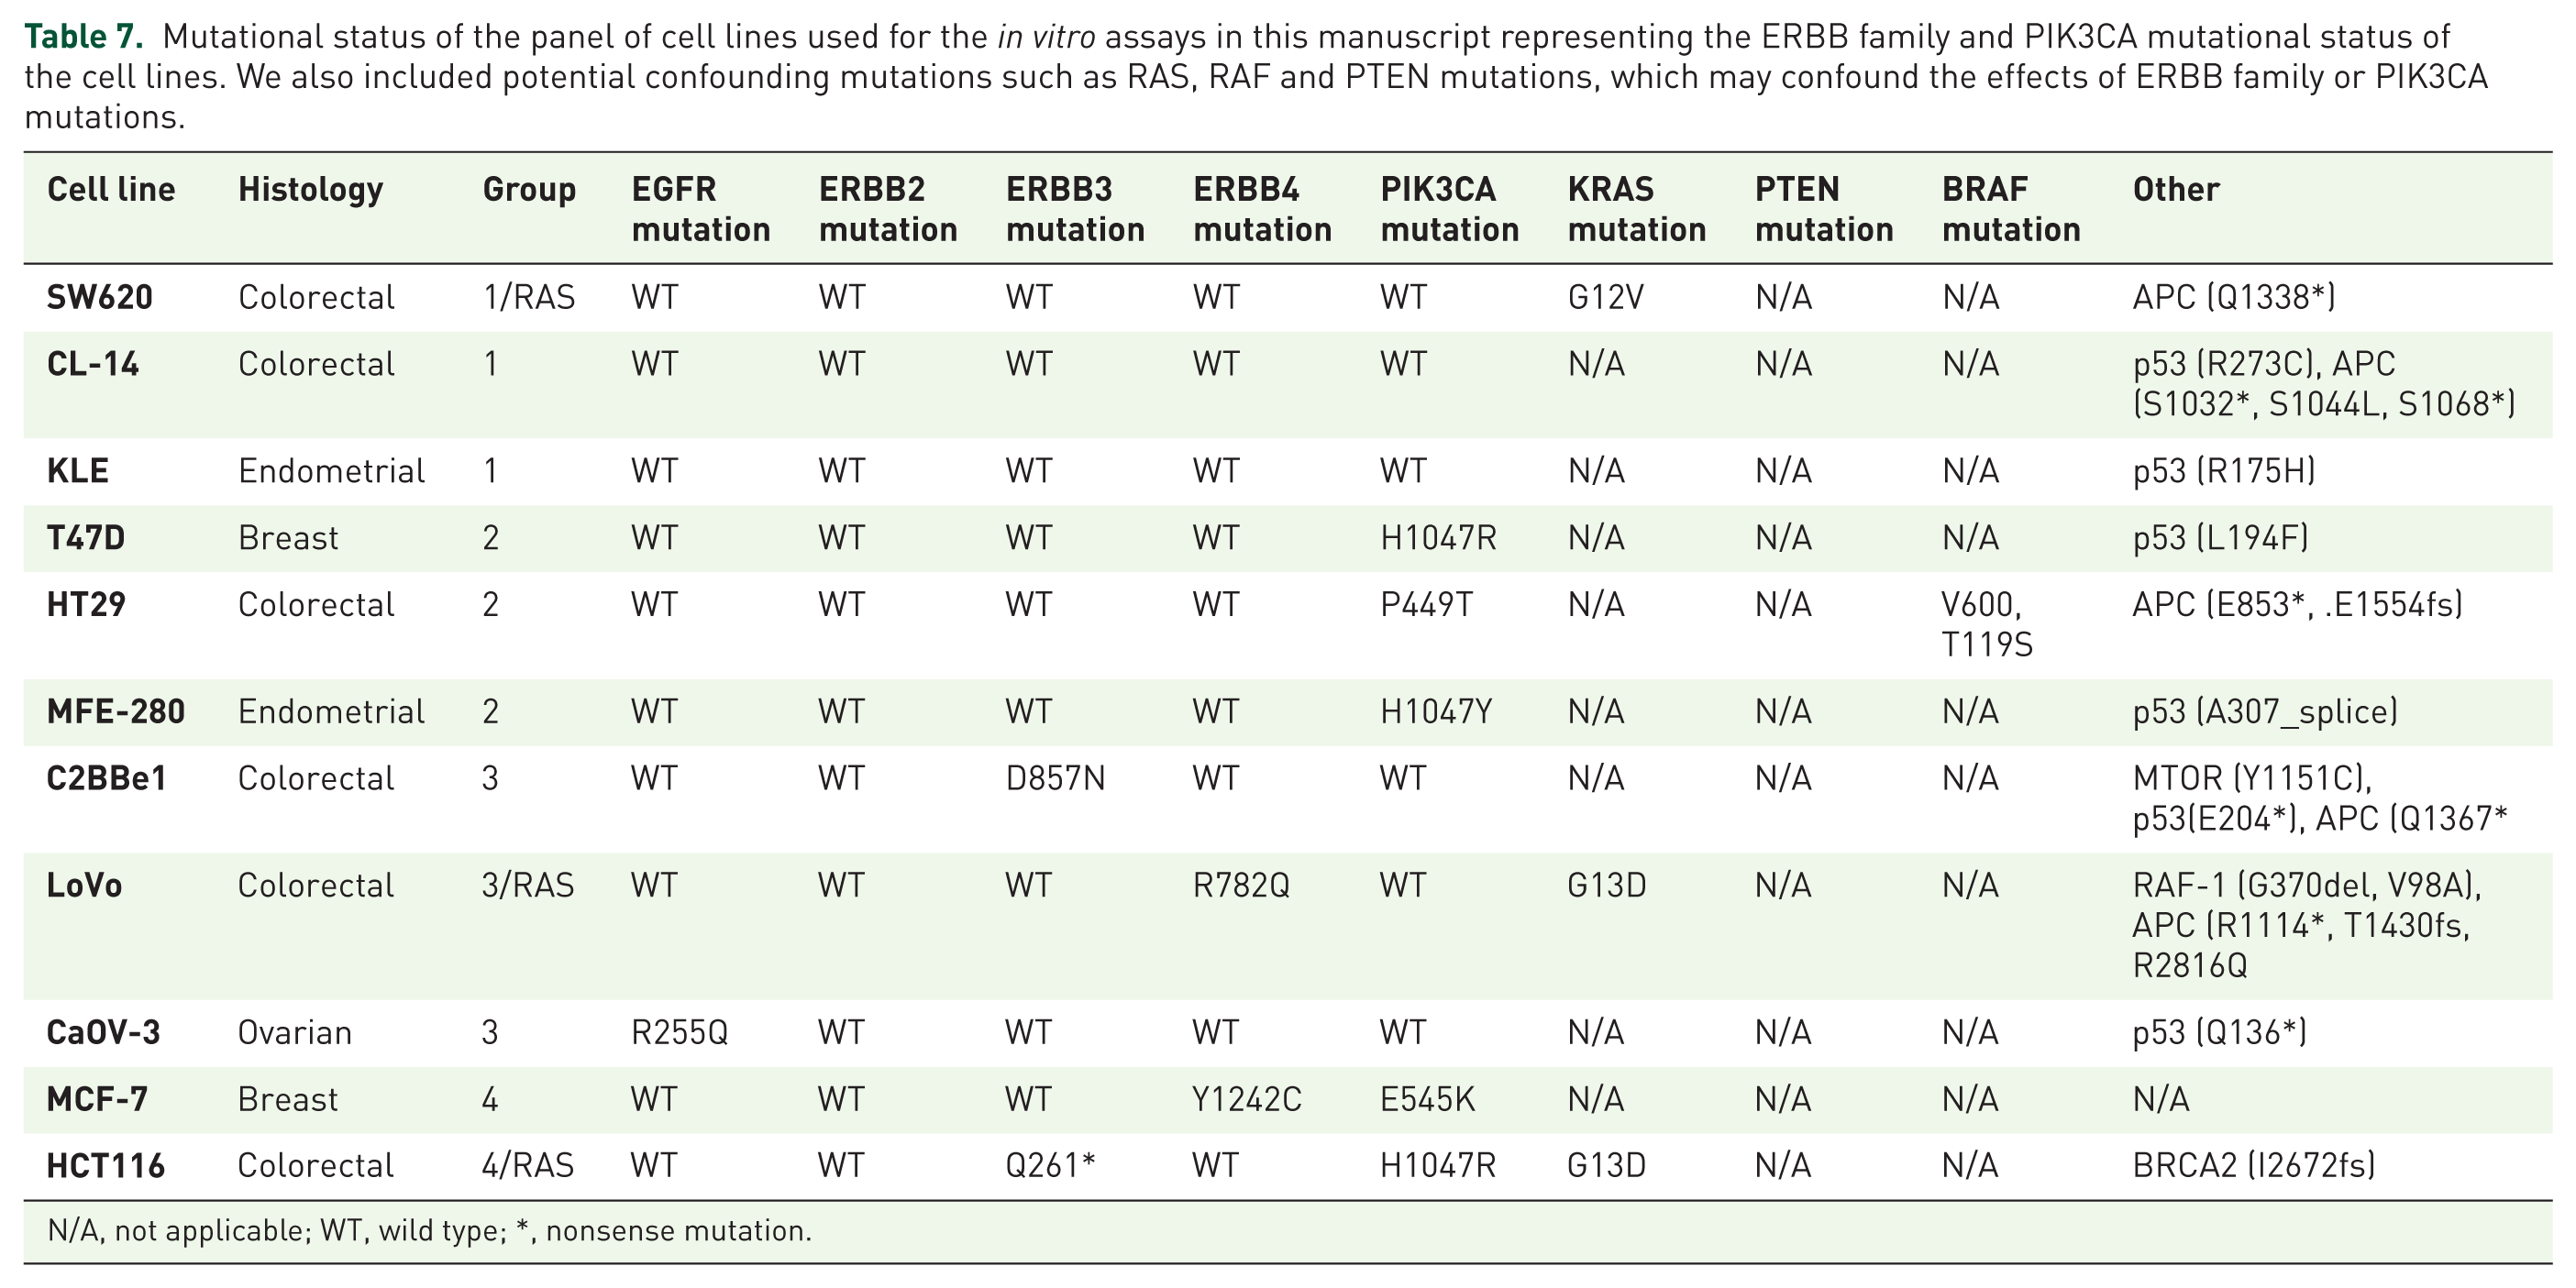
N/A, not applicable; WT, wild type; *, nonsense mutation.
Combination index values for cell lines tested with both copanlisib and afatinib. ED25, ED50, ED75 values are represented for each cell line. Standard deviations are representative of triplicate independent experiments.

CI, combination index; ED, effective dose; Mut, mutation; WT, wild type.

Efficacy of afatinib (blue), copanlisib (red) and a combination of afatinib and copanlisib (green) in a panel of cell lines which are (a) wild type (WT) for both PIK3CA and ERBB family genes, (b) PIK3CA Mut/ERBB family WT, (c) ERBB family Mut/PIK3CA WT and (d) ERBB family/PIK3CA Mut. Error bars are representative of standard deviations across triplicate experiments. The ratio of afatinib to copanlisib in this assay is fixed at either 16:1 or 4:1 depending on the cell line. ED, effective dose; Mut, mutation; WT, wild type.
Copanlisib and afatinib induce different proteomic responses in cell lines with different ERBB family/PIK3CA mutational status
We conducted a reverse phase protein array (RPPA) analysis of copanlisib and afatinib tested alone and in combination in four cell lines representing the different mutational groups. Antibodies selected were chosen to represent multiple nodes on the PI3K/AKT, MAPK/ERK and apoptotic signaling pathways. Drug concentrations and the duration of treatment were chosen to reflect an effective dose of drug which would inhibit effector signaling pathways but ensure that observed proteomic effects were specific to the drugs and were not compromised by an associated cell death signal.
Copanlisib as a single agent induces significant inhibition of AKT phosphorylation (S473) in all cell lines regardless of mutational status and p70 S6K (T389) phosphorylation in all cells except KLE (WT/WT). Copanlisib also effectively inhibits AKT (T308) signaling in all cell lines apart from the ERBB-family-mutant cell line C2BBE1 [Figure 4(a)]. Afatinib significantly inhibits AKT (S473) and AKT (T308) signaling in the KLE (WT/WT) and H1975 (Mut/Mut) cell lines, but not in the HT29 (PIK3CA Mut) or C2BBE1 (ERBB family Mut) cells [Figure 4(b)]. Additionally phosphorylation of p70SK6 (T389) is significantly reduced in KLE cells. Afatinib also induces a significant reduction in ERK (T202/Y204) phosphorylation in the KLE (WT/WT), H1975 (Mut/Mut) and C2BBe1 (ERBBs Mut) cell lines as well as decreases MEK1 (S217/221) phosphorylation in KLE (WT/WT) and H1975 (Mut/Mut) cell lines.

The impact of (a) copanlisib, (b) afatinib or (c) copanlisib and afatinib on expression and phosphorylation of proteins in the PI3K/AKT or MAPK/ERK signaling pathways relative to vehicle treated controls as measured by reverse phase protein array analysis. ‘•’ represents the ERBB/PIK3CA wild type (WT) cell line (KLE), ‘’ the PIK3CA mutation (Mut)/ERBB family WT cell line (HT29), ‘□’ the ERBB family Mut/PIK3CA WT cell line (C2BBE1) and ‘ ’ the ERBB family/PIK3CA Mut cell line (H1975). Error bars are representative of standard deviations across triplicate independent experiments. Fold changes of ⩾1.2 and with a p value of <0.05 as calculated by Student’s t test are classified as significant by the use of an asterisk of a similar color to the relevant cell line.
Treatment with the combination of afatinib and copanlisib significantly reduces the phosphorylation of AKT (S473, T308) and p70 S6K (T389) in all cell lines tested [Figure 4(c)]. Treatment with the combination of afatinib and copanlisib also significantly reduces MEK (S217/221) and MAPK (T202/Y204) phosphorylation in all cell lines apart from HT29 (PIK3CA Mut). Overall the combination of afatinib and copanlisib is an effective drug strategy to dually inhibit the phosphorylation of the key signaling PI3K/AKT and MAPK/ERK pathways.
Afatinib and copanlisib induce apoptosis in PIK3CA-mutant and ERBB family Mut/PIK3CA Mut cell lines
Copanlisib [125 nM (p = 0.02) and 250 nM (p = 0.037)] significantly increases levels of apoptosis in the HT29 cell line (PIK3CA Mut; Figure 5), however the combination of afatinib and copanlisib does not significantly increase apoptosis in HT29 compared with copanlisib alone. In H1975 cells (ERBB family/PIK3CA Mut) neither copanlisib nor afatinib alone induces a significantly greater level of apoptosis than the vehicle control, however the combination of copanlisib (120 nM) and afatinib (500 nM) does increase apoptosis (p = 0.037) relative to that achieved using either copanlisib or afatinib alone. In H1975 cells (ERBB family/PIK3CA Mut) the combination of copanlisib (120 nM) and afatinib (500 nM) was significantly more likely to increase apoptosis relative to the cell lines that are WT for both mutations (p = 0.006) or ERBB family mutant (p = 0.001) or PIK3CA mutant (p = 0.04). In support of this result we found in the RPPA data that treatment of H1975 cells (ERBB family/PIK3CA Mut) with the combination of afatinib and copanlisib significantly increases the expression of the pro-apoptotic family member BID (Figure 6), whilst there is a close to significant increase in BAK expression (p = 0.063) and a decrease in expression of the anti-apoptotic family member MCL-1 (p = 0.087). The combined evidence points towards the combination of afatinib and copanlisib producing a pro-apoptotic signal in H1975 cells, which is not observed in the remaining cell lines tested.

The impact of vehicle, copanlisib, afatinib or a combination of copanlisib (Cop, C) and afatinib (Afat, A) on apoptosis induction in (a) the ERBB/PIK3CA wild type (WT) cell line (KLE), (b) the PIK3CA mutation (Mut)/ERBB family WT cell line (HT29), (c) the ERBB family Mut/PIK3CA WT cell line (C2BBE1) and (d) the ERBB family/PIK3CA Mut cell line (H1975) as determined using fluorescence-activated cell sorting (FACS) analysis of propidium iodide/annexin V stained cells. Red bars represent apoptotic cells and green bars represent necrotic cells. Error bars are representative of standard deviations across triplicate independent experiments.
The impact of the combination of copanlisib and afatinib on expression and phosphorylation of proteins in the apoptotic signaling pathway relative to vehicle-treated controls as measured by reverse phase protein array analysis. ‘•’ represents the ERBB/PIK3CA wild type (WT) cell line (KLE), ‘’ the PIK3CA mutation (Mut)/ERBB family WT cell line (HT29), ‘□’ the ERBB-family Mut/PIK3CA WT cell line (C2BBE1) and ‘’ the ERBB family/PIK3CA Mut cell line (H1975). Error bars are representative of standard deviations across triplicate independent experiments. Changes of ⩾±20% and with a p value of <0.05 as calculated by Student’s t test are classified as significant.
Discussion
The ERBB network which includes the four receptors of the ERBB pathway EGFR, HER2, HER3 and HER4 function through dimerization to form a layered network which has been implicated in the development and treatment of cancer.87,88 ERBB family mutations have been shown in our studies and by others to be enriched in classically non-ERBB-family amplified cancers.6,89,90 However, we also found that ERBB family mutations co-occur with PIK3CA mutations in endometrial, colorectal, ovarian and stomach cancers. This therefore indicates that patients who have an ERBB family or PIK3CA mutation are significantly more likely to have an activated PI3K/AKT signaling pathway.
Copanlisib, gedatolisib and pictilisib are PI3K inhibitors which have shown preclinical activity in the treatment of many cancer types, especially those which are PIK3CA mutated.84,86 Copanlisib is being tested in patients with non-Hodgkin’s lymphoma and in phase II studies in solid tumors [ClinicalTrials.gov identifier: NCT02705859]. Gedatolisib and pictilisib are currently being tested in phase I studies in estrogen-positive breast cancer [ClinicalTrials.gov identifier: NCT02626507 and NCT02389842]. Reported studies have demonstrated good tolerability and efficacy of PI3K inhibitors in early phase clinical trials.91–94 In our study we wanted to test the antiproliferative impact of PI3K inhibition in a panel of cell lines that were selected based on their ERBB family and PIK3CA mutational status. The cell lines were also chosen to represent the solid tumors in which ERBB family and PIK3CA mutations are commonly found, such as colorectal, ovarian, endometrial and lung cancers. Interestingly, in vitro analysis of the antiproliferative impact of the PI3K inhibitors in multiple cell lines of differing histologies found that cells which harbored an ERBB family mutation were as sensitive to PI3K inhibition as those cell lines which are PIK3CA mutated. We therefore demonstrated that PI3K inhibitors could be effective for the treatment of patients who not only harbor PIK3CA mutations but also ERBB family mutations.
Afatinib, a pan-HER inhibitor, is currently undergoing phase I and II testing in several cancers, including, breast, glioblastoma and head and neck cancers. 95 Afatinib which has not been tested clinically in combination with PI3K inhibitors provides a rational approach for targeting cancers in which the PI3K pathway may be activated by ERBB family mutation. In fact when we combined afatinib and copanlisib together we found that cell lines which harbored both an ERBB family mutation and a PIK3CA mutation had the greatest antiproliferative response to the combination treatment. We also demonstrated that two-thirds of cell lines that are ERBB family mutant, but were WT for PIK3CA, had synergistic inhibition of proliferation to the combination of afatinib and copanlisib. Moreover it is important to note that copanlisib alone as well as in combination with afatinib showed good effectiveness in KRAS-mutated SW620 cells (ERBB family/PIK3CA WT), underlining the potentially beneficial effects of this combination in the treatment of cancers with upregulated PI3K or MAPK signaling. 94
We selected four cell lines representing the different mutational groups for further functional analysis of the proteomic and apoptotic impact of combining afatinib and copanlisib in vitro. These cell lines were selected as they demonstrated the most profound response to the combination therapy. They all represented cell lines which were RAS mutation negative, so as to avoid the impact of activated RAS signaling which may provide confounding effects on PI3K/AKT signaling.
We demonstrated by apoptosis assays and proteomic studies that the antiproliferative effect can be associated with the ability of copanlisib and afatinib to effectively inhibit both PI3K/AKT and MAPK/ERK signaling in H1975 cells (ERBB family/PIK3CA Mut). We confirmed that dual inhibition of PI3K and MAPK signaling pathways in H1975 cells (ERBB family/PIK3CA Mut) induced a proapoptotic proteomic signal. We confirmed using FACS analysis that treatment of H1975 cells with the combination of copanlisib and afatinib resulted in a significant increase in apoptosis, which was not observed in the other cell lines. This is an interesting observation as despite ERBB-family-mutant cell lines being sensitive to the combination of afatinib and copanlisib, it was only in the ERBB family/PIK3CA mutant cell lines that the combination produced a proapoptotic impact, likely indicating that the combination was cytostatic and not cytotoxic in cell lines which harbor an ERBB family mutation only.
The combination of afatinib and copanlisib may be an effective treatment strategy for patient tumors which have both an ERBB family and PIK3CA mutation. A limitation of this targeted combinatorial approach may be the underlying heterogeneity of the tumors, when cancers with low ERBB family/PIK3CA gene mutational frequency may be less responsive to the combination. We believe that fully translational clinical studies are required to determine how much of an issue this will be in treating these patients. These studies can be used to interrogate and ascertain modes of acquired and innate resistance in these cancer types. However, our study clearly highlights the ability to identify and stratify patients based on the presence of ERBB family mutations, with patients whose tumors cofeature PIK3CA mutations the most likely to gain robust antitumor responses. These findings support the initiation of a clinical trial testing PI3K inhibitors in ERBB-mutant/PIK3CA-mutant cancers.
Materials and methods
ERBB family mutational data analysis
All data mining was performed using cBioPortal and data analysis was performed on TCGA datasets in July 2016. The full list of datasets analyzed for this study is available in Table 1. The results used herein are in part based upon data generated by the TCGA Research Network: http://cancergenome.nih.gov/ and from www.cbioportal.org.8,96 The data analyzed include mutational data from 14,539 different cancer samples in 31 cancer types. All searches including co-occurrence analysis were performed according to the cBioPortal’s online instructions. Ethics approval and informed consent were not required for this study as the data were already in the public domain.
Cell culture
CaOV3, MCF7, T47D, H1975, KLE, MFE280 and HCT116 cell lines were acquired from the Royal College of Surgeons in Ireland whilst T47D were acquired from Dublin City University. Cell lines were grown in RPMI-1640 media (Sigma-Aldrich, Merck KGaA Darmstadt Germany, USA), except HT29, SW620, LoVo, CL-14 and C2BBE1 cells which were grown in DMEM Hams F12 media. Cell lines were supplemented with 10% FCS and 1% penicillin/streptomycin and maintained at 37°C with 5% CO2. Cell line identity was confirmed by DNA fingerprinting (Source Biosciences, United Kingdom). Cell lines were Mycoplasma tested before and after the in vitro experiments. The mutational status of cell lines used in this study was taken from the CCLE which are publicly available from Broad Institute. BAY80-6946 (Copanlisib) a PI3K inhibitor (PI3Ki) was obtained under MTA from Bayer Pharmaceuticals (Germany) and 10 mM stocks were prepared in dimethyl sulfoxide (DMSO) and 5% triflouroacetic acid. Afatinib was acquired from Sequoia Chemicals (United Kingdom) and 10 mM stocks were prepared in DMSO.
Proliferation assays
For all cell lines no P/S was added to media during proliferation assays. 1 × 10³ cells/well were seeded in 96-well plates, apart from HCT116 which was seeded at 2 × 10² cells/well, C2BBE1 which was seeded at 2 × 10³ cells/well, H1975 which was seeded at 5 × 10² cells/well and CL-14 and MFE280 which were seeded at 5 × 10³ cells/well. Plates were incubated overnight at 37°C to allow cells to adhere. Drugs were added to the plates at specific concentrations and incubated at 37°C. Copanlisib and afatinib were combined at a ratio of 1:4 in all cell lines apart from T47D, KLE and MFE280 which were combined at a ratio of 1:16. Following 5-day incubation, during which control cells attained 80–90% confluence, all media was removed from the plates, and washed twice with phosphate-buffered saline (PBS). Proliferation was measured using the acid phosphatase assay as previously described. 97 A minimum of triplicate biological assays were carried out for each experiment.
Signaling experiments and protein extraction from cell lines
1 × 10⁵ cells were seeded into six-well plates, where serum-free medium was added to the wells and incubated overnight to synchronize the cells. Cells were then treated with the relevant drug and concentration KLE [WT/WT (group A), afat 125 nM, cop 8 nM or afat:cop 125:8 nM], H1975 [WT/Mut (group B), afat 30 nM, cop 8 nM or afat:cop 30:8 nM], C2BBE1 [Mut/WT (group C) afat 250 nM, cop 62.5 nM, afat:cop 250:62.5 nM], HT29 [Mut/Mut (group D) afat 125 nM, cop 30 nM or afat:cop 125:30 nM] or a similar concentration of DMSO/DMSO-TFA (vehicle control) in 5% FCS for 30 min. To extract protein all media was removed and cells were washed twice with PBS. 60–100 μl lysis buffer [50 mM HEPES pH 7.4, 1% Triton X-100, 150 mM NaCl, 1.5 mM MgCl2, 1 mM EGTA, 10% glycerol, 100 mM NaF, 10 mM Na pyrophosphate, 1 mM Na3VO4, PhosSTOP phosphatase inhibitor cocktail (1X) (Roche Applied Science, Germany), cOmplete Mini EDTA-free protease inhibitor cocktail (1X) (Roche Applied Science, Germany)] was added to the plate and cells scraped, with lysates transferred to microcentrifuge tubes and vortexed for 10 s before being centrifuged at 14,000 rpm for 10 min at 4°C. Protein was quantified by the Bradford Assay (Bio-Rad Laboratories, USA) and stored at −80°C.
Reverse phase protein array analysis
RPPA analysis of the in vitro data was performed as previously described by us.98,99 RPPA analysis was carried out using triplicate biological replicates, and the data were normalized by protein loading using the entire antibody panel. The full list of antibody endpoints used in the RPPA experiments, including the company from which it was purchased and the relevant catalogue number, host species and dilution at which it was used, is given in Table 9.
The full list of antibodies used in the RPPA assay.

AKT, protein kinase B; AMPK, 5’ AMP-activated protein kinase; c-RAF, c-Raf proto oncogene serine/threonine protein kinase; EGFR, epidermal growth factor receptor; HER2, human epidermal growth factor receptor 2; HER3, human epidermal growth factor receptor 3; IGFIR-B, insulin-like growth factor I receptor β; MAPK, mitogen-activated protein kinase; MEK1, mitogen-activated protein kinase kinase; mTOR, mammalian target of rapamycin; p70 S6 kinase, ribosomal protein S6 kinase beta-1.
CellSig, Cell Signalling Technology Netherlands; Millipore, Merck Millipore USA; Lab Vision, Thermo Fisher Scientific USA; Upstate, Merck Millipore USA; Santa Cruz, Santa Cruz Biotechnology USA; Epitomics, An Abcam Company USA.
Apoptosis assay
Cells were plated in 24-well plates (5 × 10⁴ H1975 and HT29 cells; 2 × 10⁵ KLE and C2BBE1 cells) and incubated at 37°C with 5% CO2. Cells were serum starved overnight prior to experiments. Cells were treated for 72 h with vehicle or drug at the following concentrations, used both alone and in combination (H1975: afatinib 250 nM, copanlisib 60 nM; HT29: afatinib 500 nM, copanlisib 125 nM; KLE: afatinib 500 nM, copanlisib 35 nM; C2BBE1: afatinib 500 nM, copanlisib 125 nM). Drug concentrations represent cell-line specific IC70 values determined from a 5-day proliferation assay. Staurosporine was used as a positive control (data not shown). After 72 h, cells were trypsinized, harvested by centrifugation (2500 rcf for 3 min) and washed with sterile PBS. This process was repeated twice. Cells were stained for annexin V and propidium iodide as per the manufacturer’s instructions (BD Biosciences, USA). Appropriate compensation controls were used and cells were analyzed on a FACS Calibur (Becton Dickinson, USA) flow cytometer. Cell Quest software (BD Biosciences, USA) was used for gating analysis.
Calculation for fold change in protein expression phosphorylation
The formula to calculate fold change is calculated according to the error of propagation:

The formula to calculate the standard deviation according to the error of propagation is:

(http://ipl.physics.harvard.edu/wp-uploads/2013/03/PS3_Error_Propagation_sp13.pdf).
Statistical analysis
IC50 and CI values at ED75 were calculated using CalcuSyn software (BioSoft, United Kingdom). A CI value of less than 0.9 is considered synergistic, 0.9–1.1 is considered additive and over 1.1 is considered antagonistic. 100 Student’s t test was used to evaluate and compare the effects of afatinib and copanlisib tested alone and in combination on protein expression and phosphorylation in our RPPA data. A Wilcoxon rank sum test was used to compare the CI at ED75 values between the different cell line groups. p less than 0.05 was considered statistically significant.
Footnotes
Acknowledgements
We would like to thank Scott Wilhelm and Bayer pharmaceuticals for the use of copanlisib. We would also like to acknowledge Dr Denis Collins, Dr Heiko Duessmann and Dr Jean McBryan for the donation of cell lines towards this study. BH and AE are joint senior authors. MM and AE designed and conducted experiments as well as performed data analysis and manuscript preparation; MC and CM conducted RPPA experiments and associated data analysis; AC participated in proliferation experiments preparation; SFM performed statistical analysis; AE and BH supervised project design and execution; JOS assisted with the genetic classification of the cell lines used to compare the IC50 values of PI3Kis; ST, AE and BH edited the manuscript and approved its final version; AH and SH performed the FACS apoptosis analysis. All authors read and approved the final manuscript.
Funding
The author(s) disclosed receipt of the following financial support for the research, authorship, and/or publication of this article: This work was supported by Bayer HealthCare, the Irish Cancer Society Collaborative Cancer Research Centre, BREAST-PREDICT Grant, CCRC13GAL (![]() ), Breast Cancer Now Catalyst grant and NECRET, the North Eastern Cancer Research and Education Trust. SV and AH were supported by Science Foundation Ireland (award 13/IA/1994 to AH).
), Breast Cancer Now Catalyst grant and NECRET, the North Eastern Cancer Research and Education Trust. SV and AH were supported by Science Foundation Ireland (award 13/IA/1994 to AH).
Conflict of interest statement
Bayer Healthcare provided research funding to support this study and they also provided access to copanlisib under an MTA.