
Abstract
Background
This study aimed to synthesize the applications, performance, and methodological conduct of artificial intelligence (AI) prediction models for total shoulder arthroplasty (TSA) outcomes.
Methods
PUBMED, MEDLINE, EMBASE, and CENTRAL were searched on November 2, 2025 for all articles that utilized AI to develop prognostic or diagnostic prediction models utilizing TSA populations. Methodological quality was assessed using the TRIPOD statement and PROBAST tool.
Results
Twenty-four studies comprising outcomes of 497,365 patients (35.6% female; 69.6 ± 0.9 years) were included. Of these patients, 31.0% underwent rTSA, 29.1% aTSA, and 2.8% hemiarthroplasty. The remaining patients received a mix of aTSA and rTSA, but the exact proportions were not reported in their respective studies. Nine studies applied AI to clinical outcomes (AUC 0.85, 0.65–0.96), seven to adverse events (AUC 0.73, 0.52–0.92), and six to resource utilization (AUC 0.78, 0.59–0.91). All twelve studies comparing AI to traditional regression reported that AI models demonstrated superior performance. The need and caution for external validation was reported in 15 studies (62.5%). The mean TRIPOD adherence was 11.6 items (range 9–15); 19 studies (82.3%) met >50% of criteria, and 6 (26.1%) met >66%. PROBAST rated 16 studies (66.7%) at high risk of bias.
Conclusion
AI prediction models in TSA show poor methodology, especially in calibration, sample size, missing data, and validation, warranting cautious interpretation and clearer direction for future research.
Keywords
Introduction
The utilization of artificial intelligence (AI) to develop both prognostic and diagnostic prediction models has continued to expand across several medical and surgical disciplines, including orthopaedic surgery.1–3 Literature concerning patient populations that have undergone total shoulder arthroplasties (TSA) have also been of interest as it pertains to applying this statistical methodology,4–10 though this body of literature has evolved more slowly. However, rapidly growing interest in developing prognostic and diagnostic prediction models because of “hype” can lead to a substantial increase in the number of available models that fail to be implemented into clinical practice due to incomplete reporting, methodological limitations, and model bias.
A previous systematic review of AI models developed on total joint arthroplasty (TJA) datasets reported that AI models were broadly utilized in four domains (clinical outcomes and resource utilization, imaging detection, patient movement and activity surveillance, and language interpretation). 11 However, despite the several promising applications of these prediction models, the methodological quality and reporting transparency of most studies were inadequate and failed to pursue external validation, which is imperative as healthcare institutions and device manufacturers begin to adopt such technology into clinical workflows and real-world patient care. 11 A common lack of implementation into clinical practice and subsequently patient benefit is incomplete reporting and failure to follow such methodological recommendations, which leads to models developed on inappropriately small sample sizes, miscalibration, and failure to be externally validated. Therefore, it is essential to critically appraise studies concerning TSA given the potential clinical applicability that such algorithms will impose on everyday clinical practice and potential for methodological misconduct.
A contemporary synthesis of the efficacy and methodological conduct of clinical prediction models utilizing machine learning methods in TSA is lacking, which is critical for determining whether this evolving compilation of prediction models is methodologically valid and clinically useful or contribute to wasted research efforts. Given this importance, the primary aim of the current study was to provide a comprehensive synthesis of the current applications, performance, and methodological conduct of contemporary AI prediction models for TSA outcomes. It was hypothesized that studies evaluating AI models in the context of TSA would demonstrate good to excellent performance in clinical prediction tasks but demonstrate concerning methodological conduct and possess a high risk of bias.
Methods
Article identification
Four online databases (PUBMED, MEDLINE, EMBASE, and Cochrane Central Register of Controlled Trials) were queried for literature that developed clinical prognostic and diagnostic prediction models utilizing machine learning methodology from data inception to November 2, 2025. The search terms included, “artificial intelligence”, “machine learning”, “shoulder arthroplasty”, and similar phrases (
Article selection process
A systematic screening approach in accordance with the 2020 Preferred Reporting Items for Systematic Reviews and Meta-Analyses (PRISMA) statement was conducted by two independent reviewers (_____) from title to full-text screening stages. 12 Discrepancies at the title/abstract screening stage were resolved by automatic inclusion. Discrepancies at the full-text screening stage were resolved by input from a third reviewer (___). The references from the included studies were also screened using the same approach to ensure that relevant articles were not missed.
Methodological conduct assessment
The TRIPOD (Transparent Reporting of a Multivariable Prediction Model for Individual Prognosis or Diagnosis) guidelines and the Guidelines for Developing and Reporting Machine Learning Models in Biomedical Research represent a consensus list of 22 items which best practices for reporting and designing machine learning prediction studies.13,14 These guidelines are used to assess studies that focus on developing, evaluating, or both developing and evaluating diagnostic or prognostic prediction models. 15 These guidelines were chosen as they represent a widely accepted benchmark for appropriate prediction model development and have been utilized extensively among other reviews concerning methodological conduct of prediction models.16–19 A modified version which only contains key items of the TRIPOD guidelines were used to evaluate the quality of included studies in accordance with prior literature. 11 The risk of bias and applicability of predictive models were evaluated using the Prediction model Risk of Bias Assessment Tool (PROBAST), which is also commonly utilized in reviews concerning methodological conduct.20,21 PROBAST assesses four domains via 20 signaling questions: participants, predictors, outcomes, and analysis. 20 The overall risk of bias and applicability of predictive models are rated as “low”, “high” or “unclear” concern according to the PROBAST checklist.20,21
Data extraction and statistical analysis
Two reviewers independently abstracted data of interest from included studies into a spreadsheet Microsoft Excel (Version 2016; Microsoft, Redmon, Washington), designed a priori. Demographic data included author, year of publication, sample size, location, and patient demographics. Data pertaining to primary and secondary outcome of interest, AI model development and testing, model performance, model validation, comparison with conventional statistical methods and whether studies were externally validated or cautioned that there was requirement of external validation, was noted.
To assess model performance across included studies, metrics such as discrimination, calibration, Brier score and decision-curve analysis were recorded when possible. Discrimination, represented through the area under the receiver operating curve (AUC), ranges from 0.5 to 1. 22 A model with an AUC of 1.0 was considered a perfect discriminator, 0.90–0.99 was considered excellent, 0.80–0.89 was good, 0.70–0.79 was fair, and 0.51–0.69 was considered poor. 23 Calibration slope describes the degree to which model predictions match the observed outcomes, whereas calibration intercept quantifies by how much the predictions differ from the outcomes.24,25 A combination of values for slope and intercept represents different levels of calibration: a slope of 1 and intercept of 0 represent perfect calibration. Calibration slopes that are >1 or <1 indicate that predictions are too extreme and too moderate, respectively, while negative and positive calibration intercepts indicate overestimation and underestimation of predictions, respectively.24,25 Brier scores, ranging from 0 to 1, combines discrimination and calibration to provide estimates on the accuracy of the prediction models, where a score 0 represents perfect accuracy. 26
Due to the high statistical and methodological heterogeneity amongst included studies, a meta-analysis could not be performed. Thus, the data is presented descriptively. Descriptive statistics including counts, proportions, means, medians, ranges, and measures of variance (e.g., standard deviations [SD], 95% confidence intervals [CI]) are presented where applicable as a range of all values reported within the
Results
Patient and study characteristics
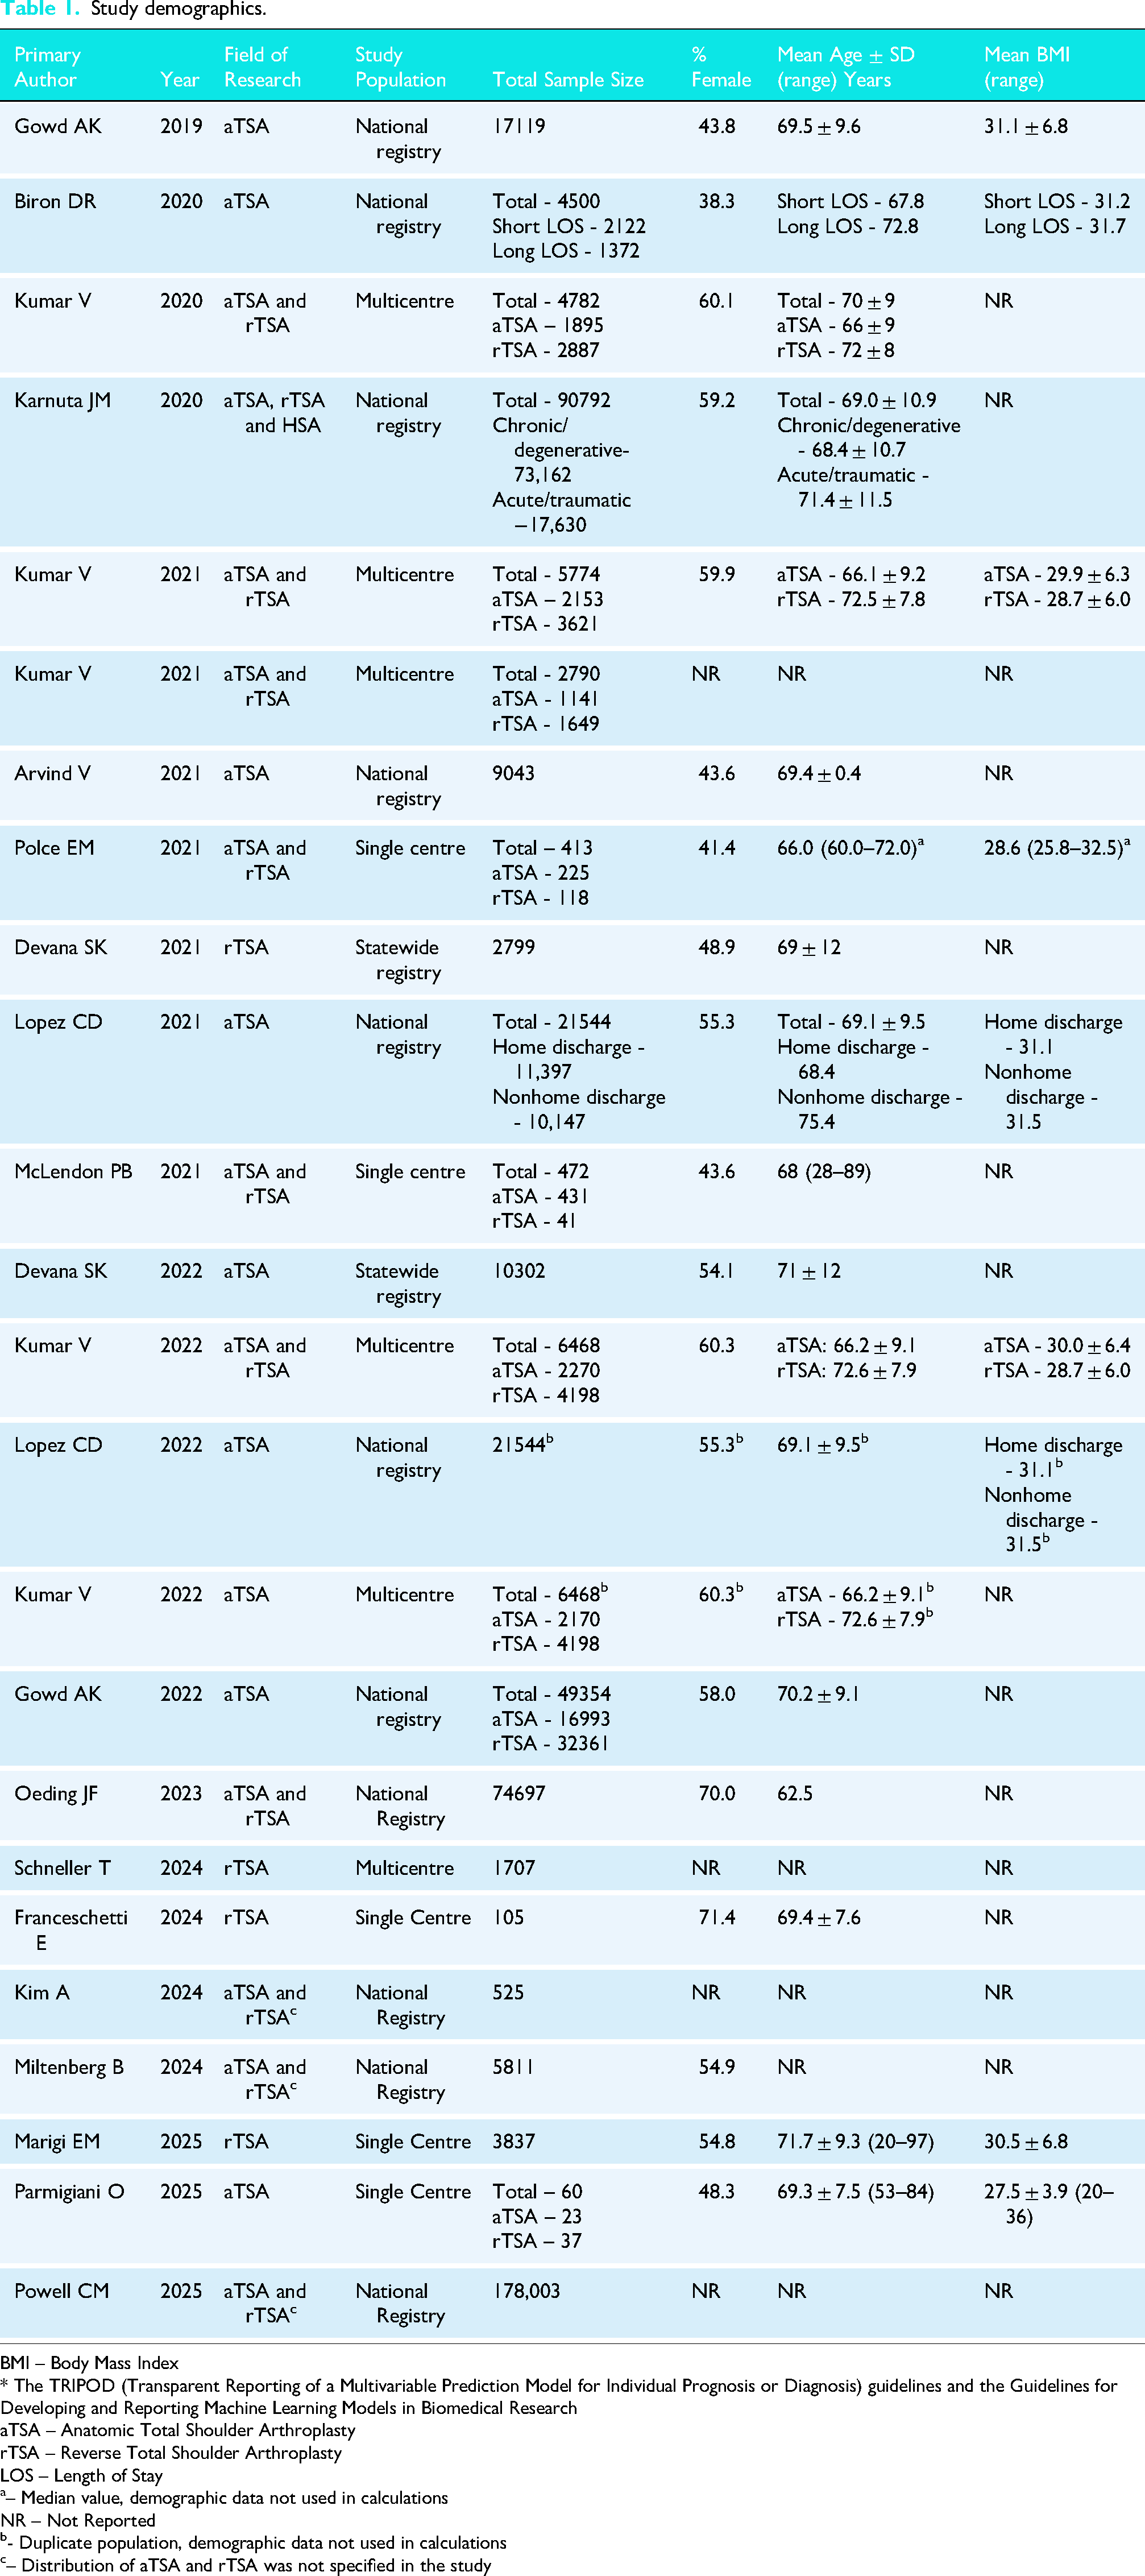
The initial search yielded, 2115 studies, of which a total of 24 were included in the final analysis (Figure 1). The studies included 497,365 patients (35.6% female) with a mean age of 69.6 ± 0.9 years and mean BMI of 30.7 ± 1.5 kg/m2. The median sample size was 5774 (range: 60 to 178,003). Patients were treated with either rTSA (31.0%; n = 154,374), aTSA (29.1%; n = 144,920) or hemiarthroplasty (2.8%; n = 13,732; three studies did not specify the proportion between aTSA and rTSA (37.1%; 184,339)27–29 (
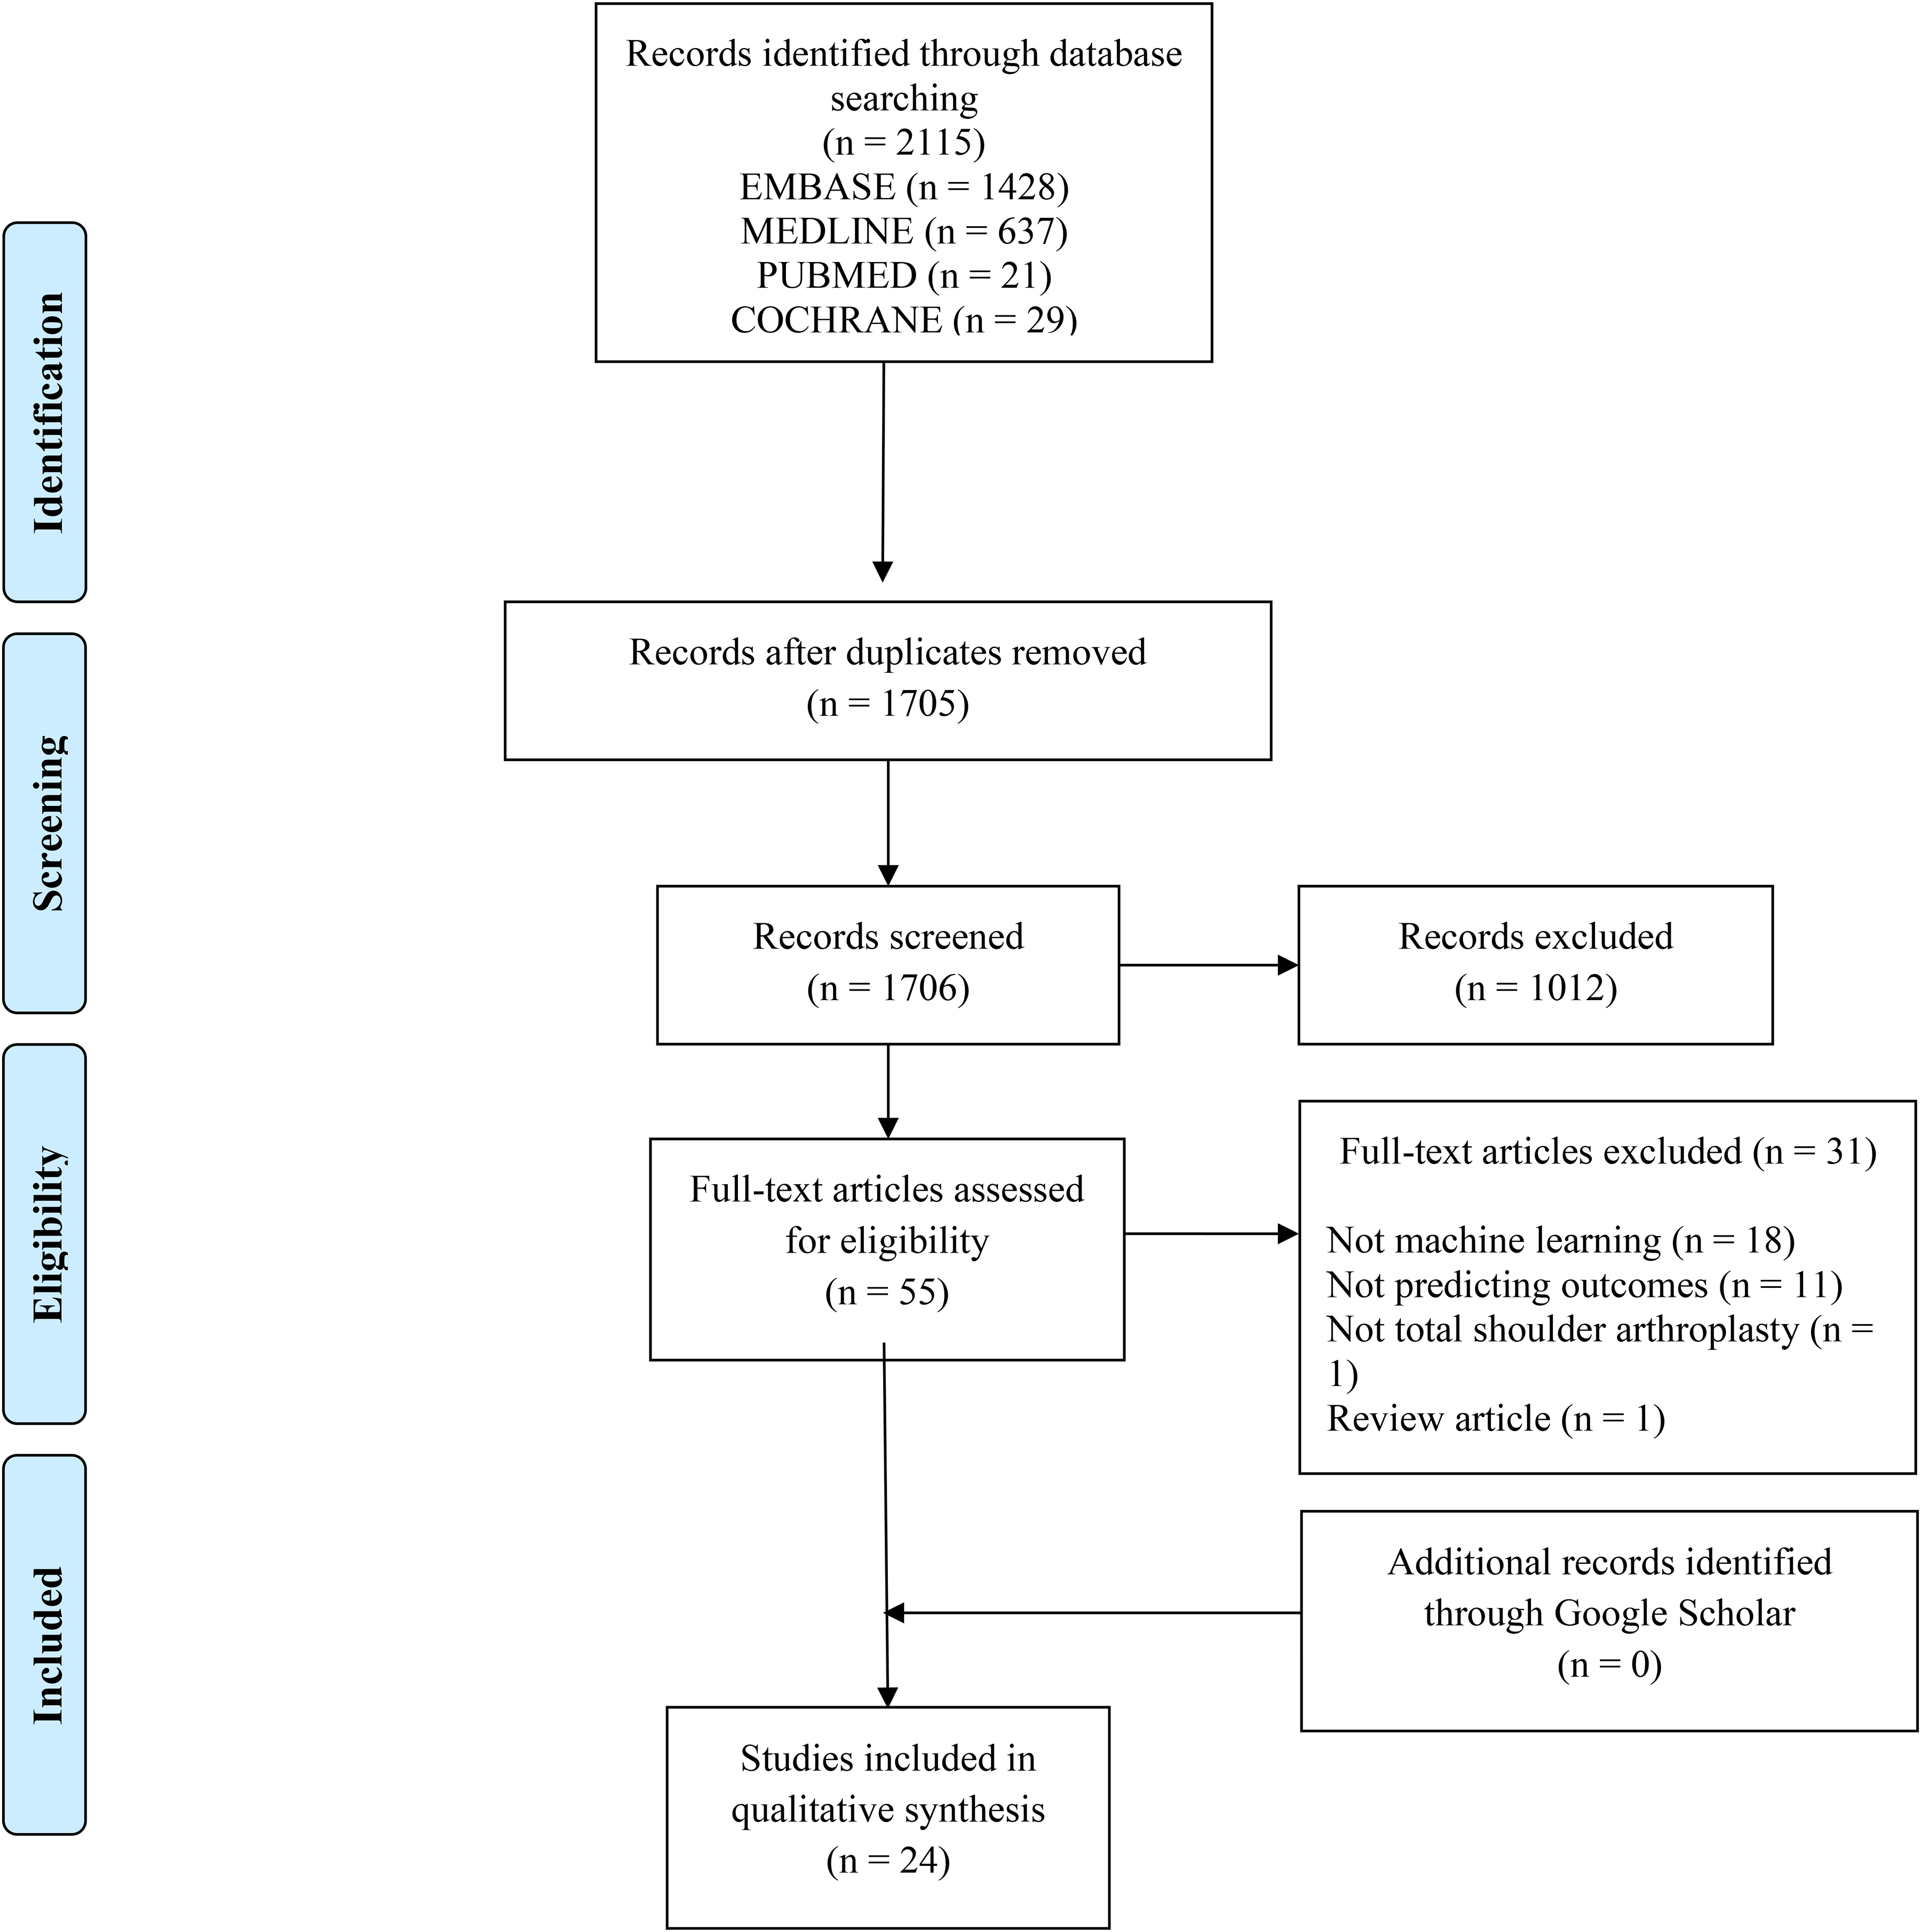
Preferred reporting items for systematic reviews and meta-analyses (PRISMA) flow diagram demonstrating the systematic review of the literature for the use of machine learning algorithms to predict outcomes, complications, and resource utilization after total shoulder arthroplasty.
Study demographics.
BMI – Body Mass Index
* The TRIPOD (Transparent Reporting of a Multivariable Prediction Model for Individual Prognosis or Diagnosis) guidelines and the Guidelines for Developing and Reporting Machine Learning Models in Biomedical Research
aTSA – Anatomic Total Shoulder Arthroplasty
rTSA – Reverse Total Shoulder Arthroplasty
LOS – Length of Stay
– Median value, demographic data not used in calculations
NR – Not Reported
- Duplicate population, demographic data not used in calculations
– Distribution of aTSA and rTSA was not specified in the study
Methodological conduct assessment using TRIPOD guidelines
TRIPOD grading for each individual study is given in
Methodological conduct assessment using PROBAST
As depicted in Figure 2, most studies (n = 16; 66.7%) demonstrated a high risk of bias,5–8,10,29–32,35–38,41–43 whereas the remaining had an unclear risk of bias (n = 4; 25%)4,9,33,34 and low risk of bias (n = 4; 25%).27,28,39,40 The elevated risk of bias was predominately from the analysis domain, in which there was a lack of complete reporting as to how continuous and categorical predictors, complexities in the data, and model overfitting and optimism in model performance were handled. Low risk of bias was identified in the participants domain in 80.3% of studies, predictors domain for only 50% of studies, and outcomes domain for less than half (45.8%) of studies. The concern of applicability for most models were low (n = 16 studies; 66.7%) since the included participants and settings; definition, timing or assessment of predictors; and the outcome definition, timing or determination of these studies match the review question (Figure 2).4–6,9,10,27,28,30,32,33,35,37–40,42,43 The complete PROBAST assessment for each individual study is given in
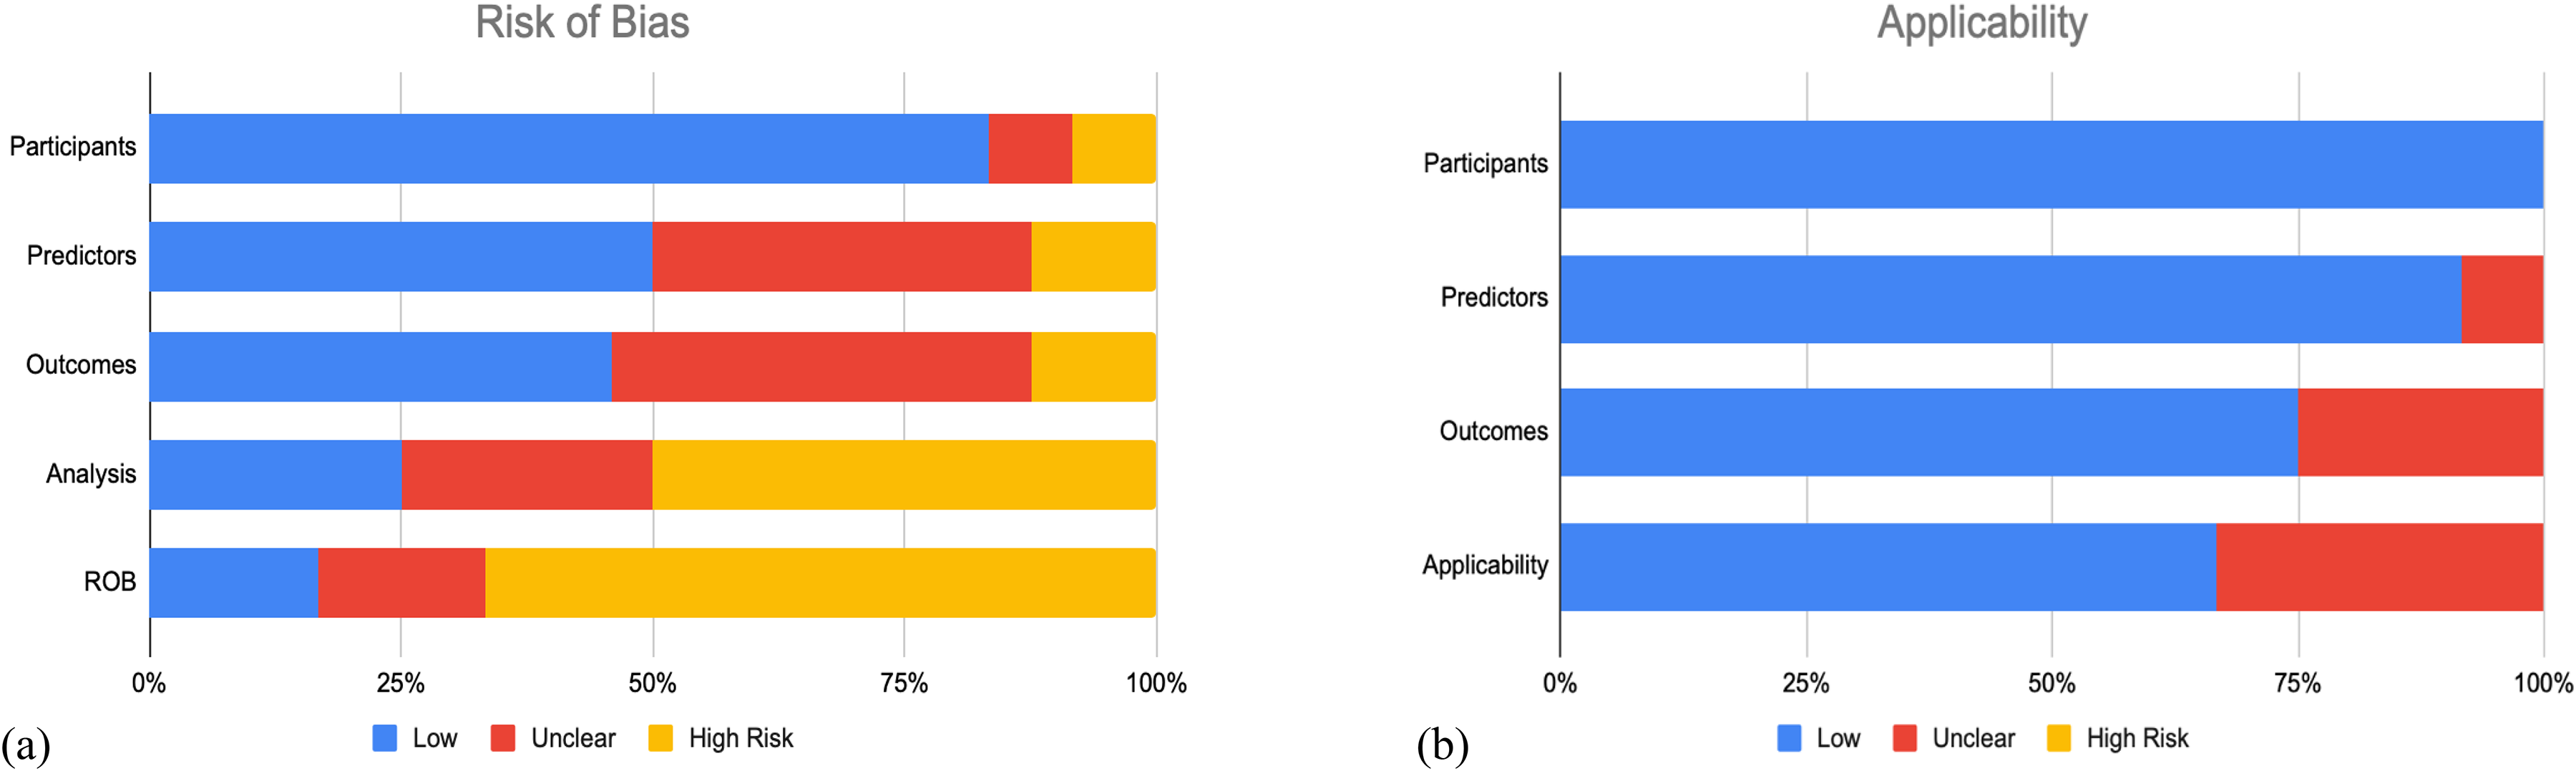
Summary of prediction model risk of bias assessment tool (PROBAST) assessment for included studies. (a) The risk of bias of the included studies. (b) The applicability of the included studies.
Efficacy and applications: clinical outcomes
Clinical outcomes investigated among identified studies (n = 9)5–10,35,41,42 included patient reported outcomes measures (PROMs) (n = 5 studies; 55.6%),5–8,35 range of motion (n = 2 study; 22.2%),10,42 and patient satisfaction (n = 1 study; 11.1%).
9
Six studies (66.7%) reported the AUC (median [range]: 0.80 [0.52 to 0.96]),5,6,9,10,35,41 six studies (66.7%) reported sensitivity (median [range]: 93% [57% to 99%]),5,6,8,10,35,41 five studies (55.6%) reported accuracy (median [range]: 88.5% [63% to 97%]),5,6,10,35,41 and five studies (55.6%) reported positive predictive value (PPV) (median [range]: 87.3% [55% to 97%]).5,6,10,35,41 Calibration slope (2.32) and intercept (0.20) as well as Brier Score (0.11) was only reported in one study (11.1%), in which support vector machine (SVM) was the best performing AI model.
9
The best performing model among six studies that compared multiple AI models was Wide and Deep (n = 3 studies; 75%),5,10,35 SVM/SVR (n = 2 studies; 22.2%),9,42 and ANN (n = 1 study, 11.1%).
41
Outcomes were primarily continuous necessitating regression-based models (n = 8 studies; 88.9%)5–8,10,35,41,42 as opposed to categorical requiring classification-based models (n = 1 study; 11.%) (Table 2).
9
The median number of features used during model training was 34 (range: 13 to 291), with all studies (n = 9) using demographic based features. 5–10,35,41,42With regards to internal validation, two studies (22.2%) used three to five iterations of cross validation (CV) on a training set9,42; while one study (11.1%) did not use any validation method as all data sets were used to train the AI models.
8
The remaining six studies (66.7%) developed the AI algorithms by splitting the data into training and validation sets.5–7,10,35,41 Out of the studies (n = 4; 44.4%) that compared AI to traditional regression, all studies reported that AI models demonstrated superior performance (Table 3
Efficacy and applications: resource utilization
Resource utilization measures evaluated across a total of 8 studies,4,28,29,32,34,36,37,43 included length of stay (n = 4 studies; 50%),4,29,37,43 discharge disposition/nonhome discharge (n = 3 studies; 37.5%),28,32,43 cost of care (n = 2 studies; 25.0%)36,43 and operative time (n = 1 study; 12.5%). 34 All studies reported AUC (median [range]: 0.77 [0.59 to 0.91],4,28,29,32,34,36,37,43 five studies (62.5%) reported accuracy (median [range]: 89.9% [75.2% to 95.5%])4,29,32,34,43 and two studies (25.0%) reported positive predictive value (32–61.4%). 4 No studies reported model calibration, Brier score, or decision curve analysis (Table 4). The median number of features used during model training was 21 (range: 12 to 52), with all studies using demographic input features (n = 8 studies).4,28,29,32,34,36,37,43 AI algorithms were developed by splitting data into training and test sets for all studies (n = 8 studies; 100%).4,28,29,32,34,36,37,43 Out of the studies (n = 5; 62.5%) that compared AI to traditional regression, all reported that AI models demonstrated superior performance (Table 3).4,28,29,34,36
AI performance in tasks pertaining to clinical outcomes.
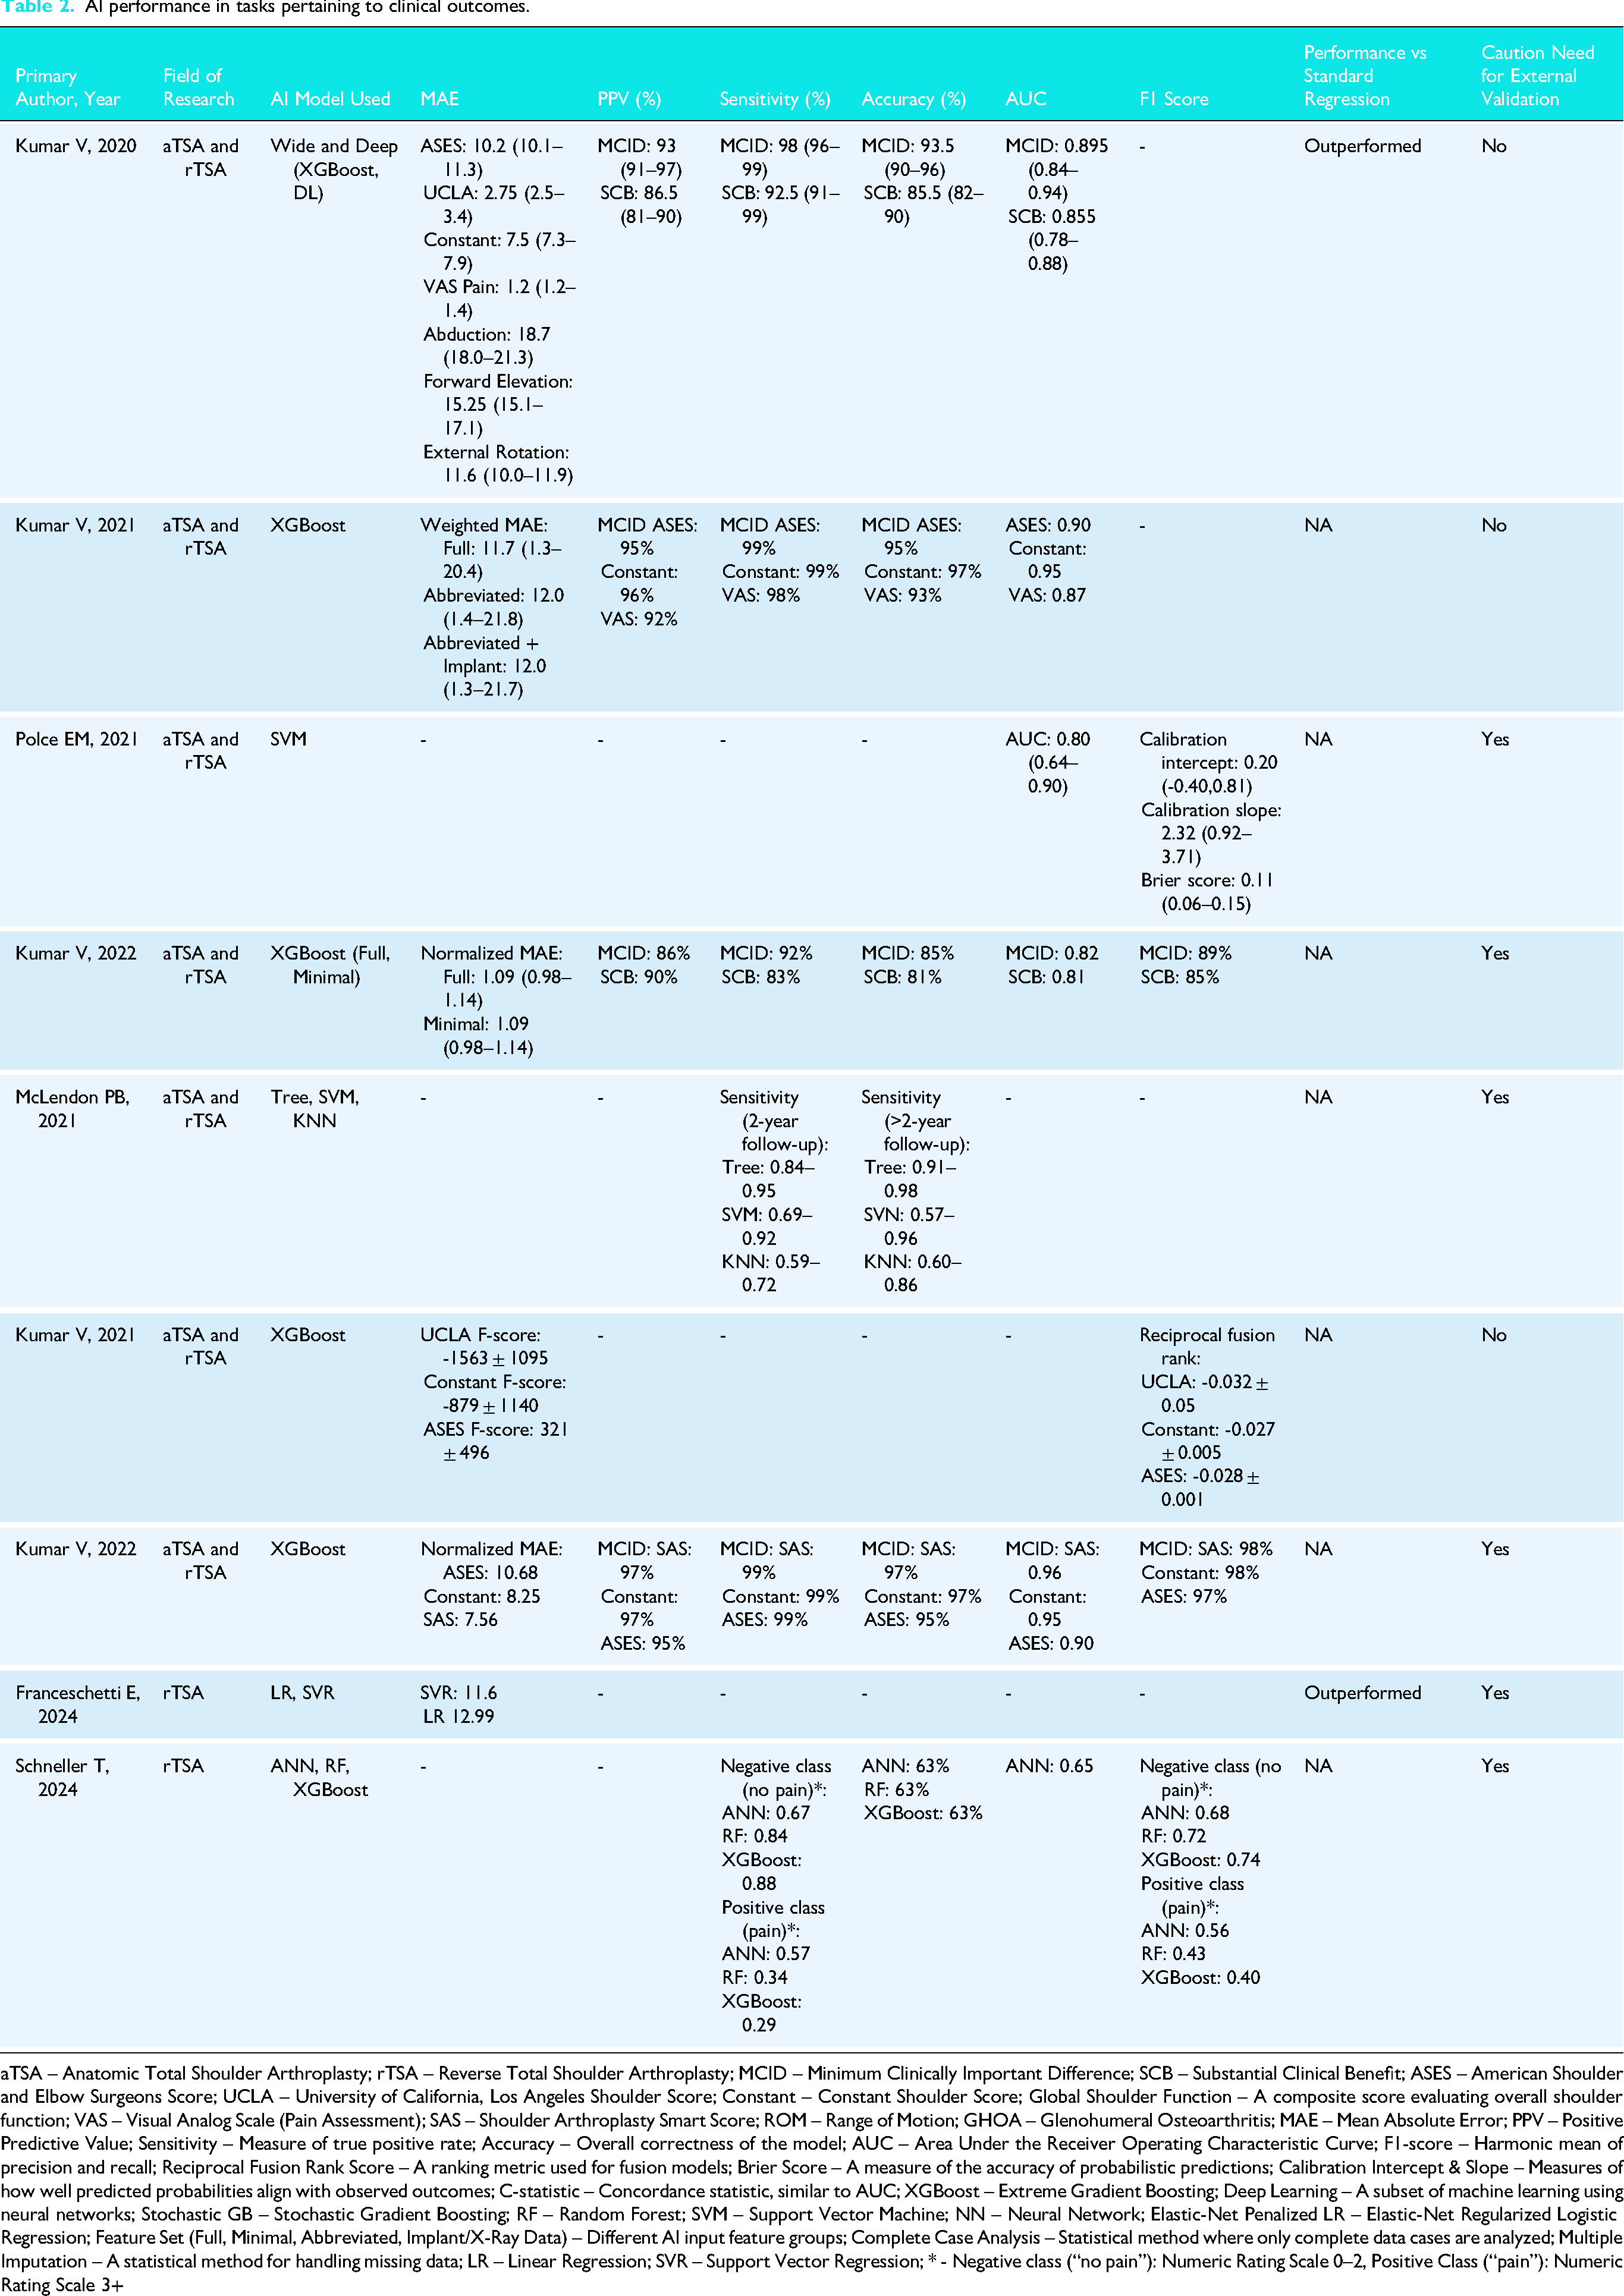
aTSA – Anatomic Total Shoulder Arthroplasty; rTSA – Reverse Total Shoulder Arthroplasty; MCID – Minimum Clinically Important Difference; SCB – Substantial Clinical Benefit; ASES – American Shoulder and Elbow Surgeons Score; UCLA – University of California, Los Angeles Shoulder Score; Constant – Constant Shoulder Score; Global Shoulder Function – A composite score evaluating overall shoulder function; VAS – Visual Analog Scale (Pain Assessment); SAS – Shoulder Arthroplasty Smart Score; ROM – Range of Motion; GHOA – Glenohumeral Osteoarthritis; MAE – Mean Absolute Error; PPV – Positive Predictive Value; Sensitivity – Measure of true positive rate; Accuracy – Overall correctness of the model; AUC – Area Under the Receiver Operating Characteristic Curve; F1-score – Harmonic mean of precision and recall; Reciprocal Fusion Rank Score – A ranking metric used for fusion models; Brier Score – A measure of the accuracy of probabilistic predictions; Calibration Intercept & Slope – Measures of how well predicted probabilities align with observed outcomes; C-statistic – Concordance statistic, similar to AUC; XGBoost – Extreme Gradient Boosting; Deep Learning – A subset of machine learning using neural networks; Stochastic GB – Stochastic Gradient Boosting; RF – Random Forest; SVM – Support Vector Machine; NN – Neural Network; Elastic-Net Penalized LR – Elastic-Net Regularized Logistic Regression; Feature Set (Full, Minimal, Abbreviated, Implant/X-Ray Data) – Different AI input feature groups; Complete Case Analysis – Statistical method where only complete data cases are analyzed; Multiple Imputation – A statistical method for handling missing data; LR – Linear Regression; SVR – Support Vector Regression; * - Negative class (“no pain”): Numeric Rating Scale 0–2, Positive Class (“pain”): Numeric Rating Scale 3+
Summary of AI models across included studies.
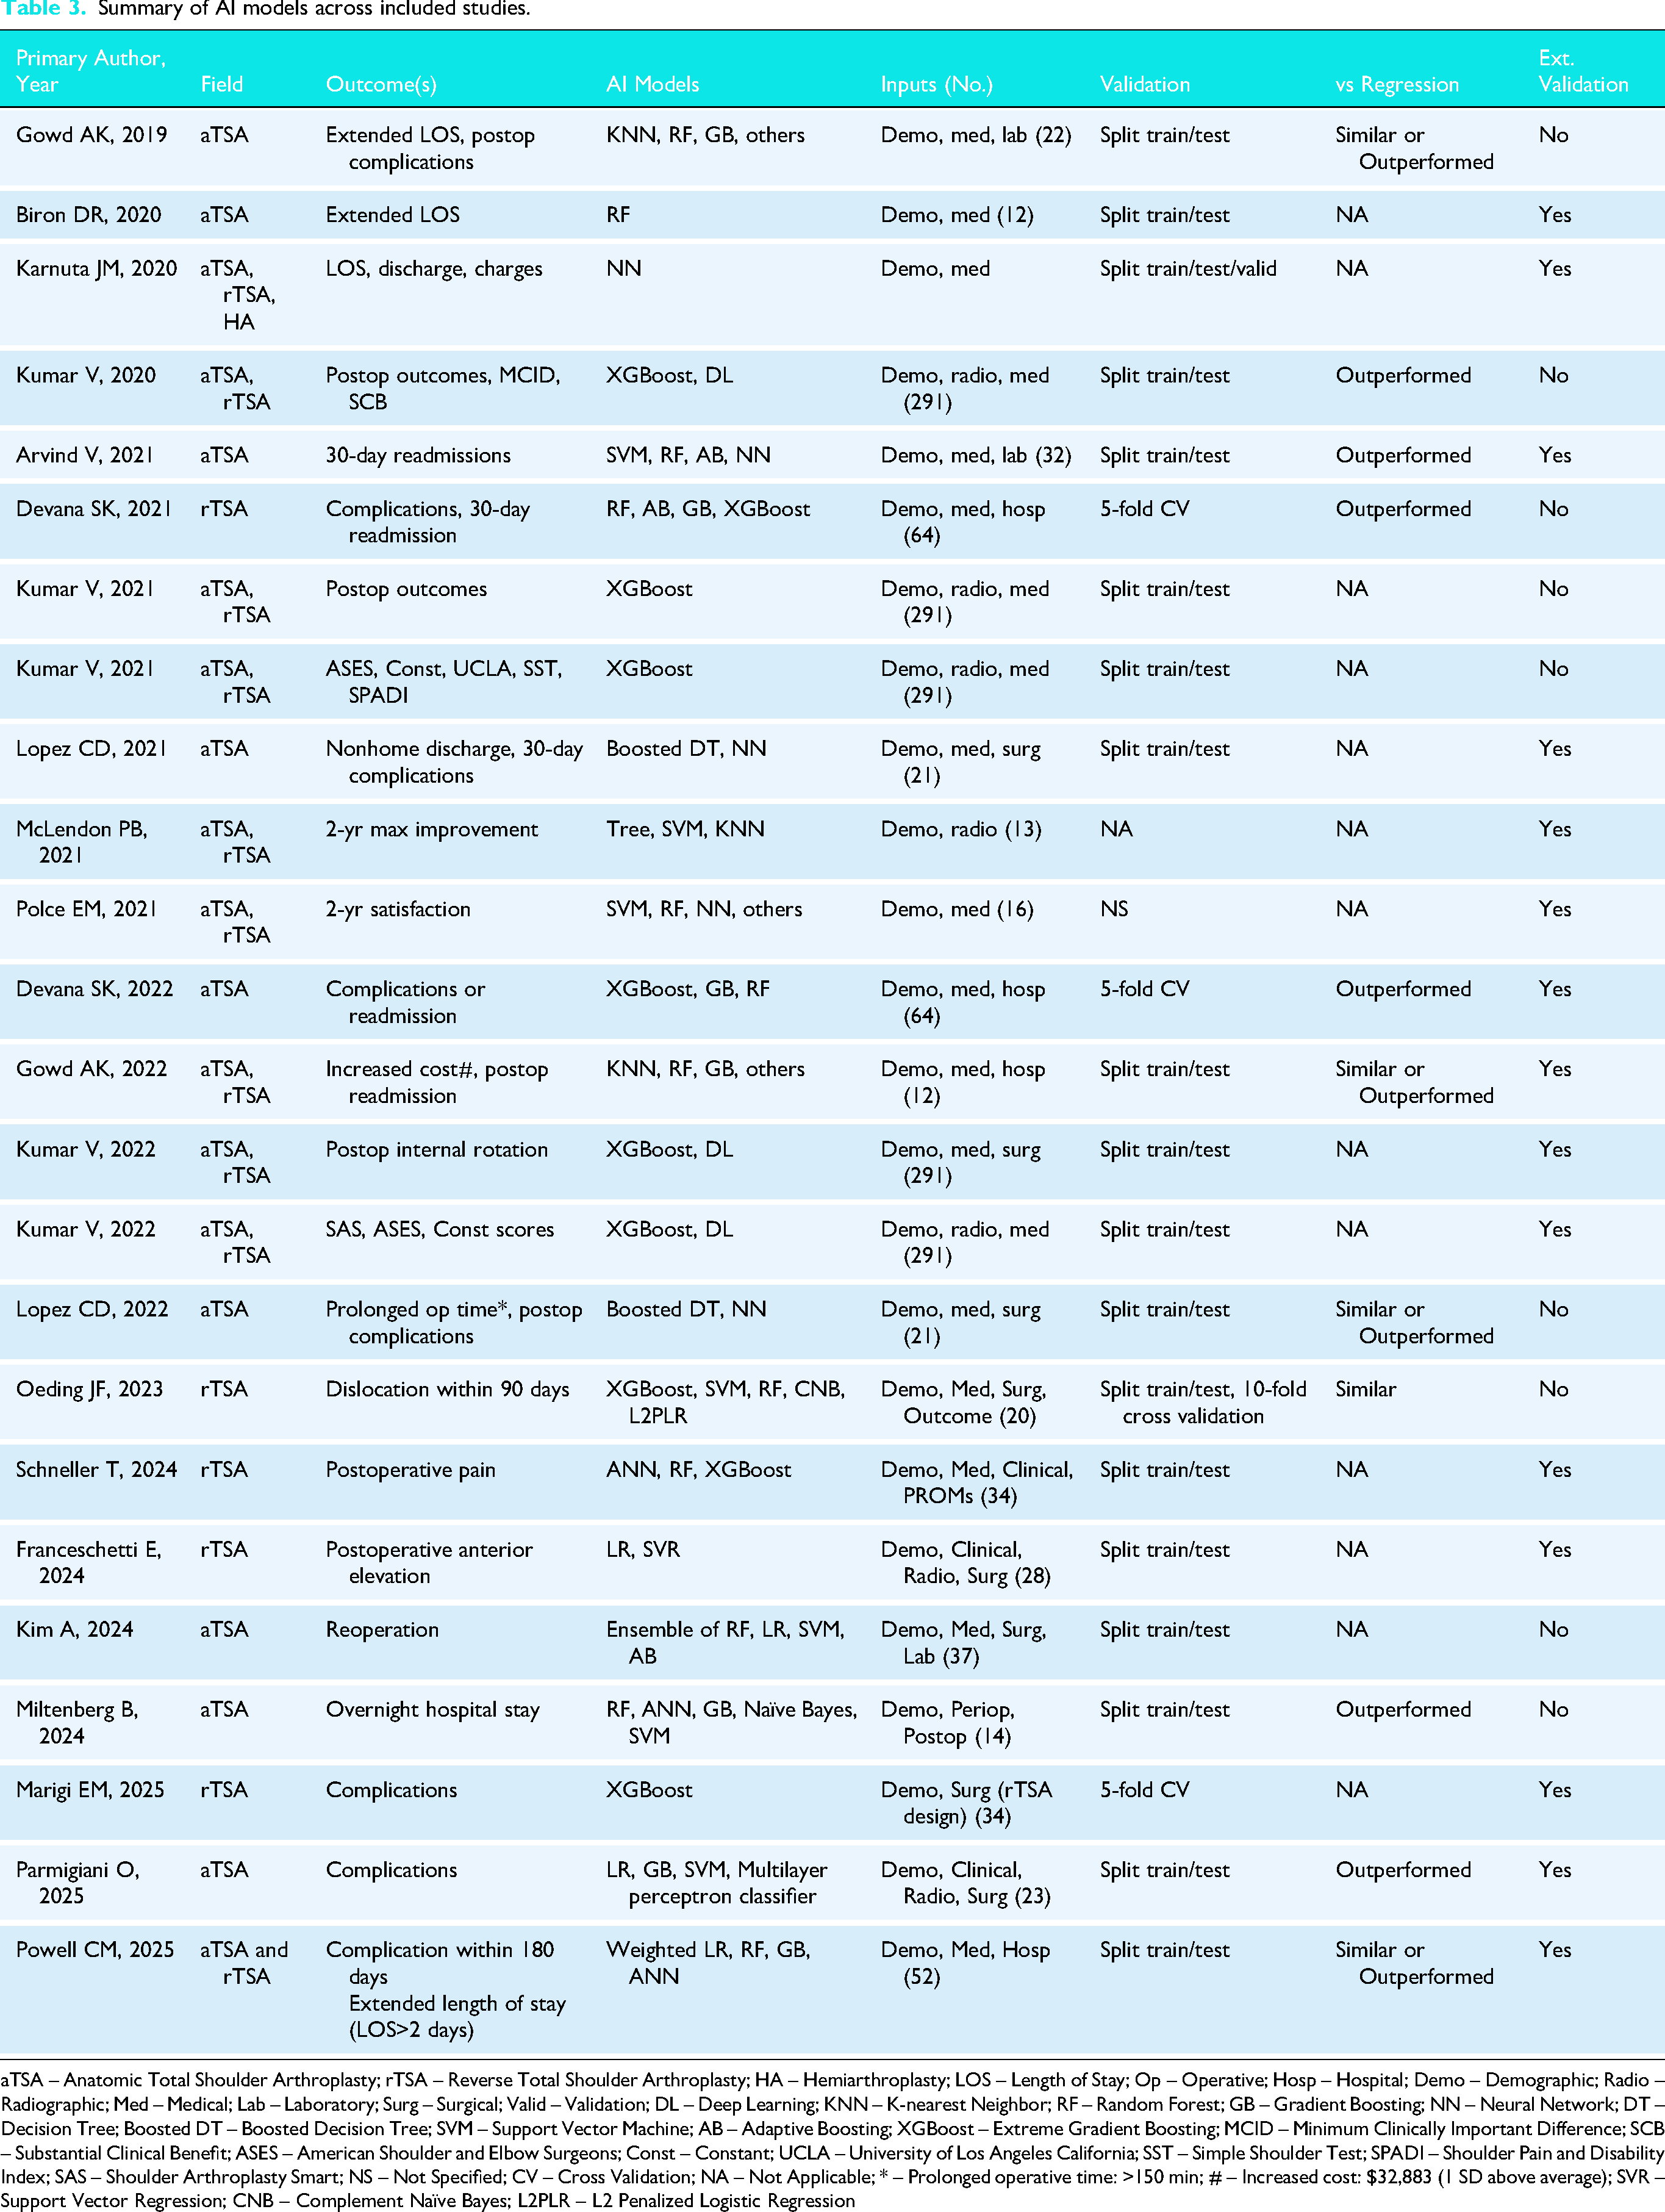
aTSA – Anatomic Total Shoulder Arthroplasty; rTSA – Reverse Total Shoulder Arthroplasty; HA – Hemiarthroplasty; LOS – Length of Stay; Op – Operative; Hosp – Hospital; Demo – Demographic; Radio – Radiographic; Med – Medical; Lab – Laboratory; Surg – Surgical; Valid – Validation; DL – Deep Learning; KNN – K-nearest Neighbor; RF – Random Forest; GB – Gradient Boosting; NN – Neural Network; DT – Decision Tree; Boosted DT – Boosted Decision Tree; SVM – Support Vector Machine; AB – Adaptive Boosting; XGBoost – Extreme Gradient Boosting; MCID – Minimum Clinically Important Difference; SCB – Substantial Clinical Benefit; ASES – American Shoulder and Elbow Surgeons; Const – Constant; UCLA – University of Los Angeles California; SST – Simple Shoulder Test; SPADI – Shoulder Pain and Disability Index; SAS – Shoulder Arthroplasty Smart; NS – Not Specified; CV – Cross Validation; NA – Not Applicable; * – Prolonged operative time: >150 min; # – Increased cost: $32,883 (1 SD above average); SVR – Support Vector Regression; CNB – Complement Naïve Bayes; L2PLR – L2 Penalized Logistic Regression
Efficacy and applications: adverse events
Adverse events were reported across 12 studies,4,27,29–34,36,38–40 and included all-cause adverse events (complications, reoperations) (n = 10 studies; 83.3%)4,27,29,31–34,38–40 and unplanned readmission (n = 4 studies; 44.4%).30,31,33,36 12 studies (100%) reported AUC (median [range]: 0.71 [0.49 to 0.92]),4,27,29–34,36,38–40 seven studies (58.3%) reported accuracy (median [range]: 95.3% [20.8% to 99.6%]),4,27,29,32,34,38,39 four studies (33.3%) reported Brier score (median [range]: 0.150 [0.037 to 0.052])31,33,38,40 and PPV (range: 52.2 to 62.5) (Table 5).4,29,36 The median number of features used during model training was 25 (range: 12 to 64), with all studies using demographic and medical data as input features (n = 12 studies).4,27,29–34,36,38–40 AI algorithms were developed by splitting data into training and test sets for all studies (n = 12 studies).4,27,29,30,32,34,36,38–40 In terms of internal validation methods, CV (n = 4 studies) was used.27,31,33,40 Out of the studies (n = 9; 75.0%) which compared AI to traditional regression, all reported that AI models demonstrated superior performance. (Table 3).4,29–31,33,34,36,38,40
AI performance in tasks pertaining to resource utilization.
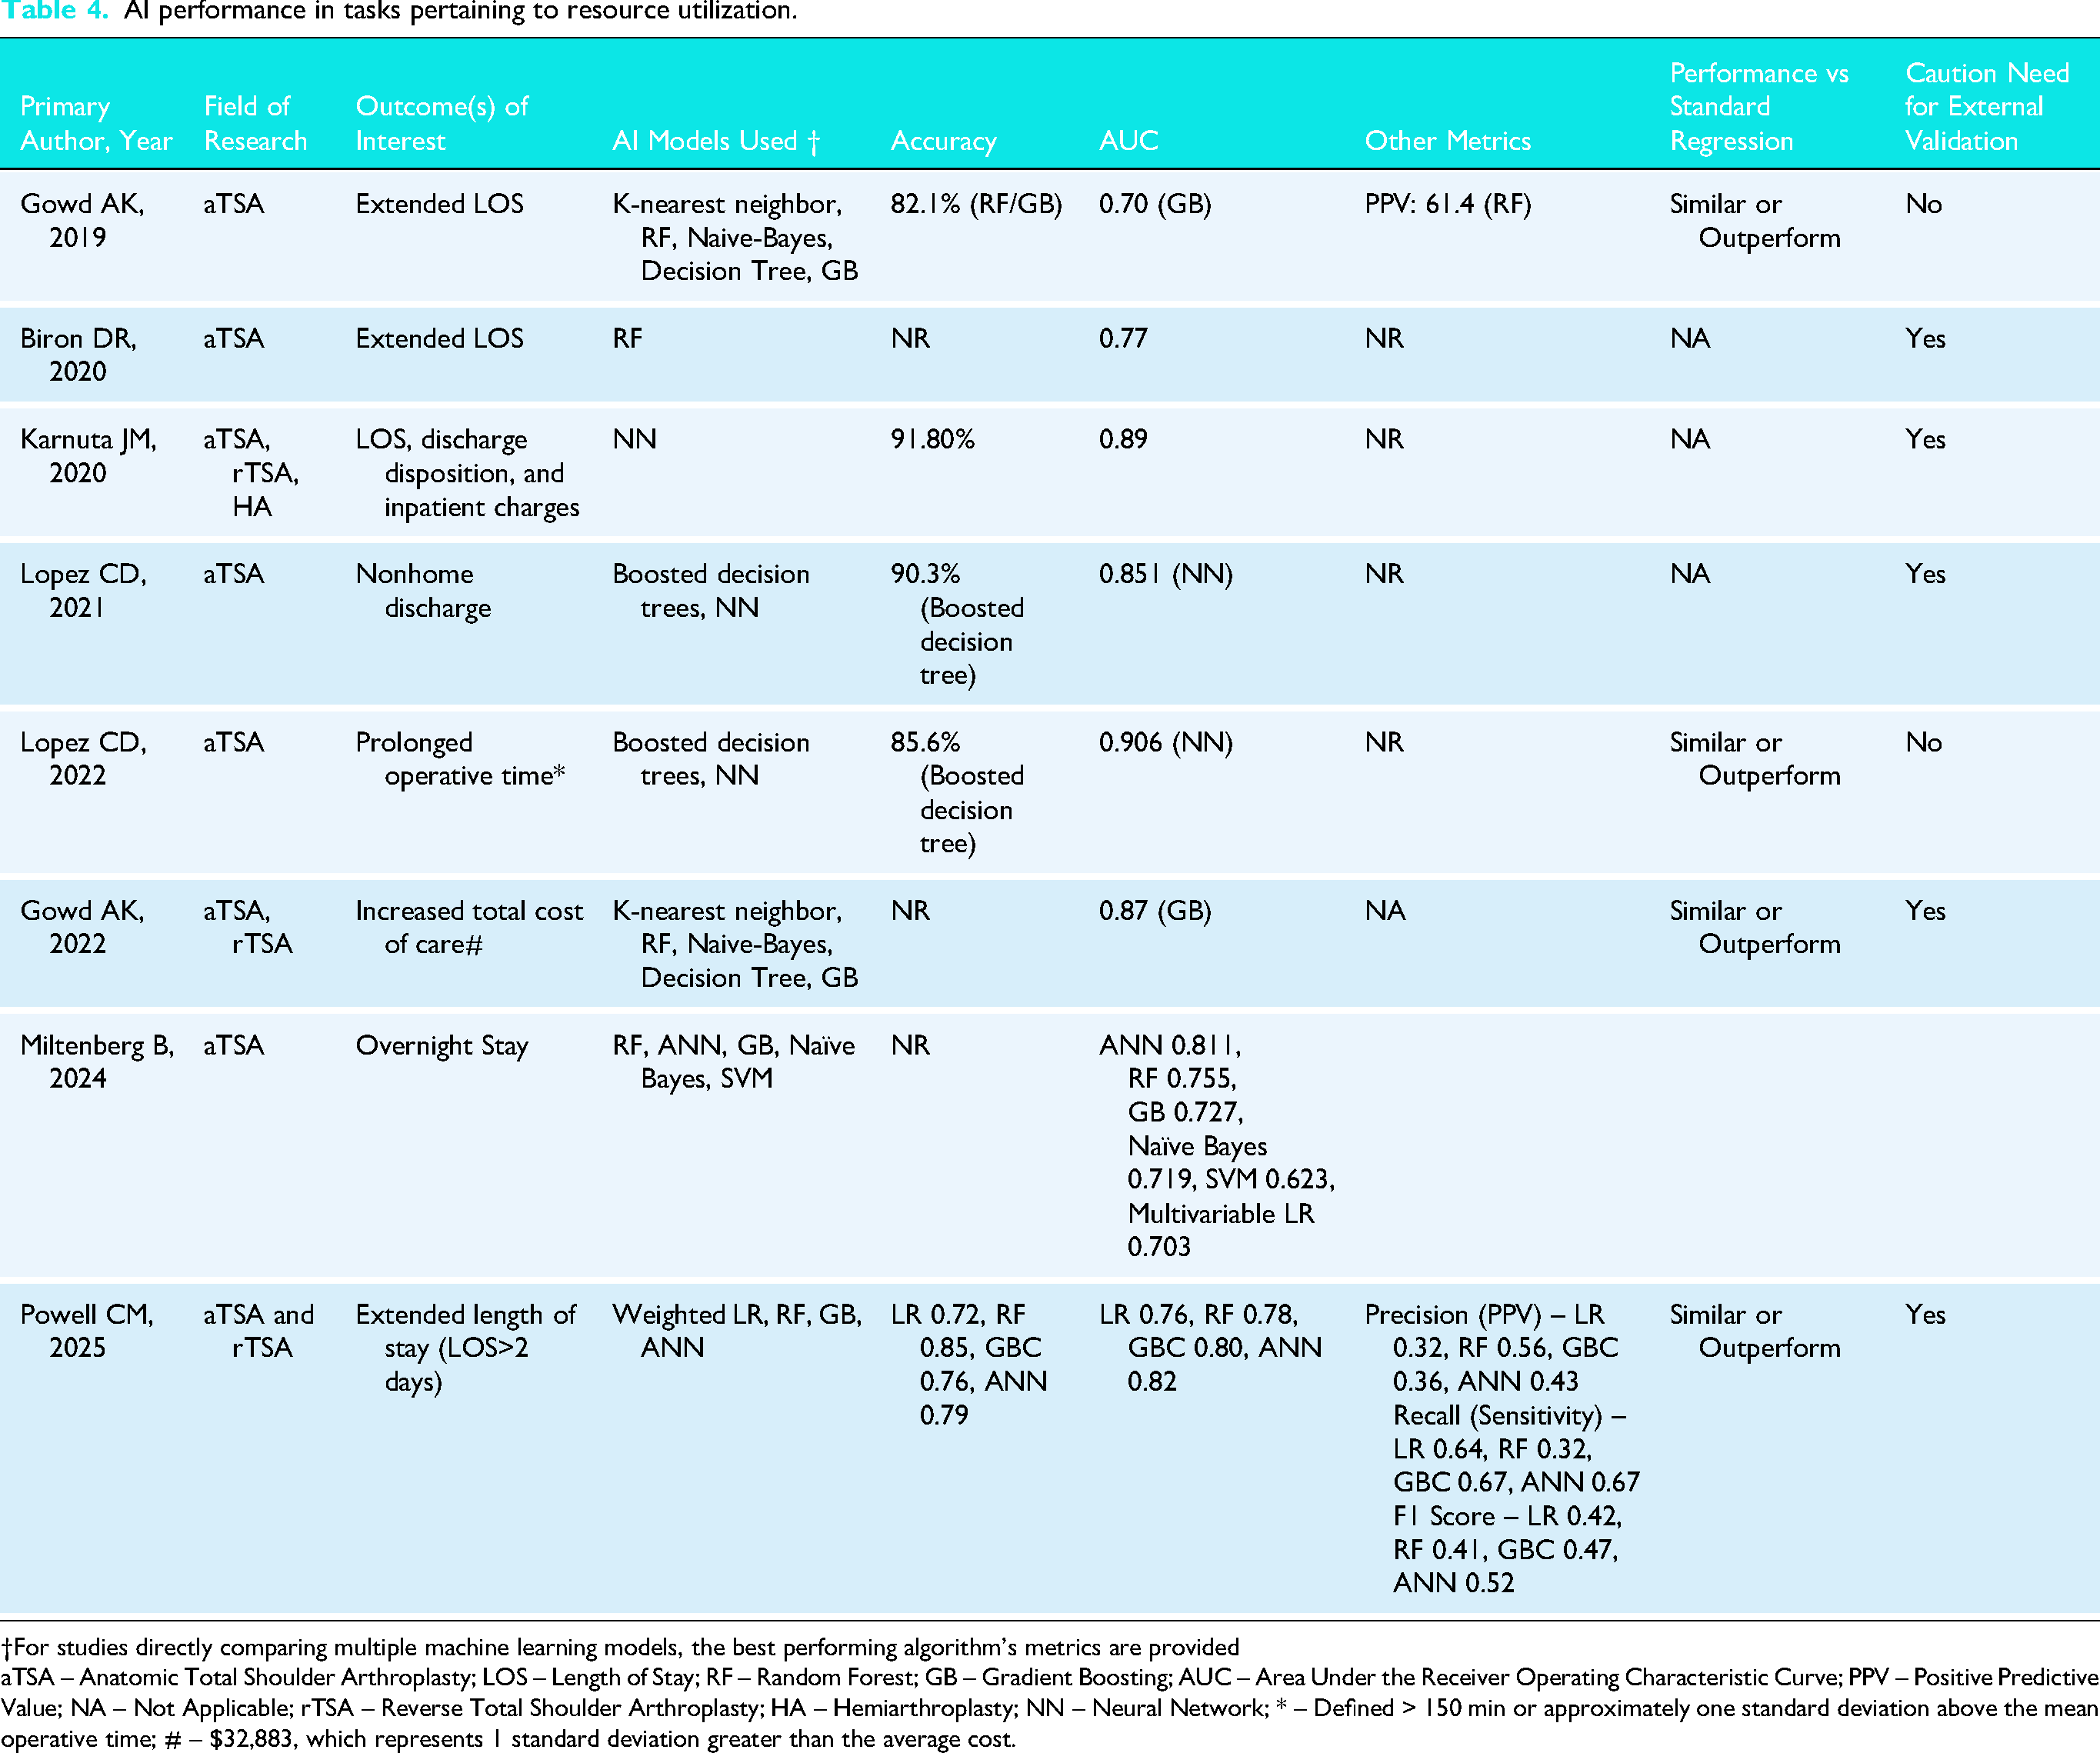
†For studies directly comparing multiple machine learning models, the best performing algorithm's metrics are provided
aTSA – Anatomic Total Shoulder Arthroplasty; LOS – Length of Stay; RF – Random Forest; GB – Gradient Boosting; AUC – Area Under the Receiver Operating Characteristic Curve; PPV – Positive Predictive Value; NA – Not Applicable; rTSA – Reverse Total Shoulder Arthroplasty; HA – Hemiarthroplasty; NN – Neural Network; * – Defined > 150 min or approximately one standard deviation above the mean operative time; # – $32,883, which represents 1 standard deviation greater than the average cost.
AI performance in tasks pertaining to complications.
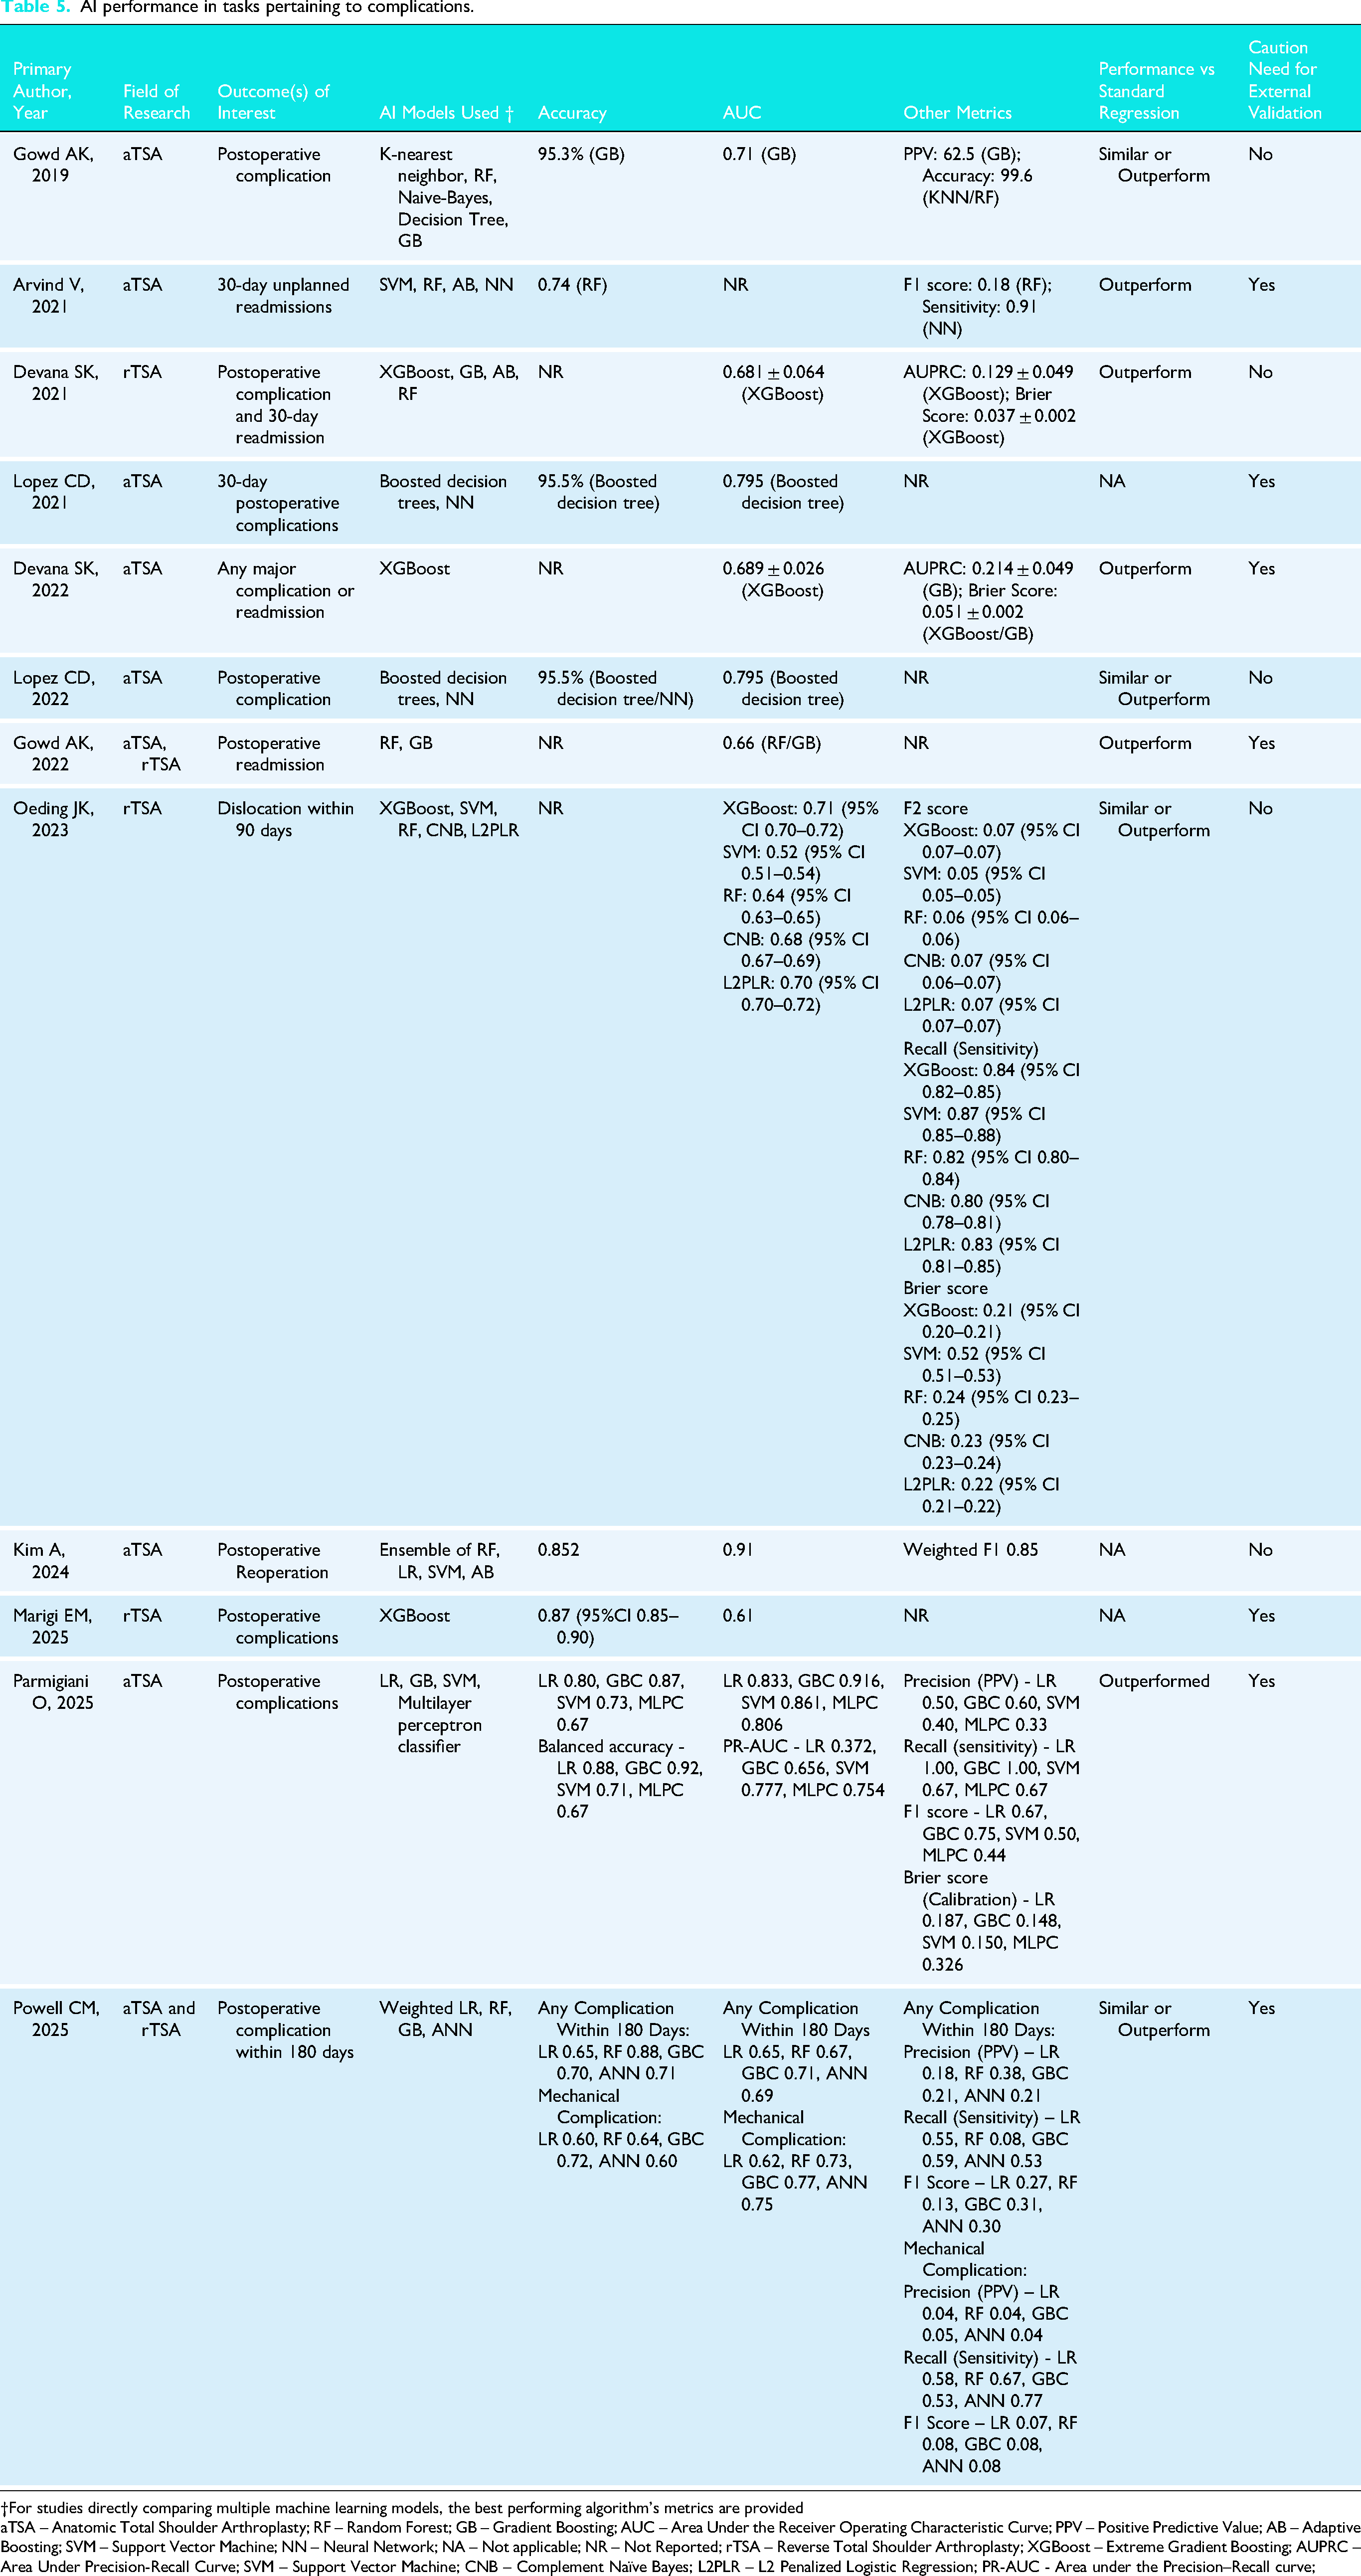
†For studies directly comparing multiple machine learning models, the best performing algorithm's metrics are provided
aTSA – Anatomic Total Shoulder Arthroplasty; RF – Random Forest; GB – Gradient Boosting; AUC – Area Under the Receiver Operating Characteristic Curve; PPV – Positive Predictive Value; AB – Adaptive Boosting; SVM – Support Vector Machine; NN – Neural Network; NA – Not applicable; NR – Not Reported; rTSA – Reverse Total Shoulder Arthroplasty; XGBoost – Extreme Gradient Boosting; AUPRC – Area Under Precision-Recall Curve; SVM – Support Vector Machine; CNB – Complement Naïve Bayes; L2PLR – L2 Penalized Logistic Regression; PR-AUC - Area under the Precision–Recall curve;
Discussion
The principle findings of the current study are as follows: (1) current applications of AI in the TSA literature included prediction models developed on datasets to predict clinical outcomes, adverse events, and resource utilization after TSA; (2) clinical prediction models demonstrated fair to excellent performance in predicting clinical outcomes and resource utilization, but poor performance for predicting adverse events on TSA datasets, with all studies comparing AI and traditional regression models reporting superior performance in favor of AI; (3) although most studies met greater than half of the criteria outlined in the TRIPOD guidelines, only 26.1% met greater than two-thirds of criteria, suggesting a concerning degree of incomplete and non-transparent reporting in this literature; and (4) there was also a high risk of bias in model development and reporting as assessed with the PROBAST tool, found primarily in the analysis domain. Therefore, the current review provides evidence of poor methodological conduct and unacceptable reporting quality for existing clinical prediction models developing using machine learning but identifies several areas for improvements moving forward.
Several other domains of AI have been investigated in the context of TSA including imaging detection, language interpretation and clinical decision support. In the current study that focused on clinical prediction models derived from machine learning approaches, it was identified that the current applications include prognostication of clinical outcomes, resource utilization (i.e., length of stay, operative time, cost of care) and adverse events. Given the recent introduction of AI in orthopedic surgery and rapidly evolving technologic capabilities,1–3 it is both plausible and likely that applications for TSA will expand over time. For example, an important and developing application of AI is patient procedural indication via risk stratification. 37 AI models can help personalize treatment for patients by providing predictive analytics based on specific medical profiles when indicating patients for a shoulder arthroplasty procedure. 4 Furthermore, implementation of such models may also help determine the most appropriate and cost-effective setting for a TSA to receive their care (i.e., inpatient, outpatient, or ambulatory care) based on the risk of post-operative complications and need for associated medical infrastructure to address adverse events that may be experienced.4,37 Therefore, future studies are necessary to confirm the efficacy and generalizability of the current TSA models in prospective settings. Furthermore, performance confirmation of current models in the setting of expanding technological capabilities concerning integration with cloud-based platforms may lead to the development of more sophisticated provider-facing tools. Such AI-based platforms may enhance and expedite clinical workflow and prognostication through automated risk stratification that incorporates clinically relevant metrics from patient imaging autonomously through leveraging generative AI and deep learning.
The performance of AI models, as predominately reported through the AUC, was good to excellent across models developed for PROMs and resource utilization prediction, whereas performance was overall fair for predicting adverse events. Furthermore, the performance of current AI models exceeded that of traditional regression in all cases, suggesting clinical utility in applying these advanced methodologies. This performance advantage may be a function of the capability of AI models for identifying nonlinear, complex relationships, which is generally limited by conventional statistical methods.5,643–48 Indeed, conventional statistical methods, such as regression, are considered static and rely on predefined relationships, thus making it less viable for large data sets. 43 Regardless, these comparisons are essential in such investigations in order to avoid the inappropriate repackaging of data for AI models that may not be superior to regression. With the shift towards performing TSA in the outpatient setting due to advances in multimodal pain management and the need to decrease healthcare costs, 37 49–51 it will become increasingly important that predictive models demonstrate high accuracy and performance to carefully select patients via risk stratification. Further studies are needed to understand the variance in performance of current AI models developed to predict adverse events. Furthermore, it is especially concerning that current investigators have omitted evaluating model calibration, Brier score, and decision-curve analyses, as these assessments are imperative to understand the clinical utility and performance of prediction models. Until these evaluations are performed and tested, current AI models for TSA should not be used to support or augment clinical decisions, as dependence on the AUC alone can be misleading as it pertains to model behavior.
There exist numerous areas of improvement for AI models concerning TSA despite the substantial increase in literature and attention this subject has garnered. A considerable proportion of studies not only failed to specify study setting and other important methodological considers, but model transparency and reporting were consistently limited. Essential methodological considerations, such as disclosing the proportion of missing data, in addition to code source and availability, was variably reported. Moreover, only six of the identified studies met greater than two-thirds the recommended reporting criteria, which is of concern.27,28,37,40,42,43 Furthermore, only 62.5% of studies recommended and emphasized the importance of externally validating their models. Therefore, the authors cannot recommend, and in fact must caution against, any use of the models in the current study for these reasons. To improve upon current models, several approaches should be pursued.6,9 First, source code and datasets should be openly available to readers such that efforts are not wasted on repackaging data in similar manners. Furthermore, this can potentially help improve performance of AI models as this allows for others to critically appraise the methods of such investigations, which may lead to the identification of areas where changes to code or data handling boost model performance. Second, data sources should be thoroughly investigated prior to model development, as factors data missingness, distribution, and how the data was collected and whether it is regularly audited may influence the quality of the data. Third, investigators must adhere to TRIPOD reporting guidelines. These guidelines were created for prognostic and diagnostic prediction models to ensure reporting transparency and will ensure that prediction models are created on a legitimate statistical foundation. This will translate into increased confidence in models and results following publication. Fourth, investigators must not recommend use of their models until fully validated, which means prospective, international, and external validation efforts. External validity is an essential component of the model development and deployment process. Lastly, the high risk of bias across majority of included studies, as assessed by the PROBAST tool is concerning. The high risk of bias across many of the studies can be attributed to the analysis domain in which studies failed to discern whether the selection of predictors was based on univariable analysis and if the complexities in the data (e.g., censoring, competing risks, etc.) were accounted for. This can instill several biases as potential interactions or confounders among predictors are not accounted for. Furthermore, the inadequate handling of complexities can lead to suboptimal model performance and generalizability. These findings highlight the dire need to develop and validate prediction models which have robust data handling strategies and adequate multivariable analysis techniques. Henceforth, future studies assessing machine learning prediction models in the context of TSA should strive to adhere to the guidelines set forth by PROBAST, particularly with the analysis domain.
Limitations
Several limitations are important to consider when interpreting the results of the current systematic review. First, it is limited by the quality and composition of included studies. Most studies (95.8%) were conducted in the United States, making the results less generalizable to other populations. Additionally, most studies did not specify the indications of TSA and therefore the utility of AI models for certain populations (i.e., revision, proximal humeral fractures, rotator cuff tendinopathy, etc.) could not be assessed. Future studies should develop AI models for specific populations, which may reduce heterogeneity and enhance performance. Second, due to the nature of AI models, the current review was unable to determine how individual patient factors or imaging findings affected the predictive ability of models. Third, a formal quantitative meta-analysis was unable to be performed given the heterogeneity in primary outcomes of the included studies; however, the inclusion of studies applying AI to a wide variety of predictive tasks was the purpose of the current study and allows for a scoping perspective of contemporary uses of AI in TSA literature. Next, although several studies concluded that AI models were ‘superior’ to traditional regression, these claims were based almost entirely on discrimination metrics such as accuracy and AUC. Given that calibration metrics were universally absent, these findings should be interpreted with caution. Future work should incorporate calibration to meaningfully compare AI and regression models and to determine whether the added complexity of AI methods provides true clinical value. Finally, the overall generalizability of AI prediction models and the propensity for implementation into clinical practice cannot be analyzed or recommended as no studies represented an external validation phase of algorithm development.
Conclusion
AI prediction models in TSA show poor methodology, especially in calibration, sample size, missing data, and validation, warranting cautious interpretation and clearer direction for future research.
Supplemental Material
sj-docx-1-sel-10.1177_17585732251412368 - Supplemental material for Transparency of reporting and methodological conduct of prognostic and diagnostic clinical prediction models developed using machine learning in total shoulder arthroplasty: A systematic review and critical appraisal
Supplemental material, sj-docx-1-sel-10.1177_17585732251412368 for Transparency of reporting and methodological conduct of prognostic and diagnostic clinical prediction models developed using machine learning in total shoulder arthroplasty: A systematic review and critical appraisal by Ajaykumar Shanmugaraj, Bushra Khalid, Mithilesh V Kumar, Kyle N Kunze and Ujash Sheth in Shoulder & Elbow
Supplemental Material
sj-docx-2-sel-10.1177_17585732251412368 - Supplemental material for Transparency of reporting and methodological conduct of prognostic and diagnostic clinical prediction models developed using machine learning in total shoulder arthroplasty: A systematic review and critical appraisal
Supplemental material, sj-docx-2-sel-10.1177_17585732251412368 for Transparency of reporting and methodological conduct of prognostic and diagnostic clinical prediction models developed using machine learning in total shoulder arthroplasty: A systematic review and critical appraisal by Ajaykumar Shanmugaraj, Bushra Khalid, Mithilesh V Kumar, Kyle N Kunze and Ujash Sheth in Shoulder & Elbow
Supplemental Material
sj-docx-3-sel-10.1177_17585732251412368 - Supplemental material for Transparency of reporting and methodological conduct of prognostic and diagnostic clinical prediction models developed using machine learning in total shoulder arthroplasty: A systematic review and critical appraisal
Supplemental material, sj-docx-3-sel-10.1177_17585732251412368 for Transparency of reporting and methodological conduct of prognostic and diagnostic clinical prediction models developed using machine learning in total shoulder arthroplasty: A systematic review and critical appraisal by Ajaykumar Shanmugaraj, Bushra Khalid, Mithilesh V Kumar, Kyle N Kunze and Ujash Sheth in Shoulder & Elbow
Footnotes
Funding
The authors received no financial support for the research, authorship, and/or publication of this article.
Conflict of interest
The authors, their immediate families, and any research foundation with which they are affiliated have not received any financial payments or other benefits from any commercial entity related to the subject of this article.
Previous communication
This study is not based on a previous communication to a society or meeting.
Supplemental material
Supplemental material for this article is available online.
Appendix Table 1. Search strategy
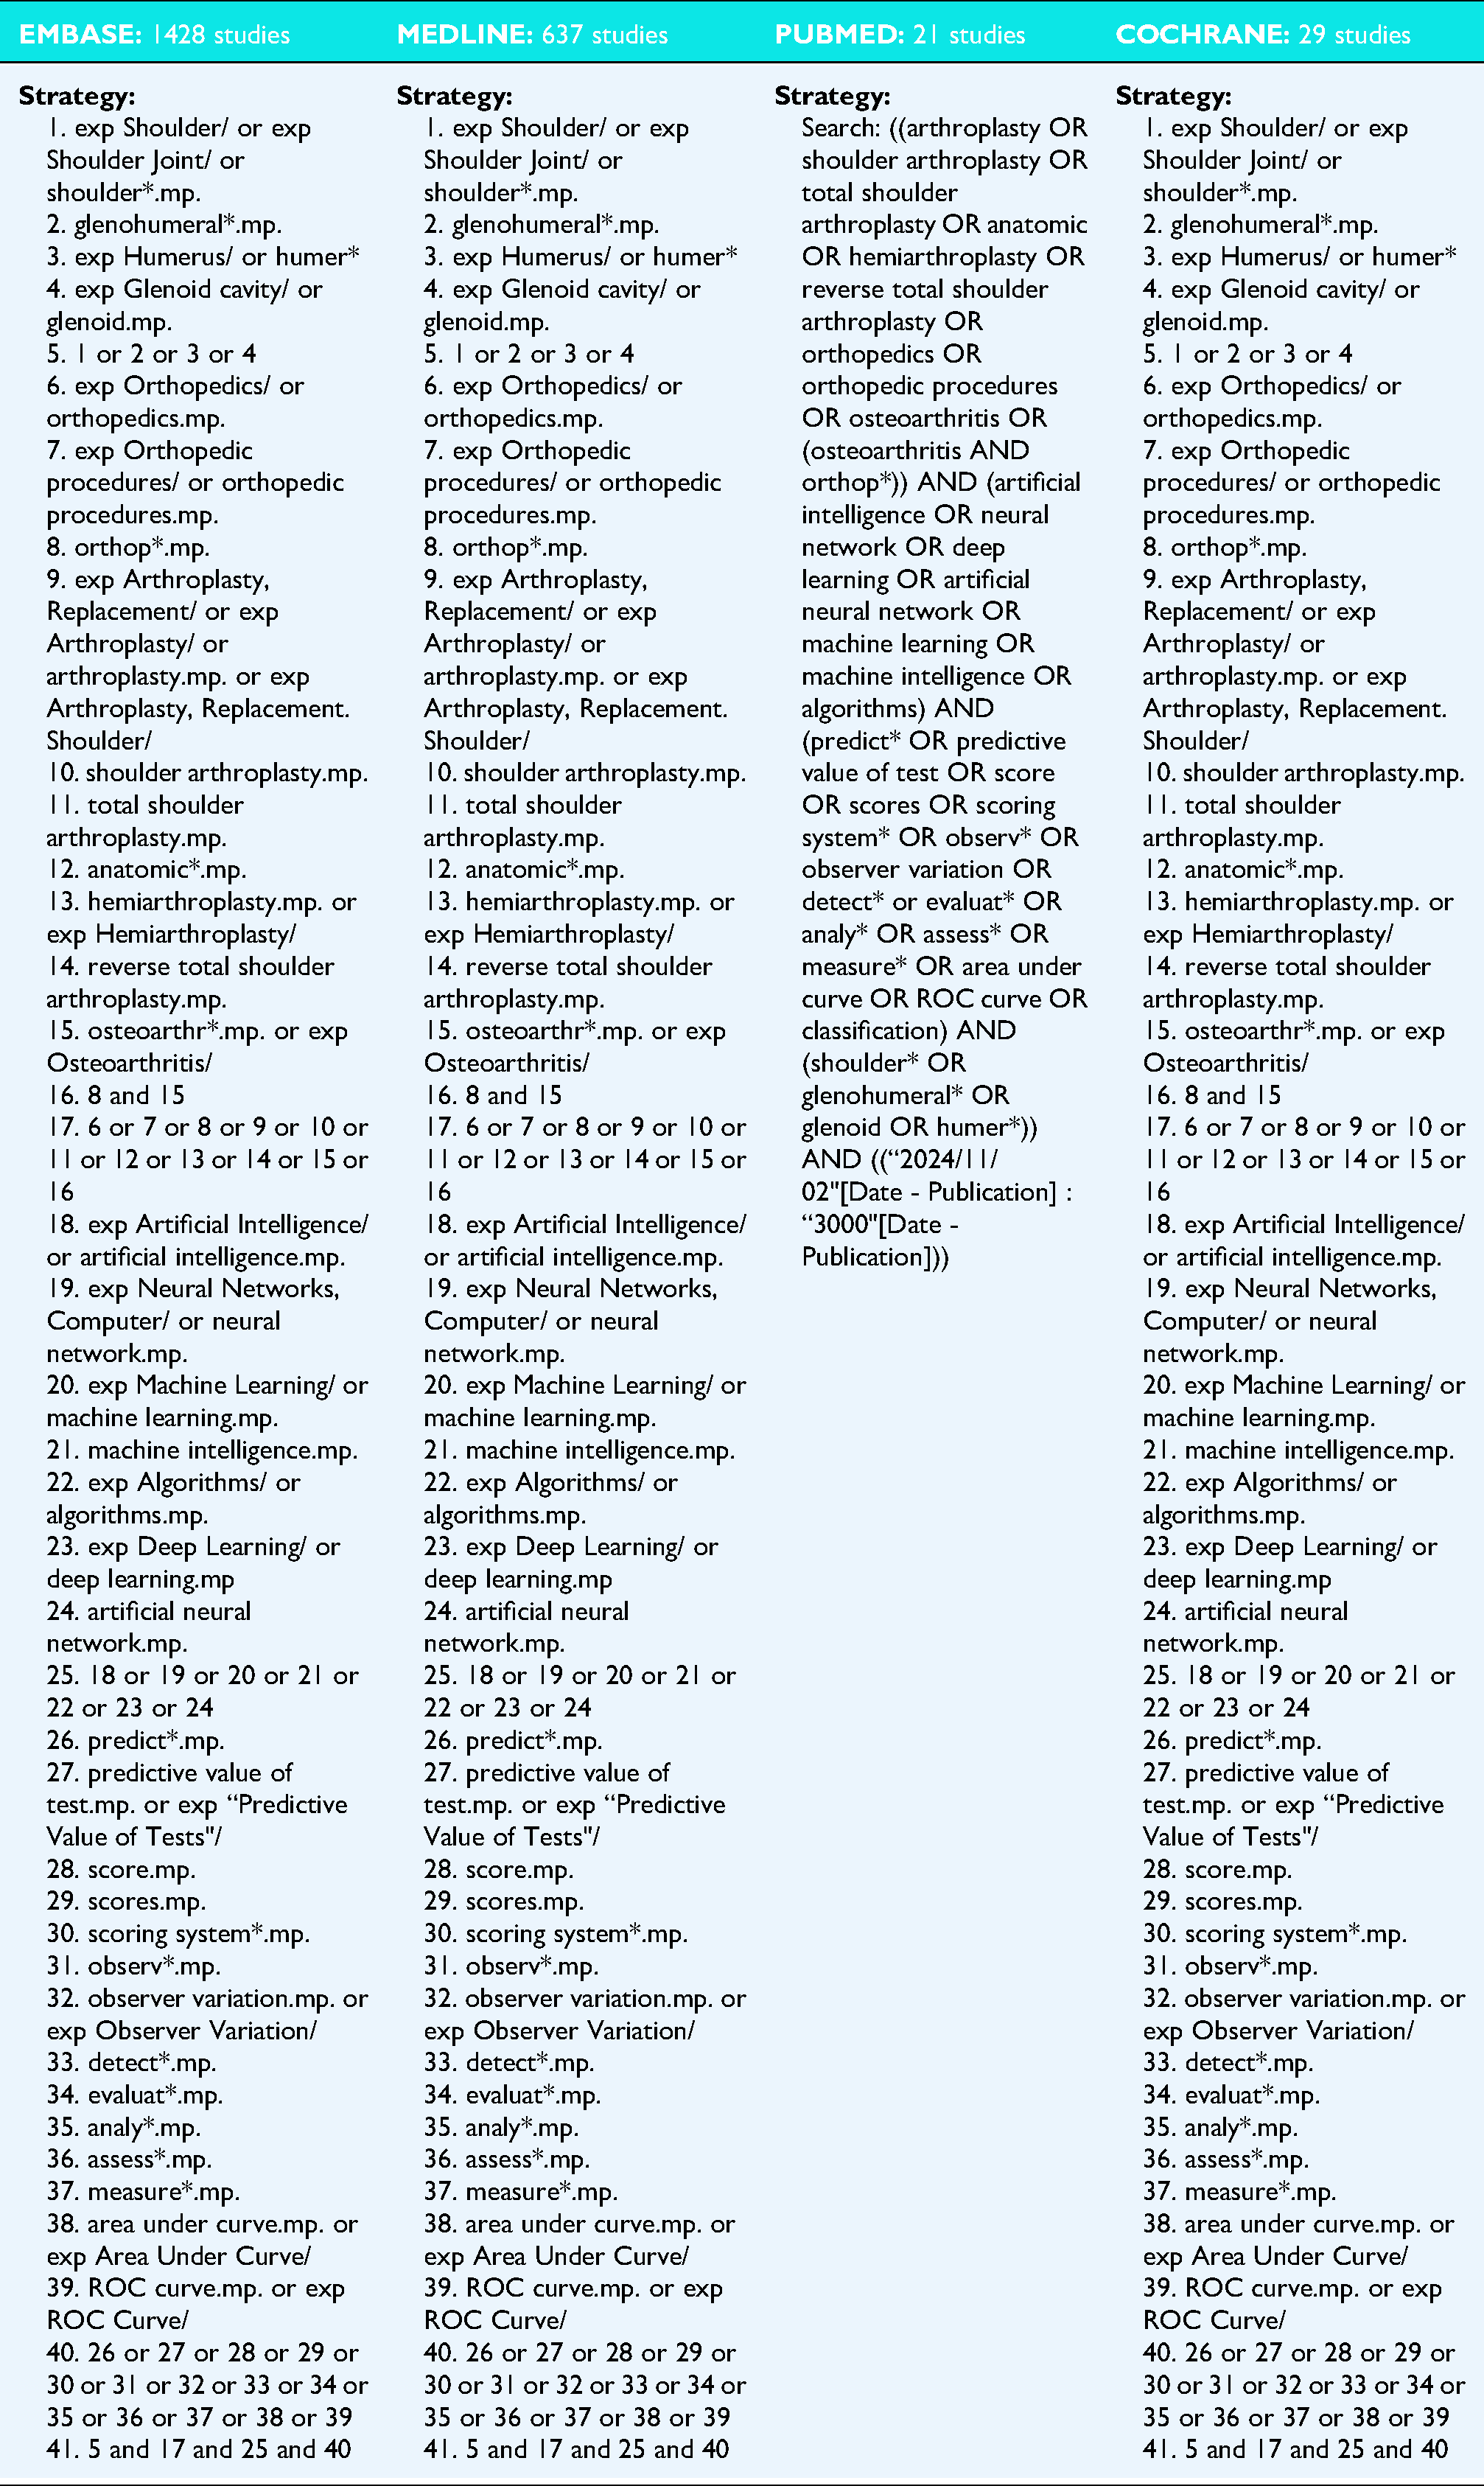
1. exp Shoulder/ or exp Shoulder Joint/ or shoulder*.mp. 2. glenohumeral*.mp. 3. exp Humerus/ or humer* 4. exp Glenoid cavity/ or glenoid.mp. 5. 1 or 2 or 3 or 4 6. exp Orthopedics/ or orthopedics.mp. 7. exp Orthopedic procedures/ or orthopedic procedures.mp. 8. orthop*.mp. 9. exp Arthroplasty, Replacement/ or exp Arthroplasty/ or arthroplasty.mp. or exp Arthroplasty, Replacement. Shoulder/ 10. shoulder arthroplasty.mp. 11. total shoulder arthroplasty.mp. 12. anatomic*.mp. 13. hemiarthroplasty.mp. or exp Hemiarthroplasty/ 14. reverse total shoulder arthroplasty.mp. 15. osteoarthr*.mp. or exp Osteoarthritis/ 16. 8 and 15 17. 6 or 7 or 8 or 9 or 10 or 11 or 12 or 13 or 14 or 15 or 16 18. exp Artificial Intelligence/ or artificial intelligence.mp. 19. exp Neural Networks, Computer/ or neural network.mp. 20. exp Machine Learning/ or machine learning.mp. 21. machine intelligence.mp. 22. exp Algorithms/ or algorithms.mp. 23. exp Deep Learning/ or deep learning.mp 24. artificial neural network.mp. 25. 18 or 19 or 20 or 21 or 22 or 23 or 24 26. predict*.mp. 27. predictive value of test.mp. or exp “Predictive Value of Tests"/ 28. score.mp. 29. scores.mp. 30. scoring system*.mp. 31. observ*.mp. 32. observer variation.mp. or exp Observer Variation/ 33. detect*.mp. 34. evaluat*.mp. 35. analy*.mp. 36. assess*.mp. 37. measure*.mp. 38. area under curve.mp. or exp Area Under Curve/ 39. ROC curve.mp. or exp ROC Curve/ 40. 26 or 27 or 28 or 29 or 30 or 31 or 32 or 33 or 34 or 35 or 36 or 37 or 38 or 39 41. 5 and 17 and 25 and 40 |
1. exp Shoulder/ or exp Shoulder Joint/ or shoulder*.mp. 2. glenohumeral*.mp. 3. exp Humerus/ or humer* 4. exp Glenoid cavity/ or glenoid.mp. 5. 1 or 2 or 3 or 4 6. exp Orthopedics/ or orthopedics.mp. 7. exp Orthopedic procedures/ or orthopedic procedures.mp. 8. orthop*.mp. 9. exp Arthroplasty, Replacement/ or exp Arthroplasty/ or arthroplasty.mp. or exp Arthroplasty, Replacement. Shoulder/ 10. shoulder arthroplasty.mp. 11. total shoulder arthroplasty.mp. 12. anatomic*.mp. 13. hemiarthroplasty.mp. or exp Hemiarthroplasty/ 14. reverse total shoulder arthroplasty.mp. 15. osteoarthr*.mp. or exp Osteoarthritis/ 16. 8 and 15 17. 6 or 7 or 8 or 9 or 10 or 11 or 12 or 13 or 14 or 15 or 16 18. exp Artificial Intelligence/ or artificial intelligence.mp. 19. exp Neural Networks, Computer/ or neural network.mp. 20. exp Machine Learning/ or machine learning.mp. 21. machine intelligence.mp. 22. exp Algorithms/ or algorithms.mp. 23. exp Deep Learning/ or deep learning.mp 24. artificial neural network.mp. 25. 18 or 19 or 20 or 21 or 22 or 23 or 24 26. predict*.mp. 27. predictive value of test.mp. or exp “Predictive Value of Tests"/ 28. score.mp. 29. scores.mp. 30. scoring system*.mp. 31. observ*.mp. 32. observer variation.mp. or exp Observer Variation/ 33. detect*.mp. 34. evaluat*.mp. 35. analy*.mp. 36. assess*.mp. 37. measure*.mp. 38. area under curve.mp. or exp Area Under Curve/ 39. ROC curve.mp. or exp ROC Curve/ 40. 26 or 27 or 28 or 29 or 30 or 31 or 32 or 33 or 34 or 35 or 36 or 37 or 38 or 39 41. 5 and 17 and 25 and 40 |
Search: ((arthroplasty OR shoulder arthroplasty OR total shoulder arthroplasty OR anatomic OR hemiarthroplasty OR reverse total shoulder arthroplasty OR orthopedics OR orthopedic procedures OR osteoarthritis OR (osteoarthritis AND orthop*)) AND (artificial intelligence OR neural network OR deep learning OR artificial neural network OR machine learning OR machine intelligence OR algorithms) AND (predict* OR predictive value of test OR score OR scores OR scoring system* OR observ* OR observer variation OR detect* or evaluat* OR analy* OR assess* OR measure* OR area under curve OR ROC curve OR classification) AND (shoulder* OR glenohumeral* OR glenoid OR humer*)) AND ((“2024/11/02"[Date - Publication] : “3000"[Date - Publication])) |
1. exp Shoulder/ or exp Shoulder Joint/ or shoulder*.mp. 2. glenohumeral*.mp. 3. exp Humerus/ or humer* 4. exp Glenoid cavity/ or glenoid.mp. 5. 1 or 2 or 3 or 4 6. exp Orthopedics/ or orthopedics.mp. 7. exp Orthopedic procedures/ or orthopedic procedures.mp. 8. orthop*.mp. 9. exp Arthroplasty, Replacement/ or exp Arthroplasty/ or arthroplasty.mp. or exp Arthroplasty, Replacement. Shoulder/ 10. shoulder arthroplasty.mp. 11. total shoulder arthroplasty.mp. 12. anatomic*.mp. 13. hemiarthroplasty.mp. or exp Hemiarthroplasty/ 14. reverse total shoulder arthroplasty.mp. 15. osteoarthr*.mp. or exp Osteoarthritis/ 16. 8 and 15 17. 6 or 7 or 8 or 9 or 10 or 11 or 12 or 13 or 14 or 15 or 16 18. exp Artificial Intelligence/ or artificial intelligence.mp. 19. exp Neural Networks, Computer/ or neural network.mp. 20. exp Machine Learning/ or machine learning.mp. 21. machine intelligence.mp. 22. exp Algorithms/ or algorithms.mp. 23. exp Deep Learning/ or deep learning.mp 24. artificial neural network.mp. 25. 18 or 19 or 20 or 21 or 22 or 23 or 24 26. predict*.mp. 27. predictive value of test.mp. or exp “Predictive Value of Tests"/ 28. score.mp. 29. scores.mp. 30. scoring system*.mp. 31. observ*.mp. 32. observer variation.mp. or exp Observer Variation/ 33. detect*.mp. 34. evaluat*.mp. 35. analy*.mp. 36. assess*.mp. 37. measure*.mp. 38. area under curve.mp. or exp Area Under Curve/ 39. ROC curve.mp. or exp ROC Curve/ 40. 26 or 27 or 28 or 29 or 30 or 31 or 32 or 33 or 34 or 35 or 36 or 37 or 38 or 39 41. 5 and 17 and 25 and 40 |
References
Supplementary Material
Please find the following supplemental material available below.
For Open Access articles published under a Creative Commons License, all supplemental material carries the same license as the article it is associated with.
For non-Open Access articles published, all supplemental material carries a non-exclusive license, and permission requests for re-use of supplemental material or any part of supplemental material shall be sent directly to the copyright owner as specified in the copyright notice associated with the article.