
Abstract
This article examines how exploratory factor analysis and Bourdieu’s concept of the illusio were applied to a study of an English secondary school in a disadvantaged area of the West Midlands. It examined the attitudes of the school’s entire cohort of 156 students during their first year at the school. By comparing the students’ self-reported attitudes to school and school practitioners’ perceptions of students’ attitudes to school, the study found that students from poorer backgrounds and those with a lower level of cultural capital were viewed more negatively than others by teachers and pastoral managers. Exploratory factor analysis was used to create robust economic and cultural capital profiles that reflected the capital within the field of the school. Exploratory factor analysis also created thematic factor scores from the data collected from both the students and the practitioners. The study found that the school, through ability grouping, created an elite group of high-capital students who practitioners perceived more positively than other students. However, this was not reflected in the students’ self-reported views of the school. The findings suggested that although the outward appearance of the schooling had changed considerably since the tripartite system was introduced, the nature of the illusio, and the students advantaged and disadvantaged by it, remained fundamentally the same.
Keywords
Every generation must fight the same battles again and again. There’s no final victory and there’s no final defeat. (Benn, 2009)
Introduction
The study explored in this article used Bourdieu’s concept of the illusio to highlight the continuing advantage and disadvantage of certain groups within the English education system. In late 19th-century England, inequality was openly enshrined in legislation. The Taunton, Clarendon and Newcastle Commissions created separate school systems (and Acts of Parliament) for the upper, middle and lower classes. However, as the 20th century progressed, this openness disappeared, to be replaced with post-war notions of meritocracy and equal opportunity. However, the findings of this study suggested that while openness receded, inequality remained and flourished. Certain groups continued to be disadvantaged and their disadvantage was sustained by the same illusio that fuelled the tripartite system (the post-war UK three-tier system of secondary schooling based on the results of an examination taken at the age of 11). This article examines how the study used quantitative techniques to show that this illusio exists and continues to operate within the field.
This single-school study followed the tradition of Hargreaves (1967), Lacey (1970) and Ball (1981), but with one key advantage: the ability to deploy computerised statistical analyses, enabling a depth of data interrogation unavailable to its predecessors. Particularly, exploratory factor analyses (EFAs) were used to create accurate and field-specific cultural and economic capital student profiles, and measures of student and practitioner perceptions generated from combinations of thematically linked variables.
Study design
The setting and case
This quantitative case study was located in a mixed-gender non-selective comprehensive school (for 11–18 years-olds) in an economically disadvantaged area of a medium-sized English city. The city, once a thriving centre of heavy industry, is increasingly reliant on lower-paid service sector employment. The school, although rebuilt and rebranded in 2008, had served the area for many years and many students had parents, and even grandparents, who had attended the school. With just over 800 students (including 100 at post-16), it was expanding, with larger cohorts in the lower years. According to an inspection shortly before this study, it was a ‘good’ (but not ‘outstanding’) school, with a strong focus on pupils’ personal development. The inspection highlighted challenges: the numbers of students with special educational needs and from poorer backgrounds were considerably higher than the UK average. Furthermore, the English indices of deprivation (covering employment, income, housing, crime and education) suggested high levels of disadvantage around the school (Department for Communities, 2010). Where 100 represents the most advantaged locality in England and zero the least, the catchment area had a mean rank of 12.9.
The case was a Year 7 cohort (78 boys and 78 girls aged 11–12) and their teachers/pastoral managers during the students’ first year at the school. This marked a time of transition for the students. They came from several smaller primary schools where they were mostly taught by a single class teacher, to one larger secondary school where they were taught by different teachers for each subject.
Data collection overview
The study examined the students’ self-reported attitudes to school and the practitioners’ perceptions of the students’ attitudes and behaviours in school. Data on attainment was deliberately not used. Student attitudinal questionnaires were collected at two time points: at the end of the students’ first half-term in school and one year later. At the first time point, the students were in mixed-ability classes. However, shortly afterwards, they were placed into ability groups. A questionnaire to assess the students’ cultural and familial economic capital was administered midway through the year.
The practitioners’ data was collected via detailed questionnaires from pastoral managers, a single-question-form tutor survey on conformity to the school ethos, and teacher-awarded motivation grades. The teachers awarded termly motivation grades to each of their students. The grades used were collected at roughly the time of the first student attitudinal questionnaire and at the end of the year. Additional data included detention logs, classroom behaviour logs and attendance figures.
The study explored the following key questions: Did the practitioners view some groups of students more negatively than others in terms of their attitudes to school and learning? How did the perceptions of the practitioners compare to students’ self-reported views on their attitudes to school? And what was the role of the illusio in sustaining advantage and disadvantage?
Ethical issues
As a participant observer who had taught in the school for five years, the researcher was able to collect detailed data from the students and practitioners, and had access to a wide range of school-held secondary data. However, as this data was used to create socio-economic profiles, there were ethical issues. These were fully discussed with the head teacher, who was both the gatekeeper and, as suggested by the British Educational Research Association (2011), sponsor of the study. The British Educational Research Association (2011: 6) highlights Article 3 of the United Nations Convention on the Rights of the Child, suggesting that ‘in all actions concerning children, the best interests of the child must be the primary consideration’. The head teacher agreed that research to improve practice was in the best interests of the students. He wrote to parents outlining the broad aims of the research, allowing them to remove their children from the study and offering an opportunity to discuss it further with the researcher. No parents removed their children from the study, but one parent discussed it with the researcher.
Two specific issues were resolved with the head teacher: the collection of sensitive socio-economic data and the mechanics of confidentiality. Importantly, because the researcher was a teacher in the school, and therefore already had access to student socio-economic data (e.g. ‘free school meals’ (FSM) status, location of the family home, parental residence), the data collected for the study was seen as an enhancement of the current data. It was agreed to avoid questions directly referring to social class or parental/familial earnings. The students were briefed on the broad aims of the study, and it was stressed that they did not have to answer questions with which they were not comfortable. The student questionnaires were administered during class time with two members of staff present. Just one student chose not to take part. The response rate, therefore, was high (although some students chose not to answer certain questions).
The mechanics of confidentiality presented some problems. Although the study compared practitioners’ perceptions of groups of students rather than individuals, some students were in several groups, and the study needed to link individuals to the data provided by the practitioners. Therefore, there were limitations on anonymity. The students did not write their names on the questionnaires, but each questionnaire was coded so that the researcher knew the identity of the respondent. After the student-reported data was matched with the practitioners’ data, the students’ names were erased. The key to making this ethically acceptable was that it was sanctioned by the head teacher (sponsor), using his knowledge of the researcher as an employee and his in loco parentis authority.
The concept of the illusio
In order to examine the nature of the illusio, we must first look at its context within a field. Basing their discussions of ‘field’ on the work of Bourdieu and Wacquant (1992), many writers (Dumais, 2002; Husu, 2013; Warde, 2004) see a field as more than a geographical location. A field is an arena where the values and capitals of different groups are placed and traded in relation to one another. It is both geographical and the values, qualities and norms developing within the geography. And, as Warde (2004) observed, fields are characterised by both their present and their past. The relative positions of people, the currency of different capitals and the dominant voices have been, and continue to be, refined over time.
Bourdieu (1996: 215) characterises a field as a place of conflict around a struggle for supremacy concerning ‘the degree to which its own norms and sanctions manage to impose themselves on the ensemble’. However, Bourdieu describes this in terms of a game rather than armed combat, sleight of hand rather than force of fist. The game – or perhaps we might say ‘trick’ – is sustained by what Bourdieu (1996: 231) terms ‘the illusio’. Every field, he notes, has ‘its specific form of the illusio’ (231), in which there is collective belief and participation. This collusion is endorsed, legitimised and sustained by fetishism – the practices, actions and capitals whose values exist only inasmuch as they are recognised and accepted by those within the field.
Lupu and Empson (2015) used the concept of the illusio when exploring why professional accountants routinely agreed to overwork. The illusio is not the actual values and practices of the game, but the mechanism that ensures ‘an unreflexive commitment to reproducing and enforcing the rules of that game’ (Lupu and Empson, 2015: 1312). The illusio, according to Lupu and Empson, is not about persuading individuals to support values and practices. Rather, it is about enforcing a recognition of supremacy. For the accountants, the illusio controlling their field meant that ‘in spite of their levels of experience, success, and seniority, these professionals describe themselves as feeling helpless and trapped, and experience bodily subjugation’ (1312). Interestingly, it was noted that as the accountants improved their status within the field, they became less inclined to question the game’s legitimacy.
Warde (2004: 14) suggested that the identification of a field’s features is not particularly clear and ‘ultimately it is just what the participants take it to be’. In that sense, it is somewhat arbitrary and, in pragmatic terms, the researcher must become the arbiter, laying out the field’s parameters for the purposes of their research. As Dumais (2006) affirmed, for Bourdieu, the school system itself (and even Habermas’s Bildungssystem) may be regarded as a field. However, tighter foci were chosen for this study. Firstly, the school as a place of learning was examined through the context of the classroom and, secondly, the field encompassed social competence examined through the students’ relationships with staff and peers in both the classroom and the wider school context.
It is interesting here to compare Lupu and Empson’s (2015) illusio in a long-established profession with that of public service interpreters, a relatively new profession. Colley and Guéry (2015) found that the illusio of public service interpreters was not fully established. Without a history, it was neither fully defined nor fully accepted within the profession, leaving it open to interpretation and even challenge. However, Lupu and Empson’s illusio had the strength of history; legitimacy was embedded. This distinction is important in understanding the field discussed in this study, which was well established and, one would expect, resistant to serious challenge.
This study, then, explored how, within the selected field, the illusio successfully sustained a set of norms (made up of values and practices) and whether this resulted in advantage or disadvantage for certain groups. The study also sought to expose how these norms, advantages and disadvantages sat within the historical context of English schooling. Were they, as we might expect, resistant to change and challenge?
The role of exploratory factor analysis
EFA was a key tool for both creating independent variable profiles and the interpretation of dependent variables. Firstly, it enabled dimension reduction – the creation of single variables (factor scores) from collections of variables, even where some variables used different scales. Secondly, the factor loadings (see Tables 1–5) highlighted the comparative influence of different variables. And thirdly, it had an exploratory function, grouping together correlating variables to create a single thematic score. The factor scores, then, were teams of variables where each variable played a part, but some were more important than others.
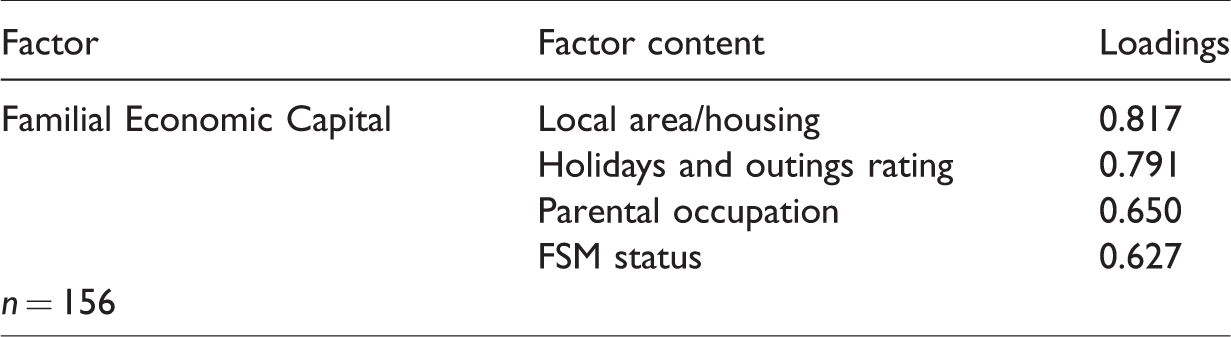
Factor loadings for ‘economic capital’ profiles.
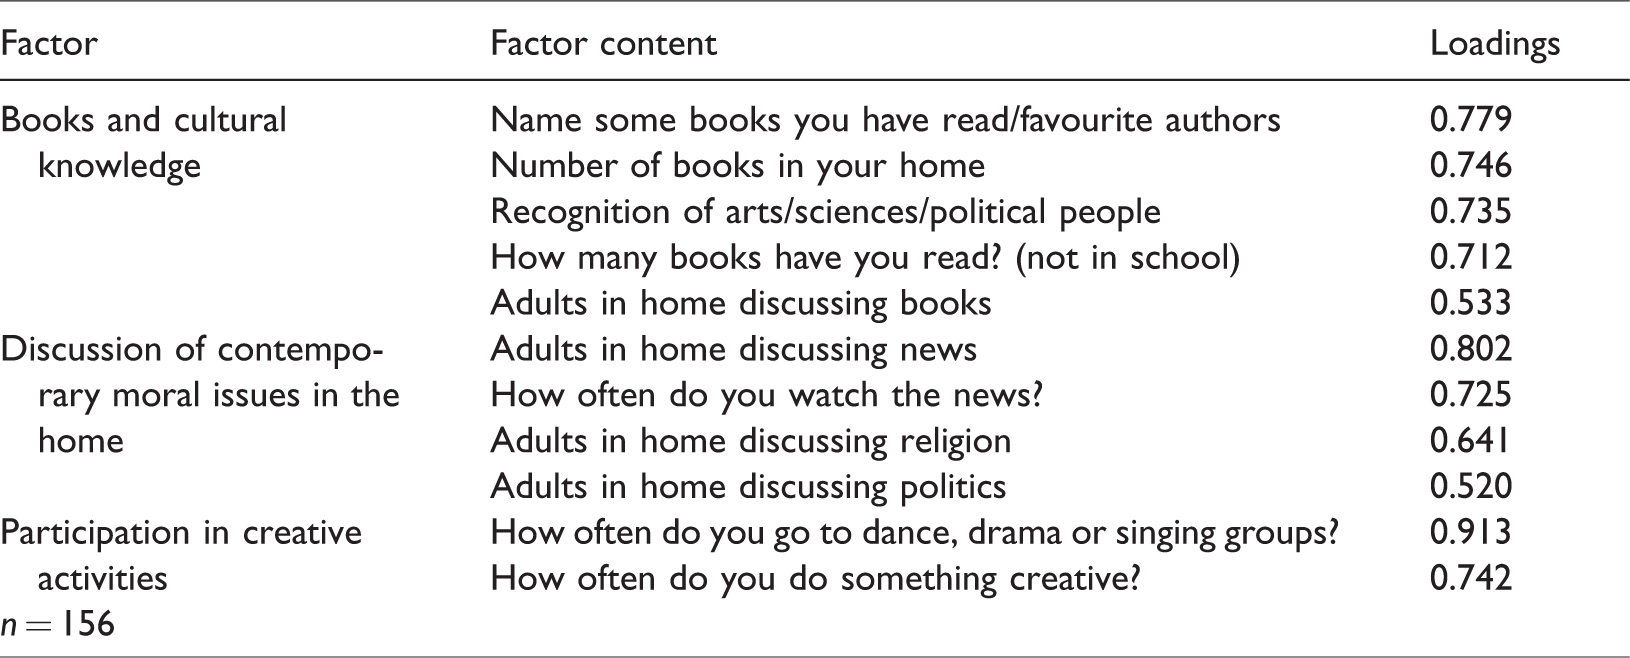
Factor content and loadings for student self-reported cultural capital.
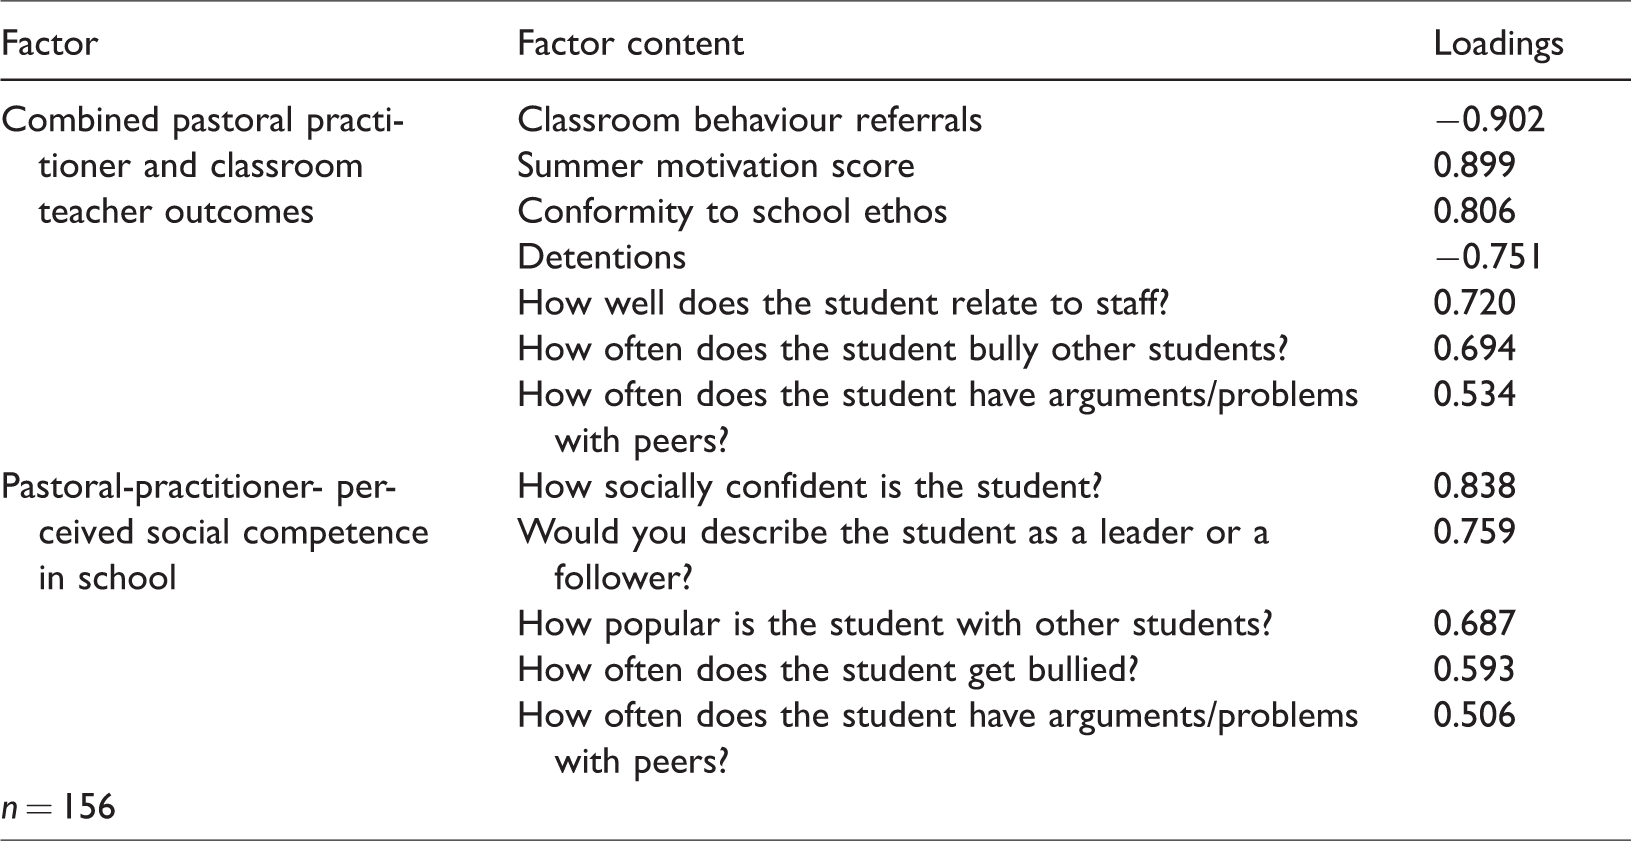
Practitioner-generated factor scores.
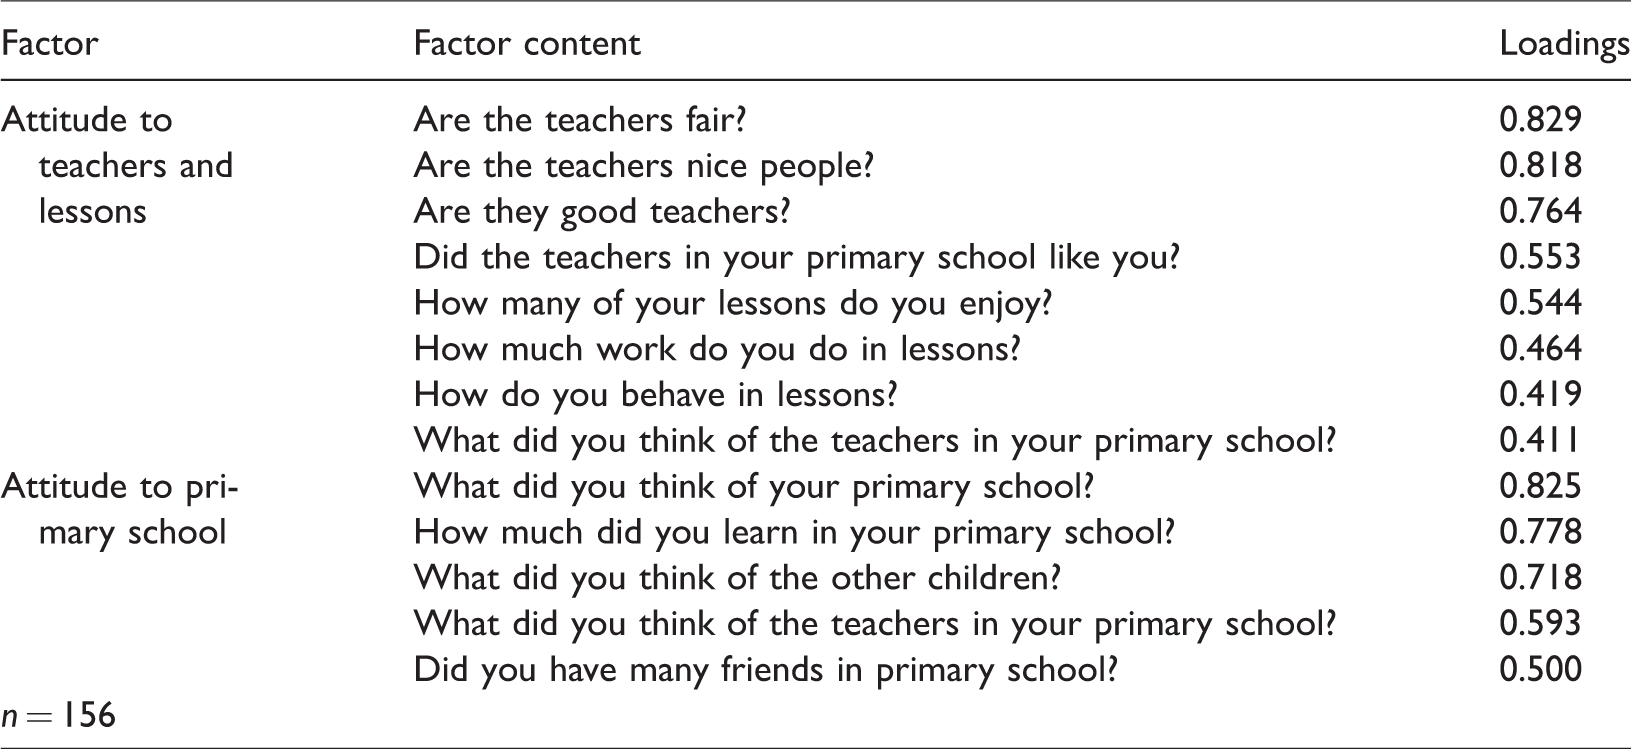
Initial student-generated factor scores.
Student-generated factor scores post-first year.
Various procedural decisions were required (including type of rotation, factor or principal components analysis, minimum number of variables and factor retention) and there are useful discussions on this in Field (2009), Costello and Osborne (2005) and Kootstra (2004). However, this section will focus on the basic principles and interpretation of the factor analyses.
Thematically linked variables were identified for analysis. The number of variables in each group ranged from 7 to 25. The EFAs detected which variables within each group correlating highly with each other. These were put together to provide a factor score for each student. Variables that did not highly correlate with other variables were disregarded. The factor scores range from 1 to -1 and the mean score is always zero. So, students from comparatively wealthy backgrounds would have positive ‘economic capital’ factor scores, while students from poorer backgrounds would have negative scores. The factor scores are not absolute but related to the other scores in the analysis. Thus, a student with a score of 0.56 in a school in a poorer area might only score -0.12 in a more affluent school.
However, EFAs did more than simply generate factor scores. They also uncovered the relative influence of the different elements making up the factor scores by calculating factor loadings for each variable. These loadings range from zero to 1 and, as Field (2009) advises, this study ignored variables with a factor loading of < 0.4 (note that, in some cases, the factor loading may range from zero to -1, in which case loadings between zero and -0.4 are ignored). Put simply, the further from zero the factor loading is, the more influential the variable is on the factor score. In Table 1, we see that while FSM status had some effect on the ‘economic capital’ factor score, it was less influential than the ‘local area/housing’ variable. And while 10 variables were initially selected for analysis, 6 did not correlate highly with any other variables, leaving the 4 shown in Table 1.
Sometimes, an EFA creates more than one factor score. Table 2 shows that three distinct cultural capital types were detected (books and cultural knowledge, discussion in the home and participation in creative activities), and a factor score was created for each. EFA, then, enabled the study to assess how different variables worked together, and highlighted aspects and characteristics of the forces operating in the field – something which will be discussed in more detail below.
Independent variables
The independent variables used to group the students were in two categories. Firstly, there were those drawn from school-held data: gender; ethnicity; special educational needs/others; English as an additional language/others; and ability groupings (mathematics, English, all top set/others). There were three ability groups for mathematics and four in English.
The task of grouping the students by familial economic capital and possession of cultural capital was more complicated. Pre-21st-century research often used blanket terms in keeping with the scholarship of the time (e.g. ‘middle class’, ‘working class’ or ‘lower class’). However, in creating economic and cultural capital measures, this study accepted as a guiding principle Savage’s (2003: 536) call for ‘a much more subtle kind of class analysis, a kind of forensic, detective work, which involves tracing the print of class in areas where it is faintly written’.
Familial economic capital
Certainly, the tendency to use convenient socio-economic measures such as FSM data is flawed. FSM entitlement, frequently used in UK government statistics (e.g. Department for Education, 2014), is a means-tested benefit allowing children free school lunches. Hobbs and Vignoles (2010) highlighted the widespread misconception that FSM figures are based on eligibility, when, in fact, they are based on claimants; eligible non-claimants are not recorded. Furthermore, entitlement rules often change, with some families drifting in or out of FSM figures through choice or circumstances. A more robust economic profile was generated (using EFA) from 10 variables (including FSM) to create high, middle and low groups for familial economic capital.
Like FSM, other variables feeding into the profile had flaws. However, collectively, they provided a multifaceted measure where individual flaws were minimised. When scoring the variables, a higher number indicated higher economic capital. Thus, FSM scored 0 while non-FSM scored 1. Eight variables came from the student questionnaires. The students commented on their attendance at the cinema, sporting events and concerts (‘Often’, ‘Quite a bit’, ‘Sometimes’, ‘Hardly ever’ or ‘Never’ – scoring 5 to 1, respectively). ‘Resident parents’ was scored as 3 for mother and father, 2 for mother/father and step-parent, 1 for mother or father, and 0 for no parents. ‘Parental occupation’ (the highest status of either parent) was rated from 0 (unemployed) through to 5 (managerial/professional), using the UK’s Office for National Statistics (2010a, 2010b) suggestions and guidance from Erikson and Goldthorpe (1992), Rose and Harrison (2007), and Rose and Pevalin (2010). ‘Siblings’ was rated as 4 for no siblings, 3 for one sibling, 2 for two siblings and 1 for three-plus siblings. ‘Car ownership’ (1 to 5) assessed the number, age and status of cars in the household (consulting the Auto Trader Used Car Directory). Similarly, ‘Holidays’ (1 to 5) were rated by frequency, duration and location. Finally, using postcodes, site visits and the researcher’s local knowledge, each student was given a ‘Local area assessment’ score (1 to 4) covering housing quality; the cleanliness and attractiveness of the street/road; communal areas (roads, pavements, grass verges, etc.); and safety and security (including traffic, proximity to shops/commercial premises and lighting).
Table 1 shows that 4 of the 10 variables correlated highly, creating an ‘economic capital’ factor score. Using split points in the factor scores, low, middle and high socio-economic groups were created. It should be noted that these groups did not represent wider society. Given the location of the school, it would be fair to say that they represented three groups within what may previously have been labelled ‘working-class’ families.
Cultural capital
Dumais (2006) suggested that there is a lack of consensus on what is meant by ‘cultural capital’. Vryonides (2007) listed the use of reading, beaux-arts participation, cultural or highbrow activities, and visits to cultural sites or events (art galleries, historical properties, concerts, etc.) as cultural capital measures. It is, perhaps, useful to think of these as neither right nor wrong. Instead, researchers should recognise that just as a field is localised, the capital within it is also localised. It is a fluid rating that is changed by time and place. Nijinsky’s controversial choreography for The Rite of Spring (Chua, 2007) demonstrates how yesterday’s edge becomes today’s mainstream. Rushdie’s The Satanic Verses – art for some and anathema for others – exposed how cultural values vary from one field to another (Fowler, 2000). Choi (2014: 56) gives a good example of how capital can construct gateways to privilege when describing English as the ‘official currency’ for public service careers in Hong Kong. Possession of the English language, in that context, provides power and enables domination. Discussions of cultural capital, then, must examine what currently passes for cultural capital in a particular place and time.
When planning the cultural capital measure, this study considered the analysis of Davies et al. (2014: 806), which asked ‘whether cultural capital is best understood as a single construct or as a set of loosely aligned, distinct, constructs’. It was a question prompted by the identification (from previous studies) of three cultural capital dimensions: attitudes and interests, cultural knowledge and language fluency. And, straddling these were three areas of ‘activity focus’: highbrow/beaux arts, scientific-technical and media-oriented framing, and parent–school interaction. Certainly, many researchers (Sullivan, 2001; De Graaf et al., 2000; Lareau and Weininger, 2003) have long since moved away from the narrow beaux-arts-based definitions suggested by DiMaggio (1982: 191), who stated: ‘I measure high school students’ cultural capital using self-reports of involvement in art, music, and literature’. Furthermore, Sullivan (2007) noted changing tastes and evolving social technologies blurring consensus in defining the beaux arts. It was suspected (rightly, as it turned out) that a narrow beaux-arts measure would not highlight differences within this study’s cohort. So, a decision was made to begin with ‘a set of loosely aligned, distinct, constructs’, and to analyse them using EFA.
This was done by using a questionnaire that included the wide range of topics mentioned by Vryonides (2007). Twenty-five variables were created, with higher scores representing higher levels of capital. Twenty-one variables asked how often things occurred (‘Often’, ‘Quite a bit’, ‘Sometimes’, ‘Hardly ever’, ‘Never’ – scored from 5 to 1, respectively). These included visits (to the cinema, the theatre, museums and/or art galleries, classical concerts, any concerts and public libraries), activities (dance/drama/singing groups, creative activities, cooking, watching DVDs, listening to classical music, voluntary work, using the Internet for study, using the Internet for non-gaming activity, watching the news and reading non-school books) and talk in the home with adults about politics, education, books, religion and the news. The students estimated the number of books in their home: 0 = < 10; 1 = 10–25; 2 = 1 bookcase (25–100); 3 = 2 bookcases (101–200); 4 = 3 bookcases (201–300); 5 = 4 bookcases (301 upwards) or more. Playing a musical instrument was rated as: 0 = Don’t play; 1 = Play/no teacher; 2 = Non-orchestral instrument (drums, guitar, keyboard, etc.)/with teacher; 3 = Orchestral instrument or piano/with teacher. Favourite books or authors were assessed and, with advice from the English department, scored as: 0 = None; 1 = 1 book or author; 2 = 1 book and 1 author/2 books and 2 authors; 3 = as previous, including 1 high-quality title/author; 4 = as previous with more than one high-quality title/author. Finally, the students were given a list of 18 cultural figures (Barack Obama, Pablo Picasso, Judi Dench, Albert Einstein, Beethoven, Shakespeare, Joseph Stalin, Charles Dickens, Stephen Hawking, Wendy Cope, L. S. Lowry, Marie Curie, J. S. Bach, Margaret Thatcher, Colin Firth, Jane Austen, Claude Monet and Chopin) and asked to link them with one of the following categories: Politics, Music, Sport, Writing, Art, Acting and Science; they were given a point for each correct response.
Of course, it is accepted that there was a certain degree of subjectivity, and indeed guesswork, in compiling these variables. Nevertheless, as Table 2 shows, the selection was fit for purpose inasmuch as it generated three cultural capital scores: ‘Books and cultural knowledge’, ‘Discussion in the home’ and ‘Participation in creative activities’. ‘Books and cultural knowledge’ was adopted as the main cultural capital profile because it was the one that highlighted the most significant differences in the practitioners’ perceptions of the students. Certainly, this output measure was broadly in line with studies by Sullivan (2001) and De Graaf et al. (2000) linking reading, rather than beaux-arts elements, with classroom success. Indeed, four of its five most influential variables (Table 2) were directly associated with books.
Dependent variables
The dependent variables for this study fell into two broad categories: the students’ self-reported attitudes and the practitioners’ perceptions of students. A few variables were considered robust enough to stand alone, but others were used in EFAs.
Practitioners’ perceptions of students
The students were given a motivation grade by each of their 12 subject teachers every term. The grades used were awarded in the week before the first half-term of the year and at the end of the year. Grades of 1–6 were awarded, with 6 being the highest motivation score. Grades 4–6 constituted 94% of all grades and the mean was 5.2. Each student’s initial and final mean grades were calculated from their 12 scores, and they were taken to represent a corporate perception of each student’s motivation.
Other secondary data included the detention log, which recorded the number of minutes spent by each student in formal after-school detention (not informal short detentions). Additionally, the classroom behaviour referral log recorded scores of 1 (first warning), 2 (second warning), 3 (detention) and 4 (referred to head teacher), which were added up for each student at the end of the year.
A single question – How well does the student conform to the ethos and values of the school? – was answered by each student’s form tutor and scored from 1 to 5, with 5 indicating the highest level of conformity. The pastoral managers scored each student on the following items:
Popularity with other students Relationships with staff Arguments/problems with peers Leadership qualities Social confidence Getting bullied Being a bully Positive/negative attitude to school
All scored from 1 to 3, with 3 being the most positive. Questions 2 and 8 were also used as single-variables questions.
Table 3 shows that two useful factors were generated. It is interesting to note that the highest two loadings in the combined pastoral practitioner and classroom-based scores were classroom behaviour referrals and classroom motivation grades, raising the possibility that the teachers were not discriminating between the two. Nevertheless, the eight variables represented a spread of both the teachers’ and the pastoral practitioners’ perceptions, suggesting that both sets of practitioners perceived students along broadly similar lines.
The second outcome reflected social competence. Perceived confidence, leadership and popularity were the most influential qualities, suggesting that the practitioners’ judgments of social competence were influenced by their perception of students’ attributes rather than their perceived problems.
Student’s self-reported attitudes to school
The students’ self-reported data was collected via an initial attitudinal questionnaire. Twenty-one questions were scored from 1 to 5, with 5 being the most positive. Questions 1–6 covered attitudes to primary schools (teachers, lessons, friendships, general rating). Thirteen questions about their new school covered teachers, lessons, pastoral care, homework, uniform and an overall school rating. A year later, a second questionnaire repeated all the secondary school questions and added questions about ability groupings. Two variables were used as stand-alone data at both time points: ‘How do you rate this school?’ and ‘How do you rate your behaviour in lessons?’
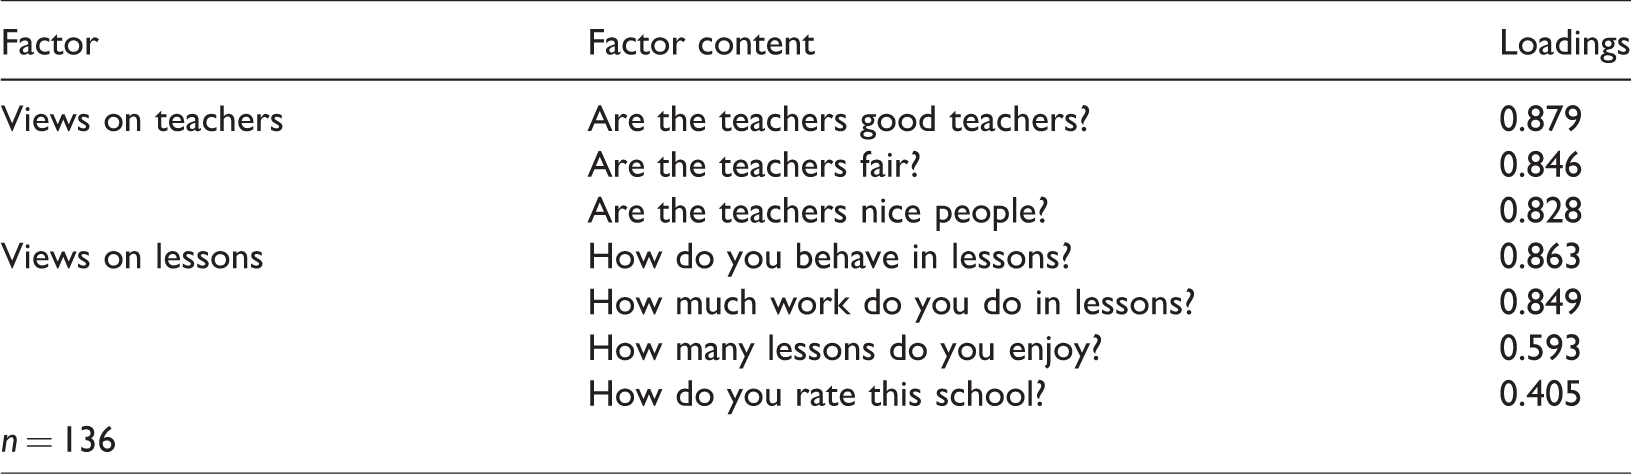
The EFA (Table 4) from the initial attitudinal questionnaire generated two ratings: attitude to teachers and lessons and attitude to primary school. Table 5 shows the factor analysis run with the end-of-year data. This demonstrated a change in the students’ thinking, as the students were beginning to separate their views on teachers from their views on lessons.
Other statistical procedures
The bulk of the findings were comparisons of means between the different groups of students using independent t-tests for dichotomous categories and one-way ANOVAs for multi-group categories. Significant results (p < .05) were interpreted using effect size (Cohen’s d). Gabriel’s, Bonferroni’s and Games-Howell’s procedures were the post-hoc tests used for pairwise comparisons.
Findings and discussion
The English education system established at the end of the 19th century was divided on class lines. And, as many studies have shown (Floud and Halsey, 1957; Jackson and Marsden, 1962; Lacey, 1970; Willis, 1977; Ball, 1981), this continued through the 20th century. Jackson and Marsden (1962) particularly highlighted that class divisions were both economic and cultural. These divisions were legitimised and sustained through the mechanisms and forces within the illusio. The findings of this study suggested that this legitimisation and sustenance continue into the 21st century.
The emergence of an elite capital-rich group
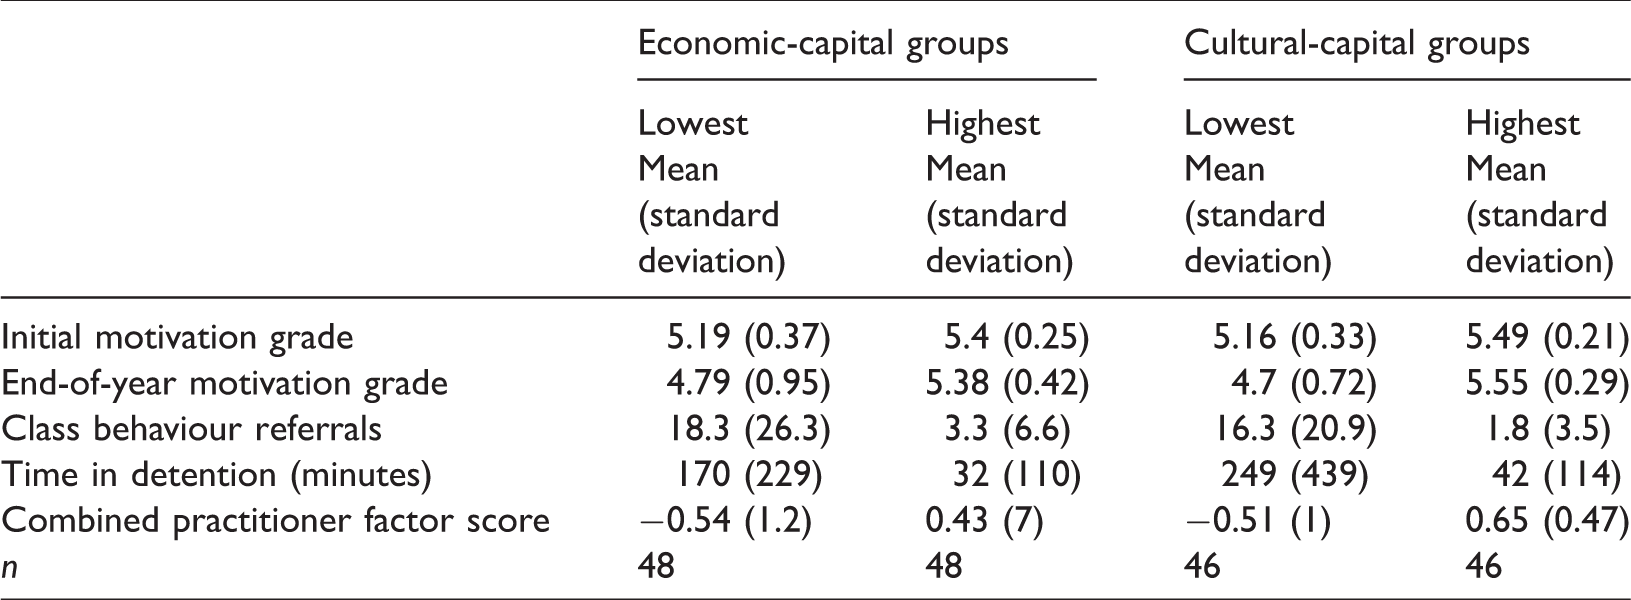
The practitioners quickly viewed lower-capital students less positively than others. Table 6 shows students from a poorer background having lower initial teacher-perceived motivation than others (F(2,142) = 7.22; p = .001). And it was similar for lower-cultural-capital students (F(2,137) = 18.42; p < .001). By the end of the year, these differences had grown for both economic capital (F(2,142) = 9.32; p < .001) and cultural capital (F(2,137) = 28.82; p < .001). Furthermore, the practitioners were having disciplinary issues with lower-capital students, with six times as many behaviour referrals for the lowest economic group compared to the highest (F(2,142) = 9.55; p < .001). For the lowest and highest cultural-capital groups, the difference was eightfold (F(2,137) = 9.47; p < .001). And there was a fivefold difference for detention time between the lowest and highest groups for both economic (F(2,142) = 7.644; p = .001) and cultural capital (F(2,137) = 3.76; p = .03). Finally, Table 6 shows, through the combined practitioner factor score, that lower-capital students were viewed more negatively than others on a range of indicators, including behaviour, motivation and conformity to the school ethos. And these differences were large for economic groups (F(2,142) = 13.99; p < .001) and cultural-capital groups (F(2,137) = 23.18; p < .001).
Practitioners’ perceptions of high- and low-capital groups.
It is worth noting here that the students in higher economic groups also possessed higher levels of cultural capital (F(2,137) = 15.17; p < .001), with large differences between the top and the lowest (d = 1.65), and the top and the middle groups (d = 0.9). And it quickly became apparent that the school was facilitating the formation of an elite group from these higher-capital students.
Shortly after the initial motivation grades were awarded, the students were put into ability groups. Forty-three students (28%) were placed in the top sets for both mathematics and English (and because of timetabling practices, effectively for all subjects). They made up the majority of the top-set students (83% for English, 77% for mathematics) and possessed considerably more capital than others. But the difference for cultural capital (t(152) = 5.43; p < .001; d = 1.02) was larger than for economic capital (t(152) = 3.83; p < .001; d = 0.71). They shared all of their lessons, operating largely within their own exclusive stratum.
As Table 7 shows, these elite students were consistently viewed by the practitioners as more positive than others. This was apparent (as the initial motivation grades show) before the students were grouped by ability. And at the end of the year, this preference continued. There were significant differences between these top-set students and others for practitioner-generated measures, including conformity to ethos, relationships with staff and general attitude to school. In every case, the elite students were perceived more positively than others.
All top sets and others: practitioner perceptions.
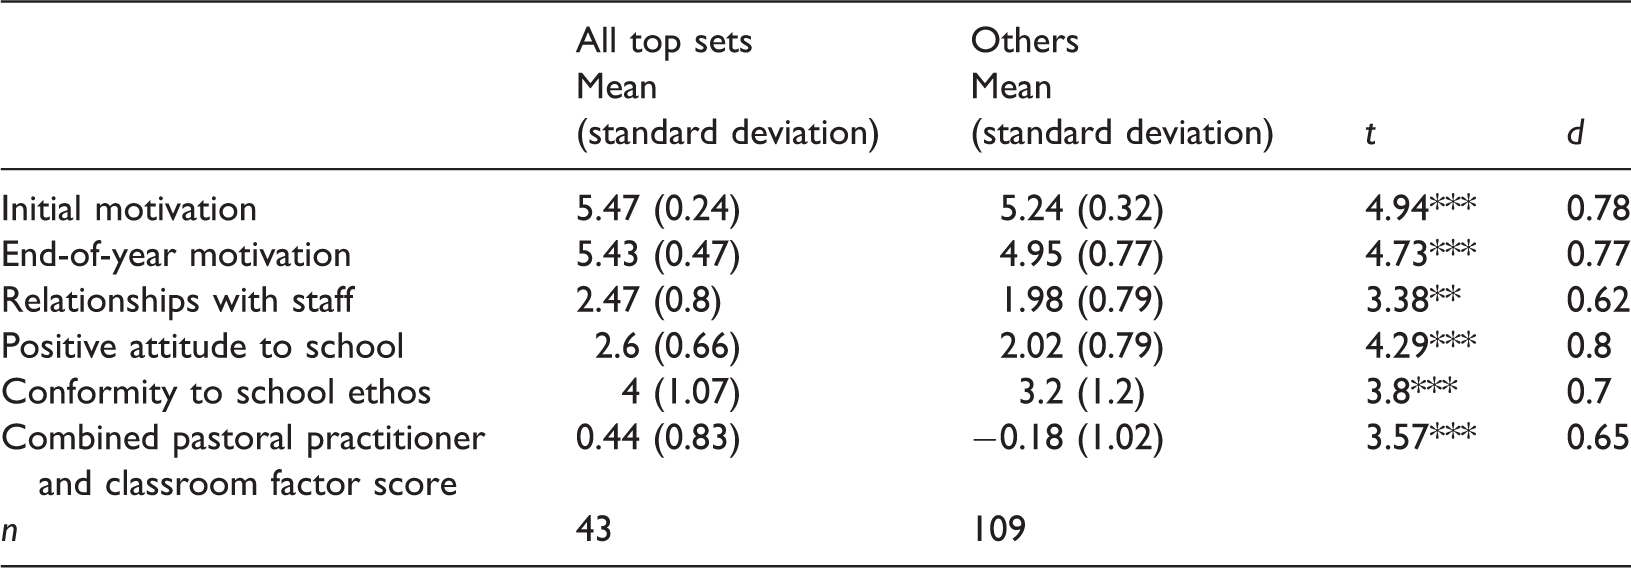
**p < .005; ***p <. 001
What we see, then, is that in spite of a raft of surface changes in the organisation and character of English schooling’s infrastructure, divisions based on social class remained intact. And the differentiating characteristics continued to be an economic and cultural blend. However, this study suggested that the divisions were supported by people, their perceptions and institutional practice. In 1870, segregation was sanctioned through separate Acts of Parliament for different social groups. In 1944, there was a single education act, but segregation was maintained by using different institutions: middle-class-dominated grammar schools and secondary moderns for those without the cultural or economic clout to go elsewhere. The demise of this tiered system, and the dawn of comprehensive schools, coincided with what Allen (2012: 10) calls ‘the rise of complexity’. Allen describes the breaking down of old systems and the emergence of new ones for ‘the apparent disorder of a more chaotic and indeterminate world’ (11). But in spite of this ‘apparent disorder’, the 21st-century school in this study demonstrated that where division by statute or school type is absent, social segregation is facilitated by institutional organisation aligned to practitioners’ perceptions of different groups. This suggests that the sustaining force is not in the types of school we have – it is within people, their perceptions and their practice.
Students’ self-reported attitudes to school
The students’ self-reported responses painted a very different picture to the perceptions of the practitioners. Before the creation of the elite group, there were no significant differences between the all-top-set students and others for the attitudes to primary school or views on teachers and lessons factor scores. Furthermore, there were no significant differences for self-assessed behaviour or general ratings of the school. And one year later, there were still no significant differences for all the self-reported attitudinal ratings.
So, why did these students’ self-reported differences fail to develop? If we consider social identity theory and the resultant differential polarisation discussed in Kelly (2009), we would expect top sets to accentuate positive pro-school attitudes and lower sets to accentuate negative anti-school attitudes. Certainly, the practitioners were suggesting this was the case. Also, non-top-set students were less satisfied with their set placements than the elite group (t(152) = 3.41; p < .005; d = 0.65) and spent over three times as much time in detention (t(152) = 2.82; p < .05; d = 0.38). One might expect, then, that the non-elite students would develop negative self-reported attitudes to the school compared to the elite students. However, for the most part, this simply did not happen.
The differences in initial self-reported attitudes to school between both higher and lower socio-economic and cultural-capital groups were also generally small. There were no significant differences between any groups for attitudes to primary school, initial ratings of teachers and lessons, or overall ratings of the school. For self-assessed classroom behaviour, there was a moderate difference (d = 0.6) between the highest and lowest cultural-capital groups (F(2,135) = 4.24; p = .02). But this apart, the possession of economic or cultural capital made little difference to students’ attitude to school at the start of their secondary education.
However, the self-reported post-first-year data hinted that lower-capital students were noticing deficiencies in their provision. The attitudes-to-lessons factor score suggested that they were less satisfied with their lessons than others. The difference was moderate (d = 0.69) between the highest and lowest economic-capital groups (F(2,133) = 4.47; p = .01) and somewhat smaller (d = 0.52) between the highest and lowest cultural-capital groups (F(2,130) = 3.45; p = .04). But in spite of this emerging dissatisfaction with lessons, lower-capital and poorer students remained just as positive towards their teachers and in their overall ratings of the school as their higher-capital peers.
Nevertheless, this emerging difference suggested that some students were getting a better quality of education than others. While the students with the least capital were noticing deficiencies in their lessons, the teachers were adamant that these students were less motivated than others in the classroom. But the students’ self-reported data suggested that this perceived lack of motivation was not student-generated. One has to consider the possibility that the teachers were interpreting a dissatisfaction with lessons that were not geared to students’ needs as a lack of motivation – a deficit-model approach locating the problem within the students rather than within the school provision.
Another possibility was the presence of misrecognition – that the students who were getting a poor deal did not locate responsibility for it with their teachers or the school. Bourdieu used the term méconnaissance. Terdiman (1986: 813), a respected translator of Bourdieu’s work, interpreted méconnaissance as ‘induced misunderstanding’, made possible because dominant stakeholders control ‘the language through which those subjected comprehend their domination’. Just as the practitioners failed to recognise that lower-capital students were no less positive towards school than others, the lower-capital students failed to ascribe unsuitable lessons (and the associated lower teacher-perceived motivation and higher incidence of classroom behaviour referrals) to poor teaching or poor overall school provision. They did not blame the teachers or the school for the quality of their provision. This begs the question: What forces sustained this induced misunderstanding?
Values and mechanisms and the illusio?
Certainly, it would seem that within the field in this study, the illusio was sustaining a set of norms, and those norms were imposed on everyone within the field. The practice of segregating an elite, enshrined in law in 1870 and maintained in the grammar school system in the 20th century, was clearly sustained in this 21st-century comprehensive school. The suggestion that this segregation should be based on perceived ability, and that this is acceptable, also appears to have been sustained. This study did not tell us the practitioners’ views on ability grouping, but it did tell us that lower-capital students did not have a poorer view of their school than others, even though they were less happy than others with their ability groups and their lessons. If they did not blame the teachers or the school for this dissatisfaction, who is left? One must conclude that they blamed themselves for not being able to digest and understand the fare on offer.
The norms discussed above may be considered as part of a potent aspect of the illusio, an aspect perhaps acting on students from their entry into formal education – that schools know what they are doing and their practice should not be challenged. And while practices and pedagogies may come and go, the hierarchical forces in schools can be traced back many decades; head teachers, their deputies, department heads and class teachers are invested with long-established authority which, although it may be disputed in individual cases, is rarely collectively challenged. The illusio in this study, then, was mature and, like that described by Lupu and Empson (2015), difficult to resist.
The views of the students suggested a collective belief in the legitimacy of practices such as selection by ability. However, it is unlikely that either the practitioners or the students would endorse segregation by socio-economic status. Indeed, Dunne and Gazeley (2008)Dunne highlighted the reluctance of teachers to employ social class labels when discussing pupils. But they also found clear patterns in teachers’ comments on pupils from different backgrounds: poorer students were characterised by problematic family traits, while better-off students were portrayed in terms of positive family support. Dunne and Gazeley found an absence of open identification alongside an abundance of stereotyped expectations and aspirations. Certainly, this study demonstrated that the practice of segregation by socio-economic background, albeit unconscious, is not a thing of the past. Although the practitioners in this study may have believed that they were personally committed to equality and inclusion, the mechanisms of the illusio were too strong to be overridden. The values, attributes, knowledge and behaviours that underpinned the institutional definitions of ability clearly favoured students who possessed certain types of capital. In segregation by ability and segregation by social class, we have a neat example of power in a visible and invisible form (Bang, 2014), where the acknowledged and the unacknowledged are equally potent.
This potency sustained a collective belief that institutional authority was not open to question, leading to Lupu and Empson’s (2015) ‘unreflexive commitment’ to current values in the field. Interestingly, the students with lower capital were responding to deficiencies in their lessons (as evidenced by the higher number of classroom behaviour referrals they were getting). But crucially, the illusio’s ability to legitimise practice meant that they did not interpret this response as a reaction against poor practice. In other words, alongside an ‘unreflexive commitment’, there was an unreflexive response that did not dispute the authority or correctness of the school or its teachers. Russell (2016), in a discussion on unemployed young people, discussed a similar scenario. She found that the subjects in her study, like the poorer students in this research, did not reject societal norms, but had to ‘negotiate domineering structures that position them as unemployed, lazy and welfare-dependant’ (Russell, 2016:165). However, while the young adults felt that these labels did not apply to them, they frequently applied them to others in a similar position. Like the lower-capital students in this study, they could not reject the collective belief of the illusio.
It must be concluded that the illusio was working effectively in the field. The data highlighted the comparatively negative attitudes of the practitioners towards students with lower levels of economic and cultural capital. And yet, these differences were at odds with the attitudes reported by the students themselves. The grouping practices within the field facilitated the creation of a capital-rich elite group taught in their own bubble and viewed by the practitioners as more positive towards school than other students. Again, this perception did not tally with the students’ self-reported views. Finally, in spite of these things, and the fact that the lower-capital and poorer students were beginning to question the quality of their lessons, the lower-capital and poorer students remained just as positive towards their teachers and in their ratings of the school as their wealthier and higher-capital peers. The illusio, it seems, continued ‘reproducing and enforcing the rules’ (Lupu and Empson, 2015: 1312) to maintain advantage for certain groups and disadvantage for others.
Footnotes
Declaration of Conflicting Interests
The author declared no potential conflicts of interest with respect to the research, authorship, and/or publication of this article.
Funding
The author received no financial support for the research, authorship, and/or publication of this article.