
Abstract
The goals of this study were to investigate the effect of cough-jet on local airflow and contaminant transport in a typical cabin environment by using computational fluid dynamics. A fully occupied airliner cabin section was employed as the computational domain. Contaminants were released through coughing passengers from different locations inside the cabin. Numerical results in terms of contaminant transport characteristics were examined and compared. It can be concluded that cough-jet has significant effects on air flow in front of cough passenger in a short period of time. Also, it was found that, without considering the cough-jet model, the simulation results could not be a precise representation of the transport and distribution of cough-generated airborne contaminants.
Introduction
As more than two billion people are travelling in commercial flights each year, 1 a great concern on the inflight infection disease transmission has been raised. During the global outbreaks of tuberculosis, severe acute respiratory syndrome and swine influenza, the risks of airborne infection spread among the passengers inside aircraft cabins were found to be very high. 2 In order to effectively minimise the disease desperation in airliner cabin and improve the ventilation performance, computational fluid dynamics (CFD) was utilised as a cost-efficient tool to investigate and identify various affecting factors, such as ventilation scheme, the manikin thermal plume and human activities.3–5
When passengers were coughing, most attentions were drawn to the aforementioned affecting factors, whilst one of the factors that released simultaneously with the contaminants through the coughing process, the cough-jet, was overlooked. Most existing studies assumed the cough-jet were ignorable, 6 as the cough-jet could be quickly damped after release. For instance, Li et al. 7 numerically investigated the airborne contaminant distribution released from one manikin's mouth into a seven-row airliner cabin section. In their study, only contaminants were released through coughing without generating any cough-jet. This was also because that it would require significantly high computational cost to investigate the cough-jet characteristics in a full-scale airliner cabin due to the extreme complexity of the cabin environment. According to Gupta et al., 8 tracking the transport of coughing droplets for 4 min in a seven-row cabin took more than four weeks to complete using a fully operated computer cluster.
On the other hand, the cough-jet even in the first few seconds was considered as an important factor on the local airflow distribution from other indoor spaces. 9 Kwon et al. 10 pointed out that accurate description of the initial velocity distribution from coughing process is particularly important in the study of the fluid dynamics property of the respiratory particles. Their study concluded that only considering the airflow field without the cough-jet may not be an appropriate representation of the transport and distribution of airborne contaminants. By experimentally studying the concentration of contaminants in aircraft cabin during several long-distance flights, Dechow et al. 11 illustrated that the peak concentrations of bacteria can be significantly observed after coughing from the passenger. Gupta et al. 12 also argued that the cough-jet driven by the coughing process should be considered as one of the most important factors in the airborne disease transmission. In airliner cabins, due to the densely occupied environment, cough-jet released by source passengers could break the local airflow not only in their but also in their neighbours' breathing zone. Thus, it is crucial to include the cough-jet when investigating the contaminants transport and distributions through coughing in the cabin environment. However, the overlook of the cough-jet in the cabin environment has not yet drawn enough attention in the existing literature.
Therefore, in this study, the effect of cough-jet on local airflow and contaminant transport was thoroughly investigated in a typical median-size cabin environment by using CFD. A cabin section based on Boeing 737, which was initially used in our previous research, 13 was employed in this study to continuously investigate the cough-jet effect on top of the other important studied factors such as thermal plume. Contaminants were released through coughing with various size distributions in conjunction with the simultaneous production of cough-jet to imitate the real coughing process. As the difference in the source locations may lead to a significant difference of contaminant fields in airliner cabin, 14 cough-jet released from different coughing passengers was quantitatively analysed. The numerical results were also compared to our research outcomes under the same cabin environment to identify the importance of the local cough-jet.
Methods and validation
Computational domain and boundary conditions
Considering that the higher occupant density in an economy-class cabin may cause a higher risk of disease transmission, this study focuses on the transport and distribution of particulate contaminants in economy-class cabins. The economy cabin model was built based on a typical medium size commercial airliner (Boeing 737). A cabin section with three seats and three Passengers A, B and C were built as the computational domain, as illustrated in Figure 1. According to Liu et al.'s
15
experimental measurement, the airflow pattern is approximately symmetric across the central plane along the aisle. Therefore, a symmetric boundary was set up in the central plane along the aisle to save the computational cost. For the same purpose, two translational periodicity boundaries were applied at the front and back planes of the cabin section, since the ventilation layout and geometry arrangement were uniform at each row. By applying symmetric and periodic boundaries, the computational domain was largely trimmed down which could significantly reduce computational cost, while more computational resource was spent on investigating the local cough-jet. Also, as the cough-jet would merge with the surrounding airflow within a few seconds after release,
6
the reduced cabin section was tested to be sufficient enough to capture the cough-jet behaviour.
Simulation of the cabin section and the grid size around the mouth area.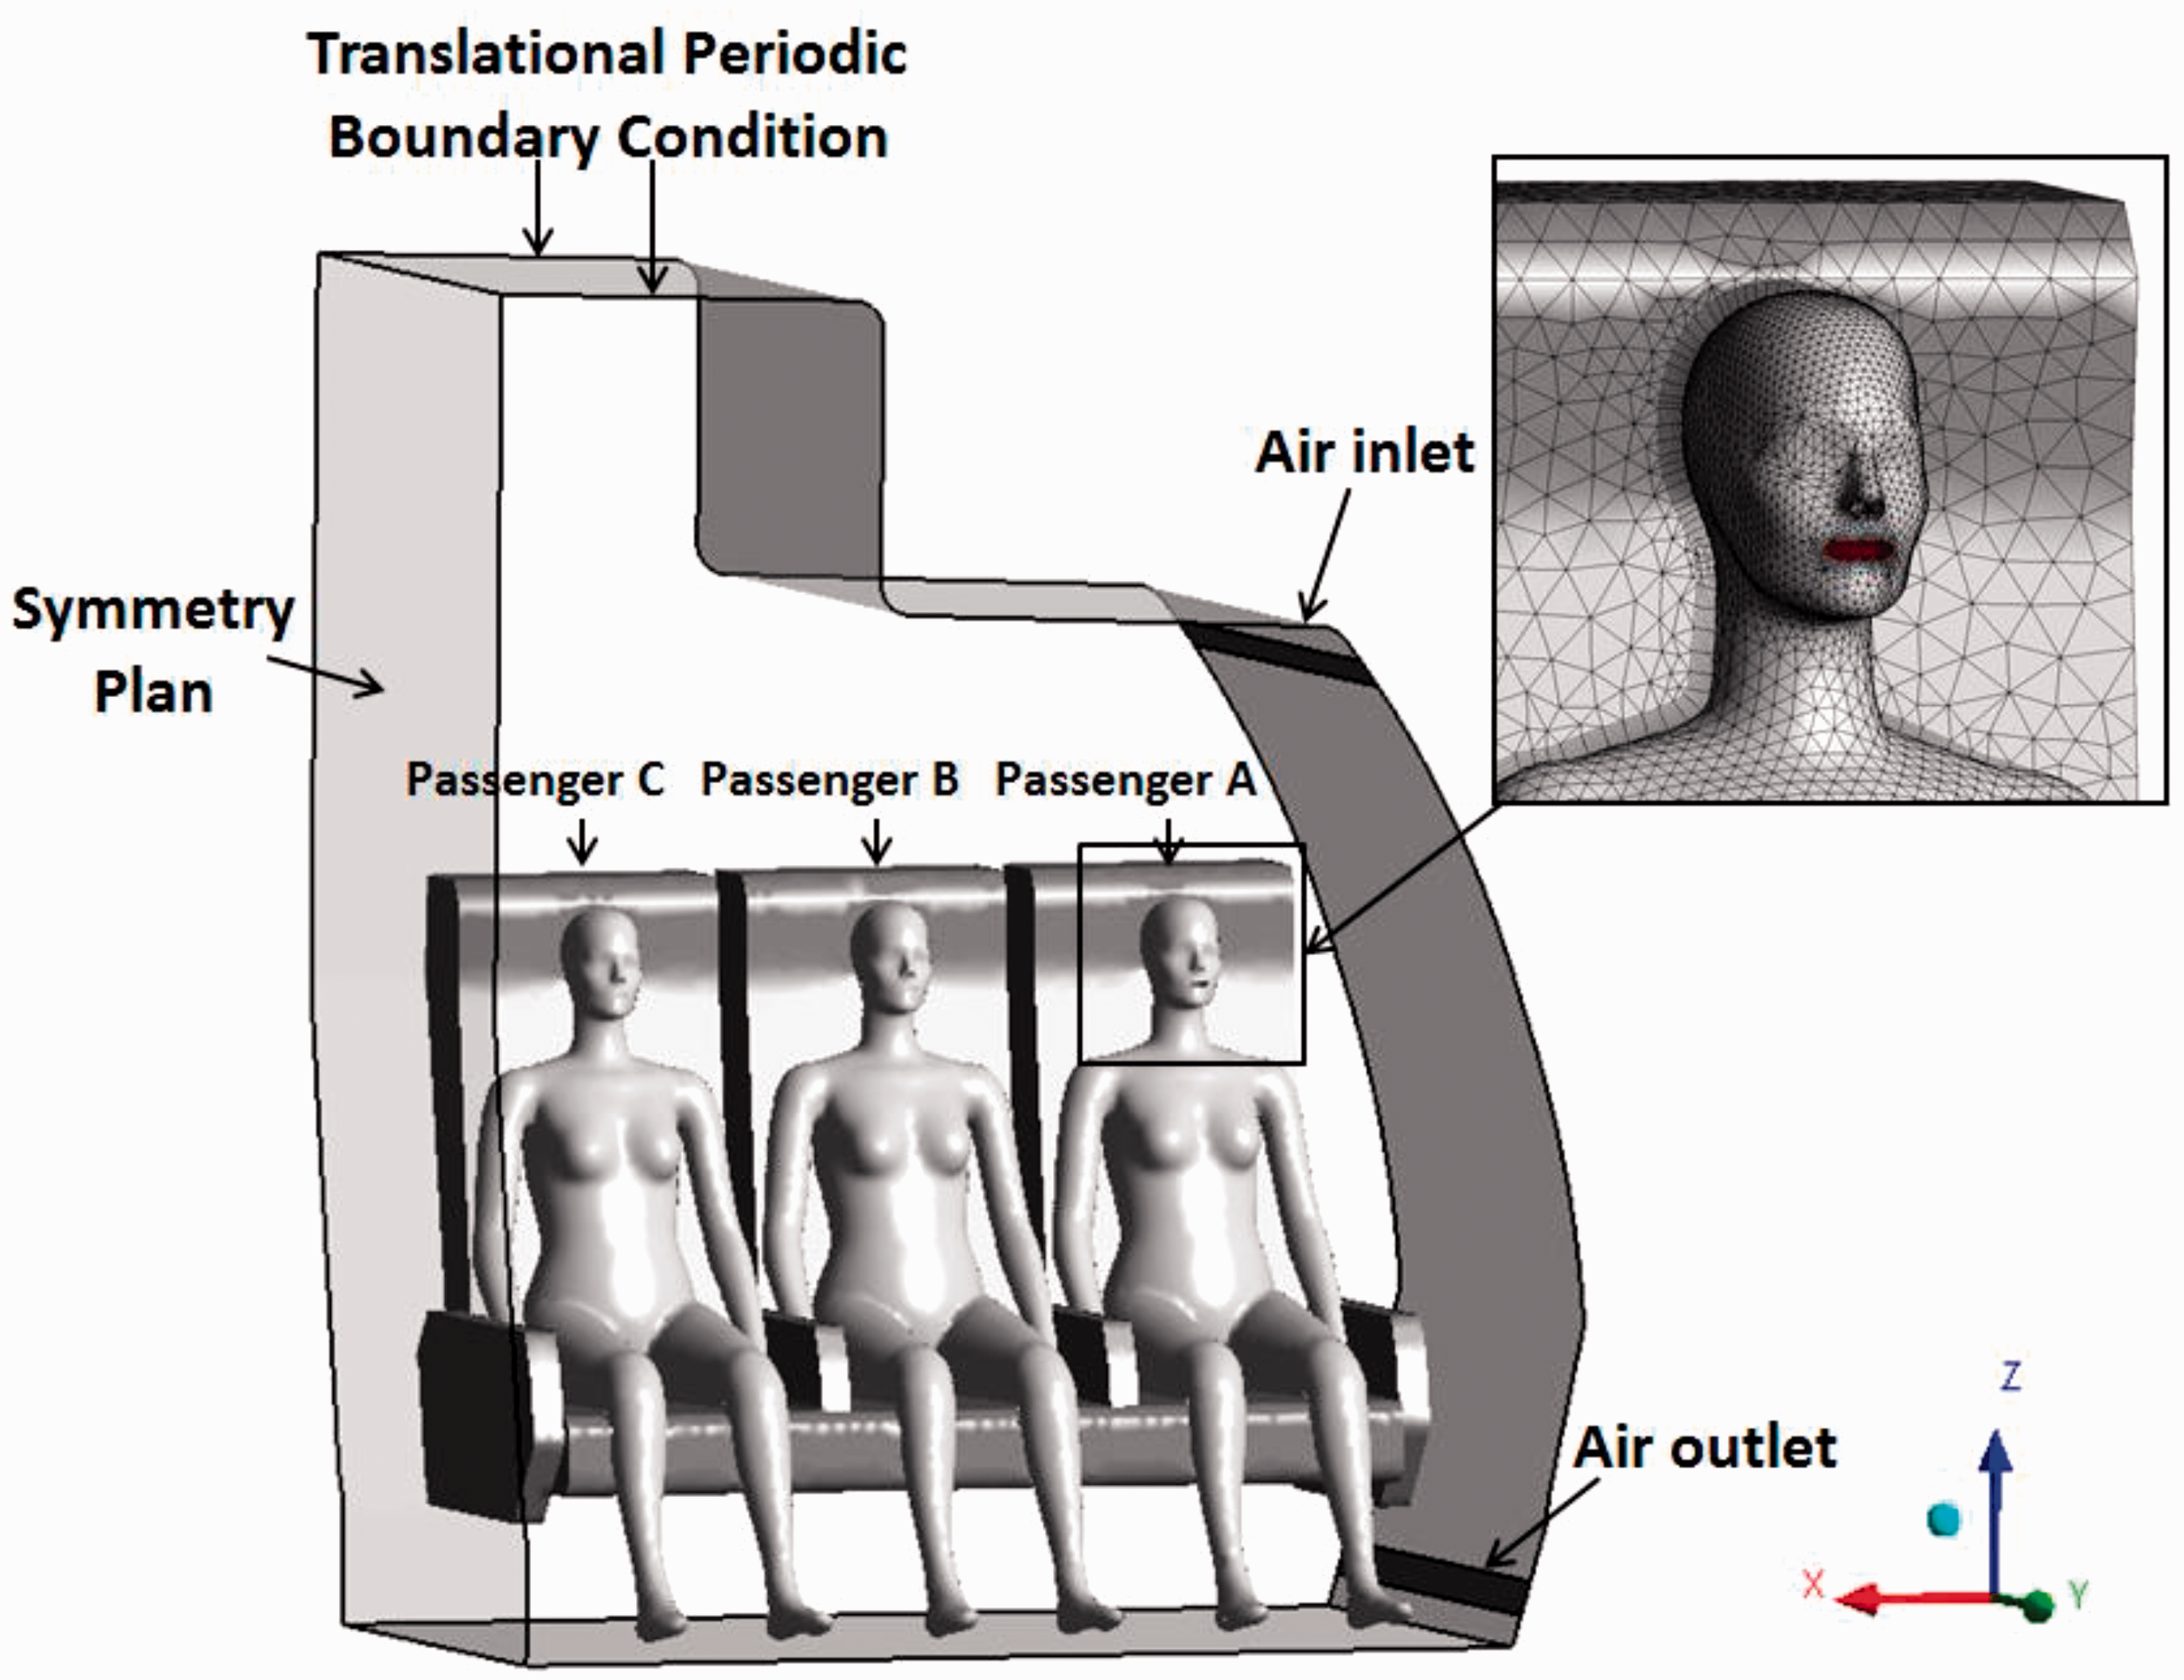
The ventilation schema was built based on Liu et al.'s experimental cabin mock-up and the ventilation rate was set according to the ASHARE aviation standard.15,16 Air was supplied from the inlet diffusers at the upper side of the cabin walls and exhausted from the outlets located at lower side of the cabin walls. The air supply rate through the inlets was 0.04 kg/s according to the ASHARE aviation standard with inlet air temperature of 25 ℃. 16 Three detailed 3D-scanned adult female manikin models with seating posture were applied as passengers in the cabin section. 17 The mouth area of each manikin was further modified as shown in Figure 1, in which the exhaust boundary of the cough was set in the simulation. An equivalent convective heat load of 40 W was set on each manikin to imitate the passengers' body heat, which matches the settings from existing literature and our previous study.13,18 All other solid walls including cabin ceiling, side walls, floor and seats were assumed to be in adiabatic condition.
CFD model
In this study, the cabin airflow field was solved using the incompressible Navier–Stokes equations. Zhang et al. found that the renormalisation group (RNG) k-epsilon model can effectively predict the turbulent feature of the airflow in the aircraft cabins.19,20 Therefore, air turbulence was based on the RNG k-epsilon model. Boussinesq approximation was employed to address thermal buoyancy flow induced by human body heat. All governing equations were solved using the commercial CFD software ANSYS CFX 16.0.
For the cough-jet model, particulate contaminants were assumed to be exhaled from the passengers’ mouth area through coughing. During one cough, a cough-jet was released simultaneously with the contaminants. An average cough-jet rate is plotted in Figure 2, based on tests.
21
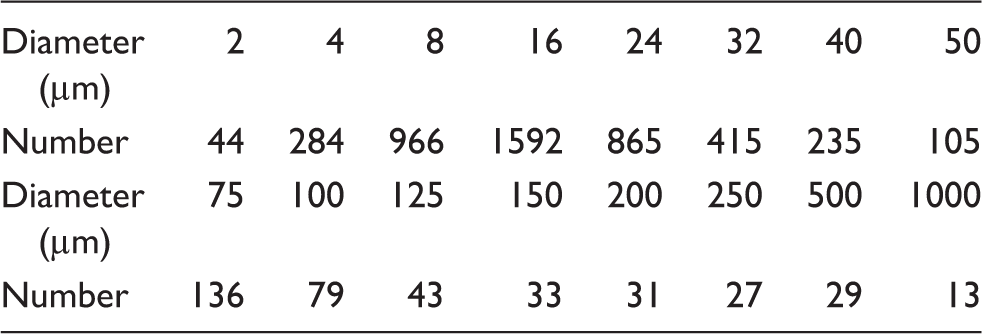
Various sizes of contaminants were considered in this study, based on the size distribution of contaminants from Bourouiba et al.
22
The profile of droplet size distribution is given in Table 1, in which the sizes of exhaled contaminants are mainly distributed between 5 μm and 25 μm.
Average cough-jet rates based on the 25 subjects. Discrete probability of particle size during one coughing.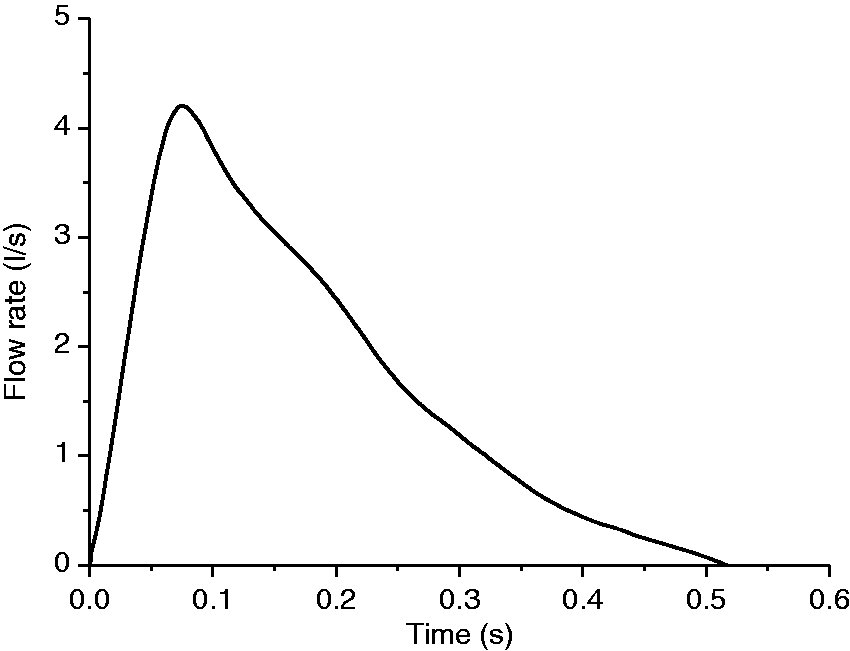
Based on Zhang and Chen,
23
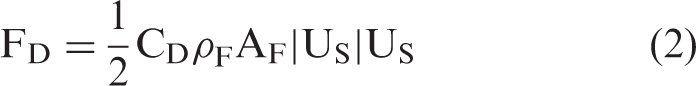
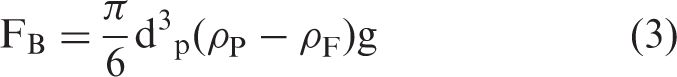
for the unsteady scenario, the prediction of airborne particle distribution has a better tracking accuracy by using the Lagrangian approach. For micron particles immersed in continuous air, important forces governing particle motions are the drag force 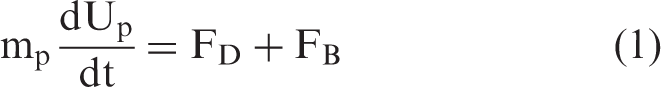

Considering that most surface area of cabin walls, seats and passengers' cloths are made of fabrics, droplets could not bounce back to the fluid domain after collisions. Therefore, the “Stick-to-Wall” model (ANSYS, 2013) was used in the simulation for this phenomenon, which treats these surfaces as a sink term of the particulate phase.
Due to the fact that the cough-jet ejected from manikin mouth is an unsteady process, transient simulation was conducted in this study. According to Figure 2, cough begins with a very high acceleration exhalation flow rate for a very short time. When at peak velocity time (PVT) 0.08 s, the cough peak flow rate reaches at 4.2 L/s. Then, the exhalation flow rate decreases to 0 in 0.53 s, where the cough expiratory volume is 0.87 L. Therefore, in the large gradient stage from 0 s to 0.15 s, time was divided into small computational time steps so that high accuracy of droplet ejection, along with cough-jet, can be captured.
For the simulation domain, ANSYS ICEM was used to generate the unstructured mesh. As the occupied manikins have detailed features, high resolution meshes were built inside the simulation domain. Also, inflation layers were applied in all surfaces to capture the accurate flow movement, as illustrated in Figure 1. Grid independency test was conducted over coarse meshing to dense meshing. The independency test show that the air flow velocity becomes stable when the mesh elements number is over 1.9 million in this simulation domain.
Liu et al.'s
15
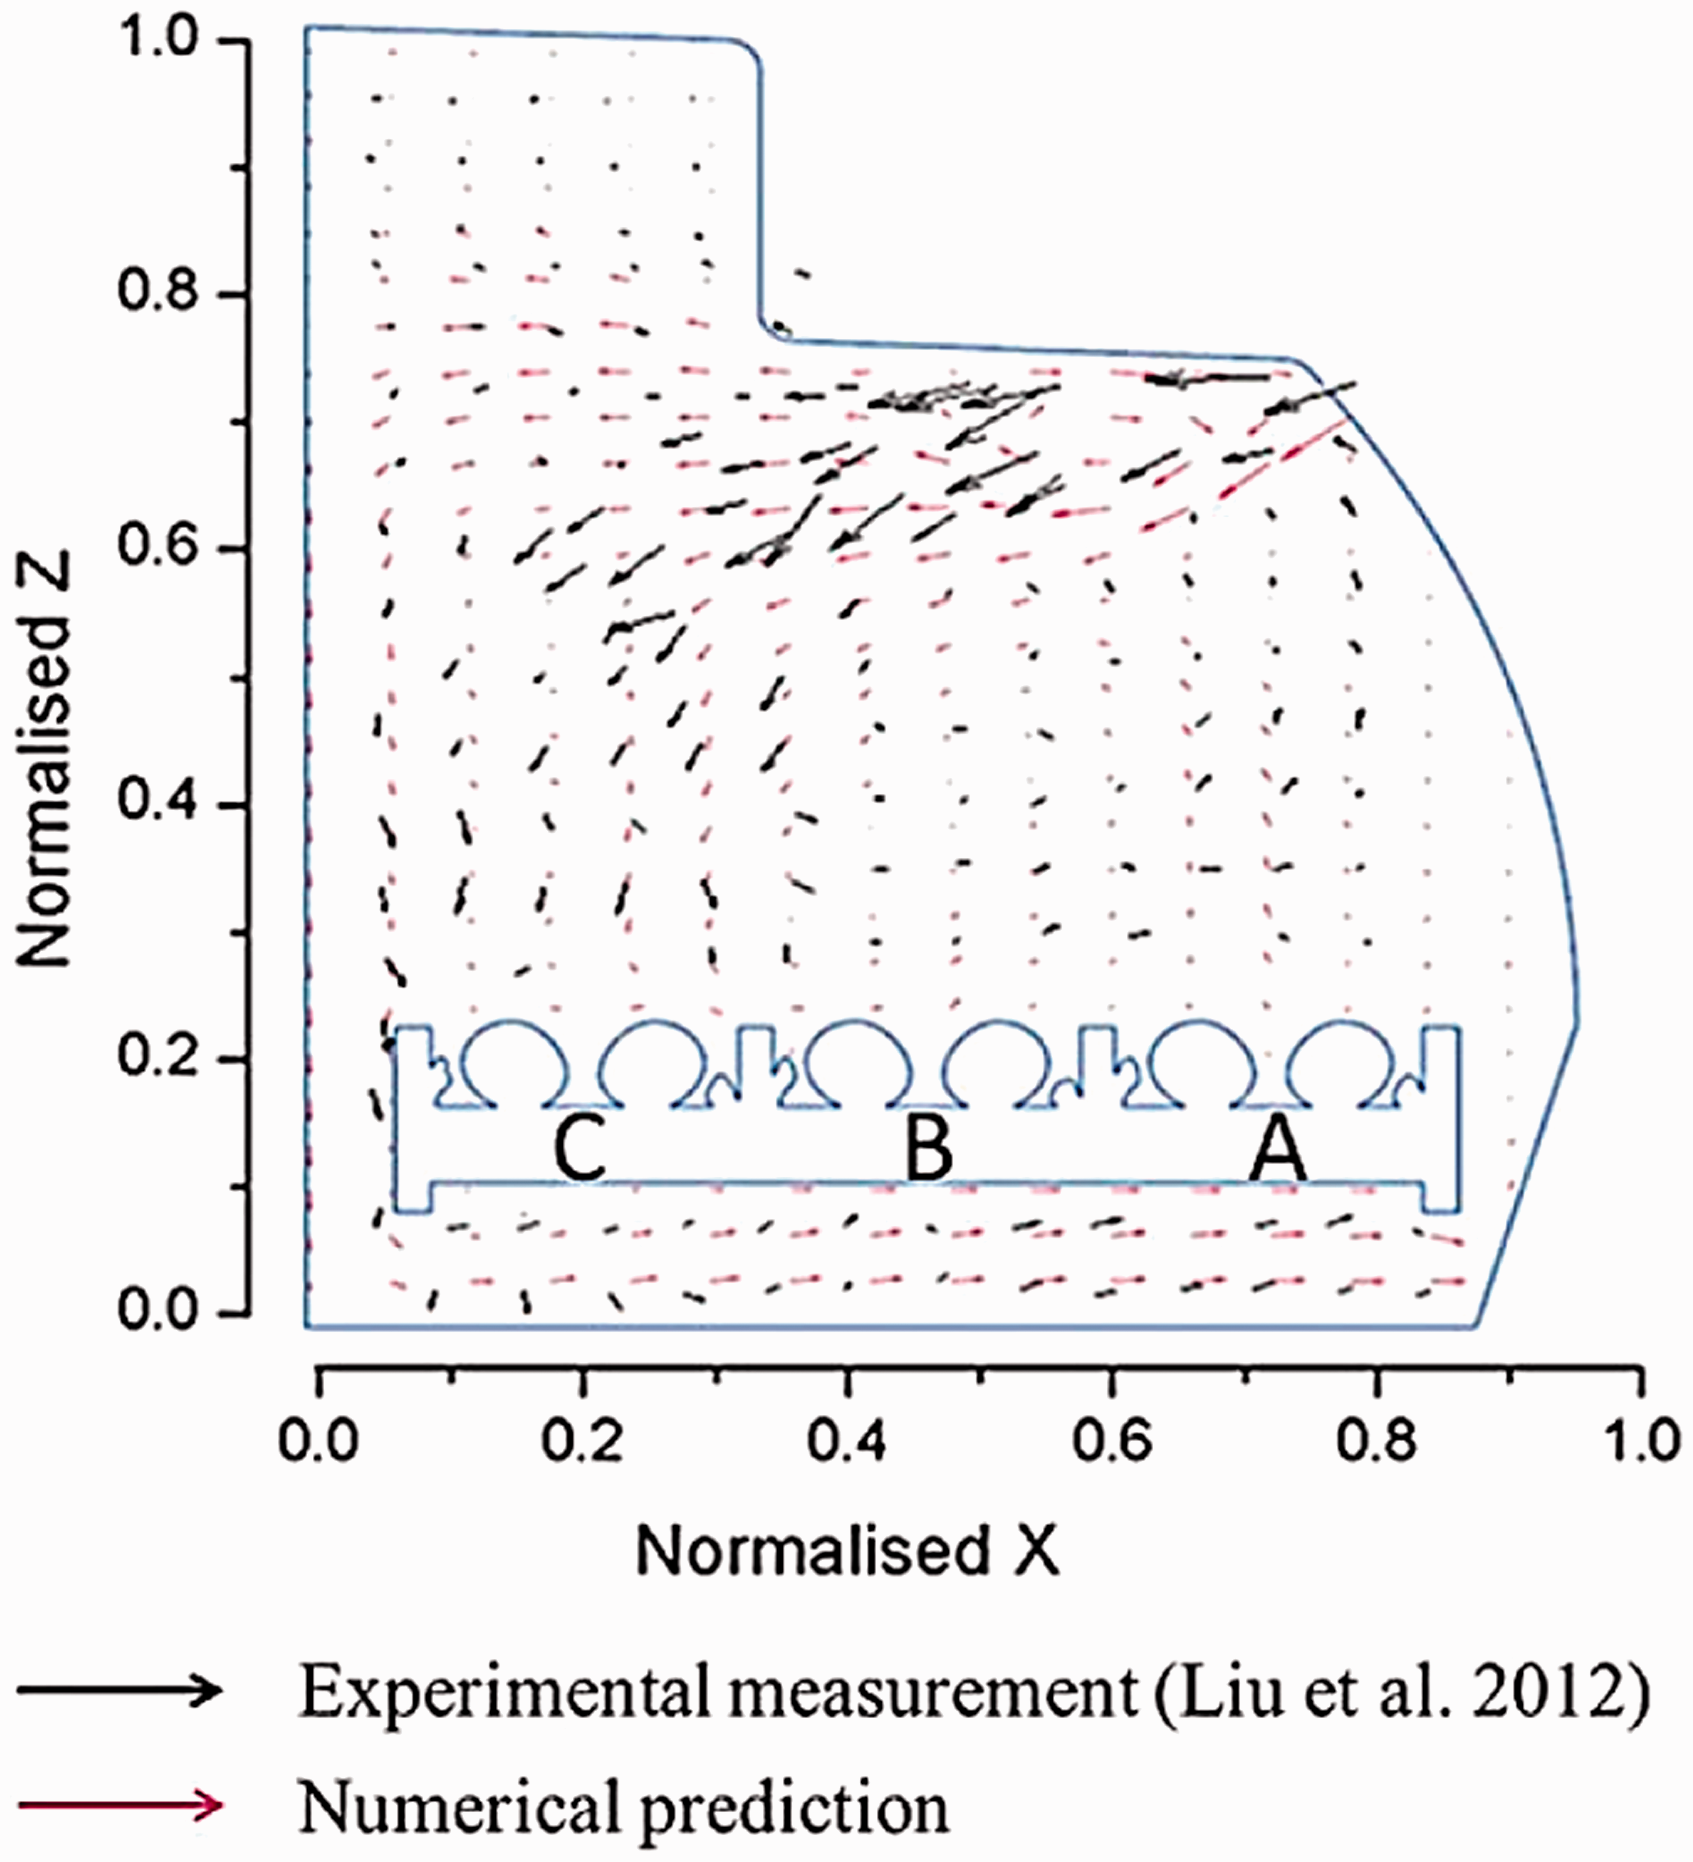
experiment data in the first-class cabin of an MD-82 commercial airliner cabin was used to validate the current numerical model. In their experiment, measurements of airflow velocity were conducted by using particle image velocimetry (PIV) in a vertical plane located in front of manikins. The predicted airflow field in planes X–Z was compared with the PIV experimental results in Figure 3. Figure 3 demonstrates that the overall airflow patterns yielded from the adopted experiment and our numerical predictions are very close. Both experimental and numerical results show large magnitude velocities existing within the middle region. However, the direction differences of these velocities could be observed. This could be attributed to the geometry difference between numerical model and test cabin. For further details of the numerical model validation, the reader can refer to our previous study.
13
In general, the simulation results show good agreement with the experimental results, and the mathematical model and computational model have been proved to be acceptable for simulating the airliner cabin ventilation environment.
Comparison of airflow vectors between the experimental data and computational results.
13
Results and discussion
Cough-jet effects on fluid flow
In this study, three computational cases (Case 1, Case 2 and Case 3) were conducted with regard to coughing from Passenger A, Passenger B and Passenger C, respectively. In order to explore the cough-jet effects on cabin airflow, the local airflow fields around the Passenger B's breathing zones of Case 2 were firstly investigated.
25
The velocity in the vertical plane and horizontal plane crossing Passenger B's breathing is illustrated in Figure 4. In the steady state, the breathing zone was controlled by ventilation jet, human thermal plume and manikin geometry.
13
However, when cough-jet was excluded from the models, the breathing zone was completely controlled by the cough-jet. Two specific time-step states are plotted in Figure 4. At 0.08 s, which is the PVT in Figure 2, the velocity magnitude of airflow in breathing zone was much larger than that in the steady state. The maximum velocity magnitude reached 11.2 m/s, which is almost 50 times of steady air-flow velocity. It also can be identified clearly that a large vortex is generated by cough-jet in the breathing zone around this time. At 0.5 s, when cough-jet ends, the velocity magnitudes of airflow in breathing zone also have the trend of reducing to the similar magnitude of steady state. Therefore, the duration and development of cough-jet have significant effects on local flow around breathing zone.
Velocity vector field around the breathing zone for cough Passenger B in Case 2.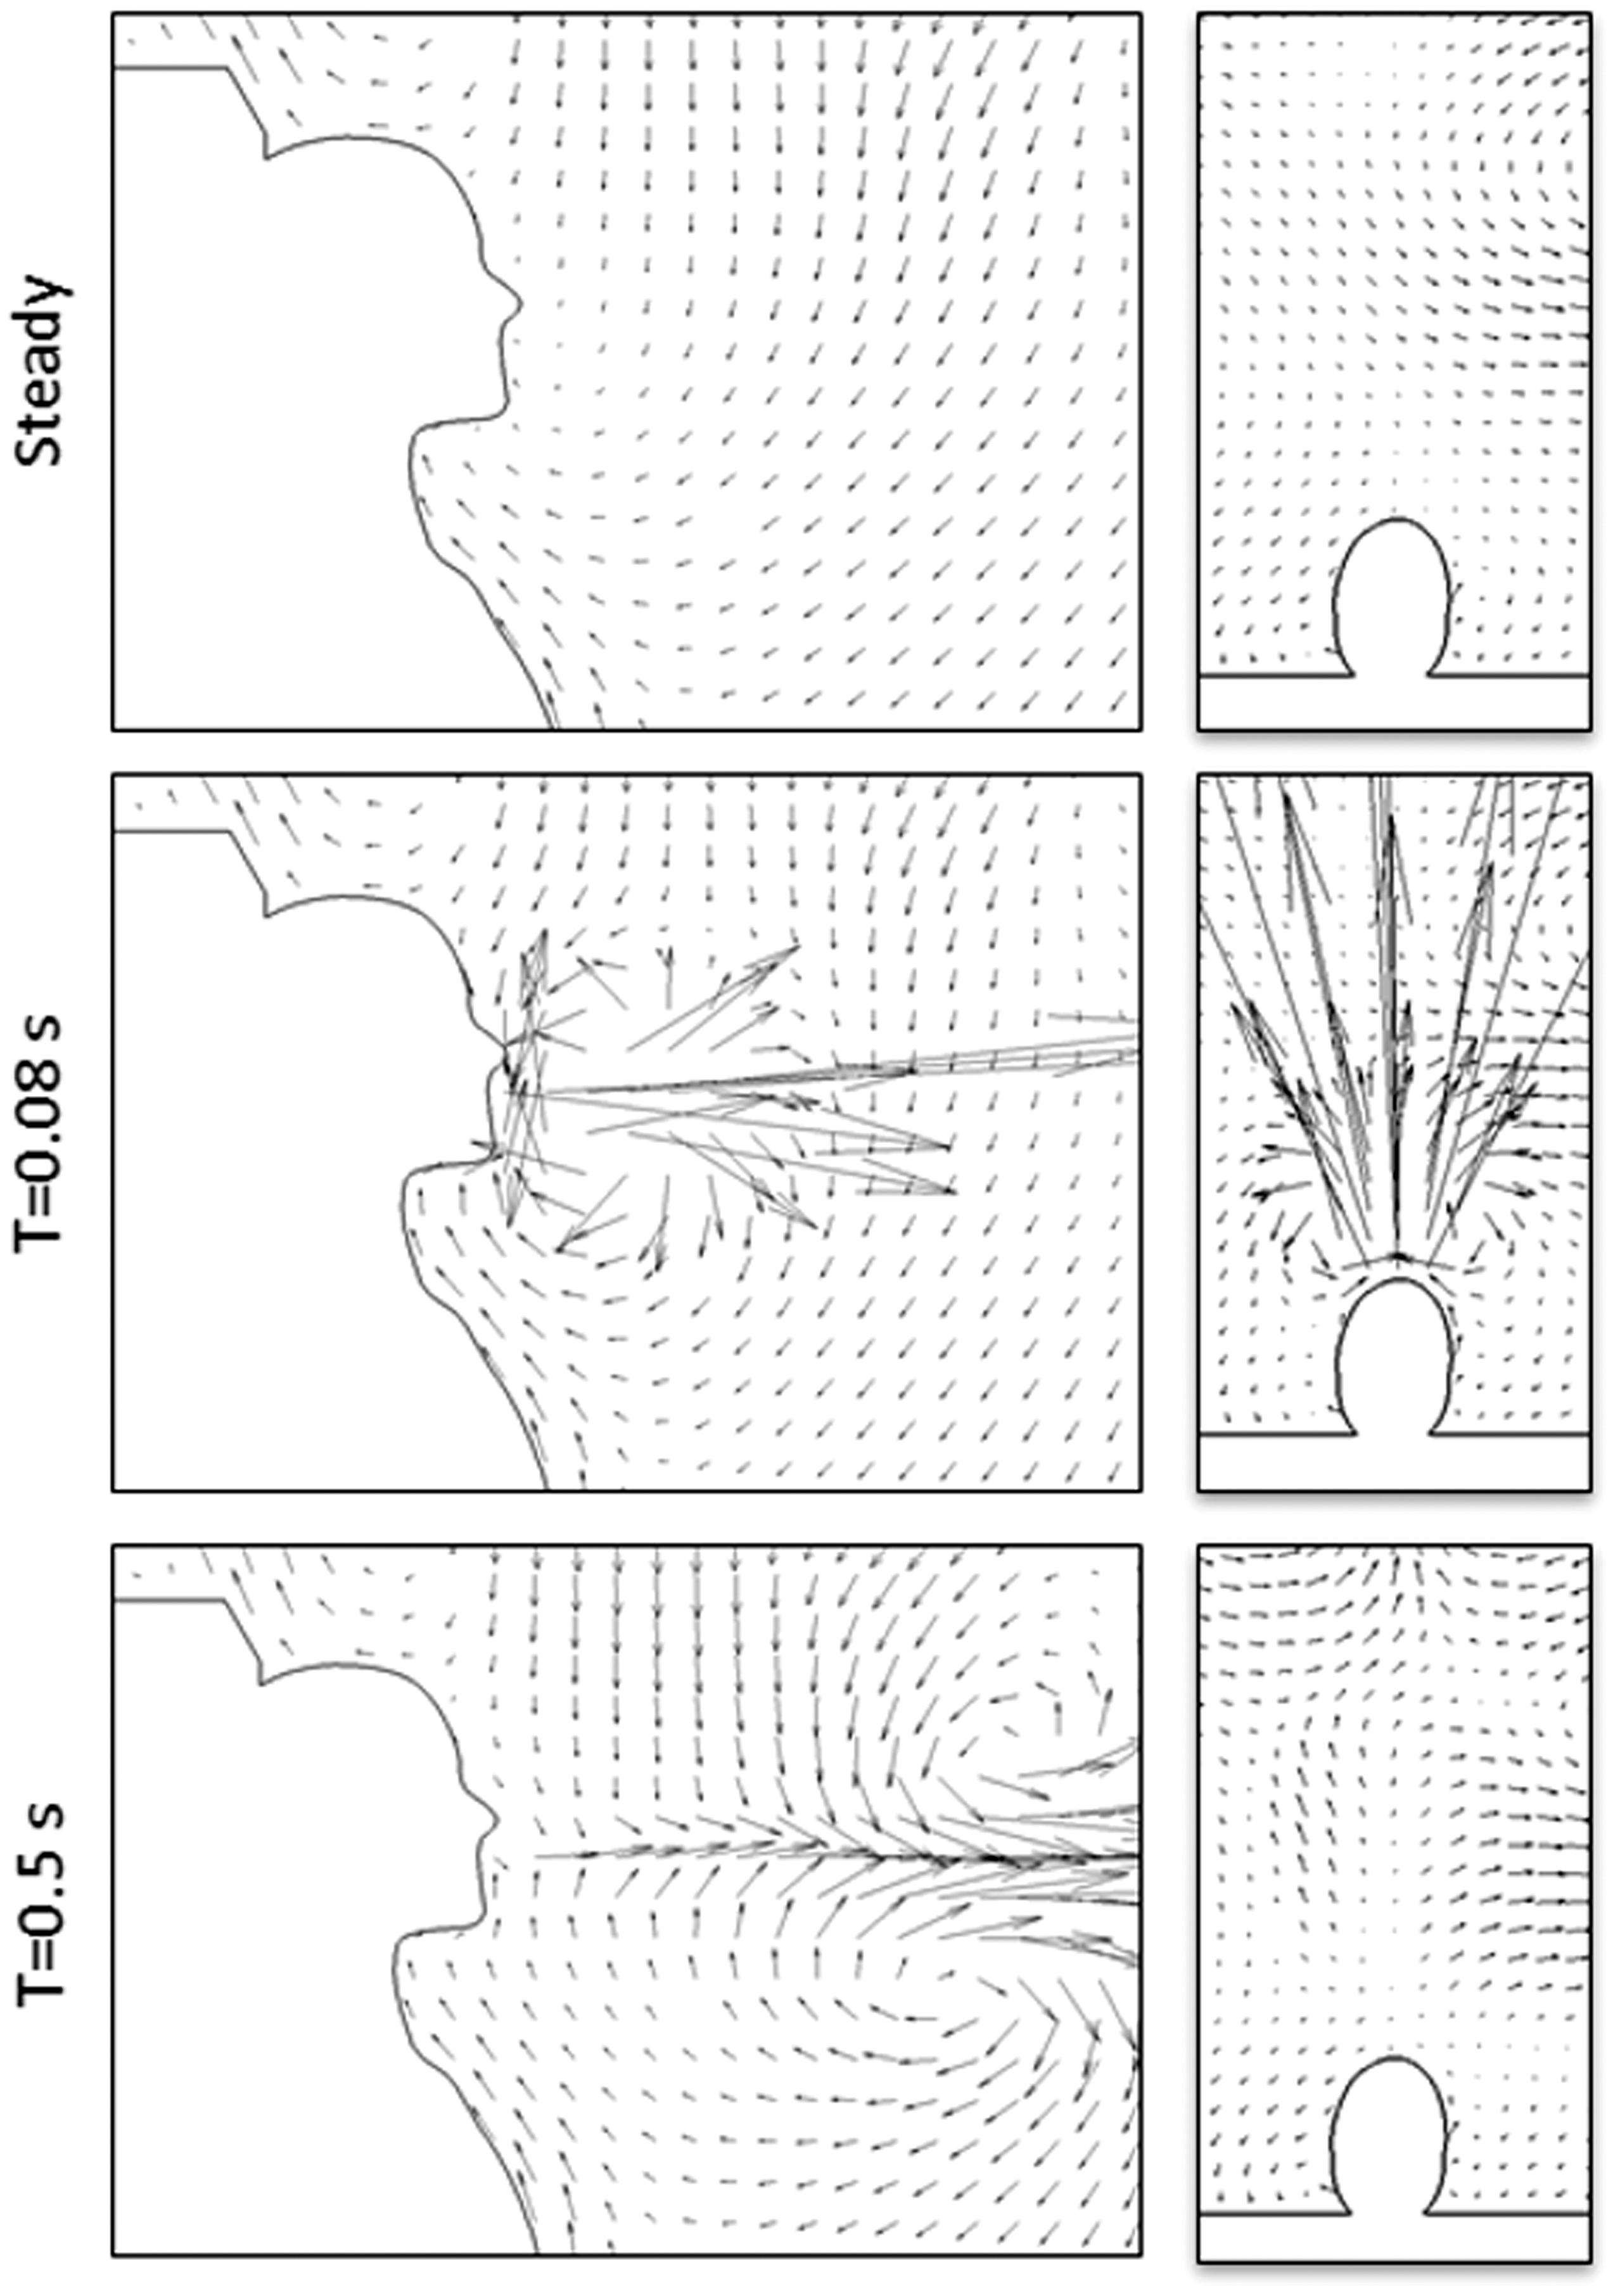
For a more comprehensive study of cough flow performance on different airflow fields, all three cases with regard to coughing from three different locations were analysed together. The vector figures of airflow velocities in the plane crossing the coughing passenger body were presented and compared at different time steps in Figure 5.
Velocity vector field across X-plane for different cough passengers.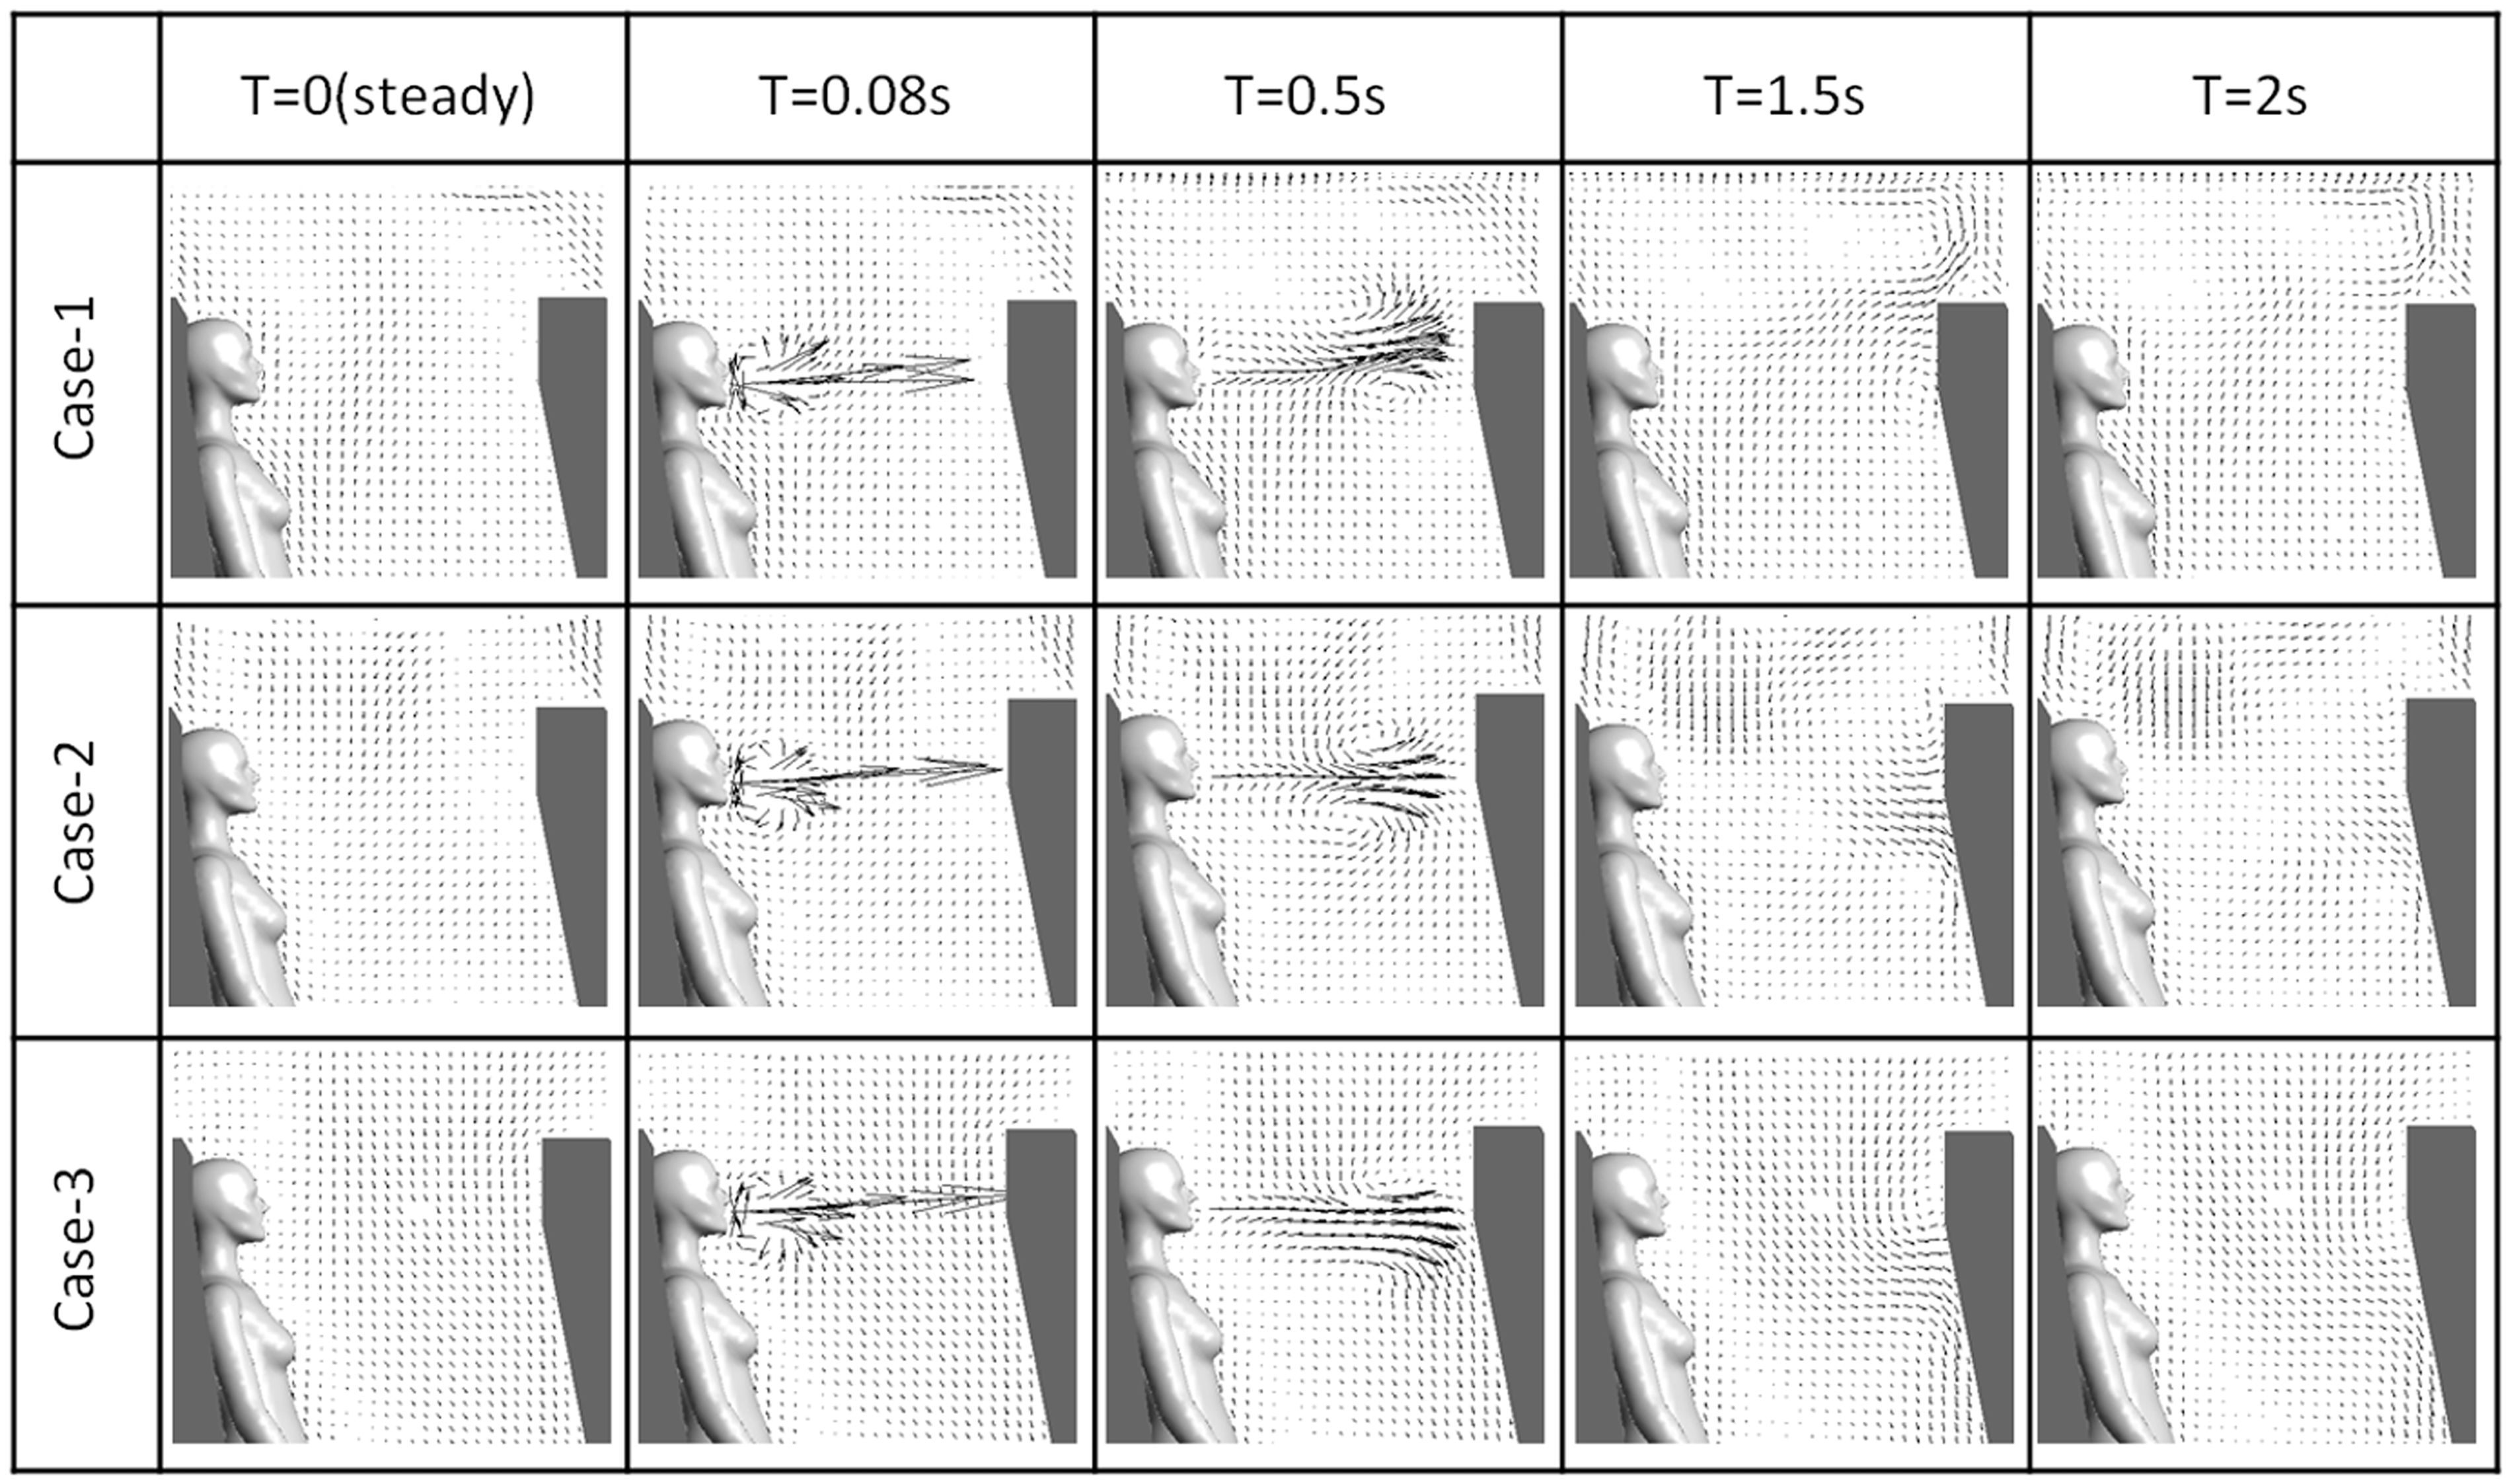
When the cabin ventilation flow was steady (Figure 5, T = 0 s), the overall airflow pattern was dominated by the inlet air coming from the diffuser located in the upper side wall. Uprising buoyancy flows can be observed above all the passenger heads due to thermal plume effects. The local airflow field in every passenger's breathing zone was slightly different. An uprising airflow was monitored in front of Passenger A who sat close to the wall, while a downward airflow was observed in the breathing zone of Passenger C who was next to aisle. Between them, a small vortex flow existed around Passenger B.
Although all the three passengers suffered different airflow patterns in their breathing zones at steady state, similar cough-jet patterns can be clearly identified during the first 0.5 s of cough. From Figure 5, T = 0.08 s, it could be seen that Case 1 and Case 3 have almost the same flow pattern of Case 2 as discussed in Figure 4 where large vortex is observed. Besides, all these three planes indicated that the direction of cough flow would not be affected by the ventilation airflow during this period as it was perpendicular to the back of the front seat. At 0.5 s, when the cough-jet was ended from coughing passenger, all the airflow velocity of three cases decreased largely in breathing zone. Therefore, during the first 0.5 s, irrespective of the difference between local airflow fields, the strong cough-jet dominated the airflow. Within this time period, the affected distance reached 0.45 m from the coughing mouth. However, in the region where cough-jet did not reach, such as upper cabin or passenger leg area, no infection was observed.
After 0.5 s, the cough-jet had less effect on the cabin airflow due to the even longer distance it had travelled, while the cough-jet pattern varied in each case. Case 1 cough-jet joins the uprising ventilation flow caused by the thermal plume. The joint flow would then mix with flash airflow supplied from inlet diffusers and it would be distributed into the whole cabin. In Case 3, an opposite cough-jet direction downward to the bottom of front seat can be seen. In Case 2, half of the cough-jet joined the uprising ventilation airflow, while the other half moved downward. After 2 s, the cabin airflow pattern became reasonably steady in all three cases. Therefore, during the period of 0.5–2 s, the affected airflow region reached the front seat which was 0.65 m away from coughing mouth. Within this region, cough-jet did not dominate the airflow anymore. Instead, the domination of airflow would be gradually changed by the cabin ventilation airflow.
Cough-jet effects on distribution of droplets
The transport and distribution characteristics of particles generated by the coughs from the passengers were studied under both with cough-jet and non-flow cough conditions. For non-flow cough simulation, the droplets were assumed to be released with an initial velocity only, rather than released with the cough-jet. Separate computations were conducted to simulate the tracks of the particles with size of 4 μm exhaled by each of the three passengers. According to Figure 5, the velocity magnitude of cough-jet was much larger than cabin ventilation airflow. As the particles were carried by airflow, the distribution process in non-flow cough condition was much slower than in cough-jet condition. Therefore, in this study, the particle tracking times were observed for 40 s in non-flow cough condition and 10 s in cough-jet condition, as illustrated in Figure 6. It is clear that the passenger cough-jet not only had a significant effect on the airflow field as illustrated in Figure 5, but it also dramatically altered the trajectories of particle transport. Figure 6 also demonstrated that the particle trajectories were jointly controlled by the ventilating airflow and cough-jet. The particles would be elevated to a higher level, descend toward the floor, or sunk in the surface of seats, depending on the location of coughing passenger.
Particle trajectories for without cough-jet and with cough-jet cases. (a) Released by Passenger A without cough-jet (b) Released by Passenger A with cough-jet (c) Released by Passenger B without cough-jet (d) Released by Passenger B with cough-jet (e) Released by Passenger C without cough-jet (f) Released by Passenger C with cough-jet.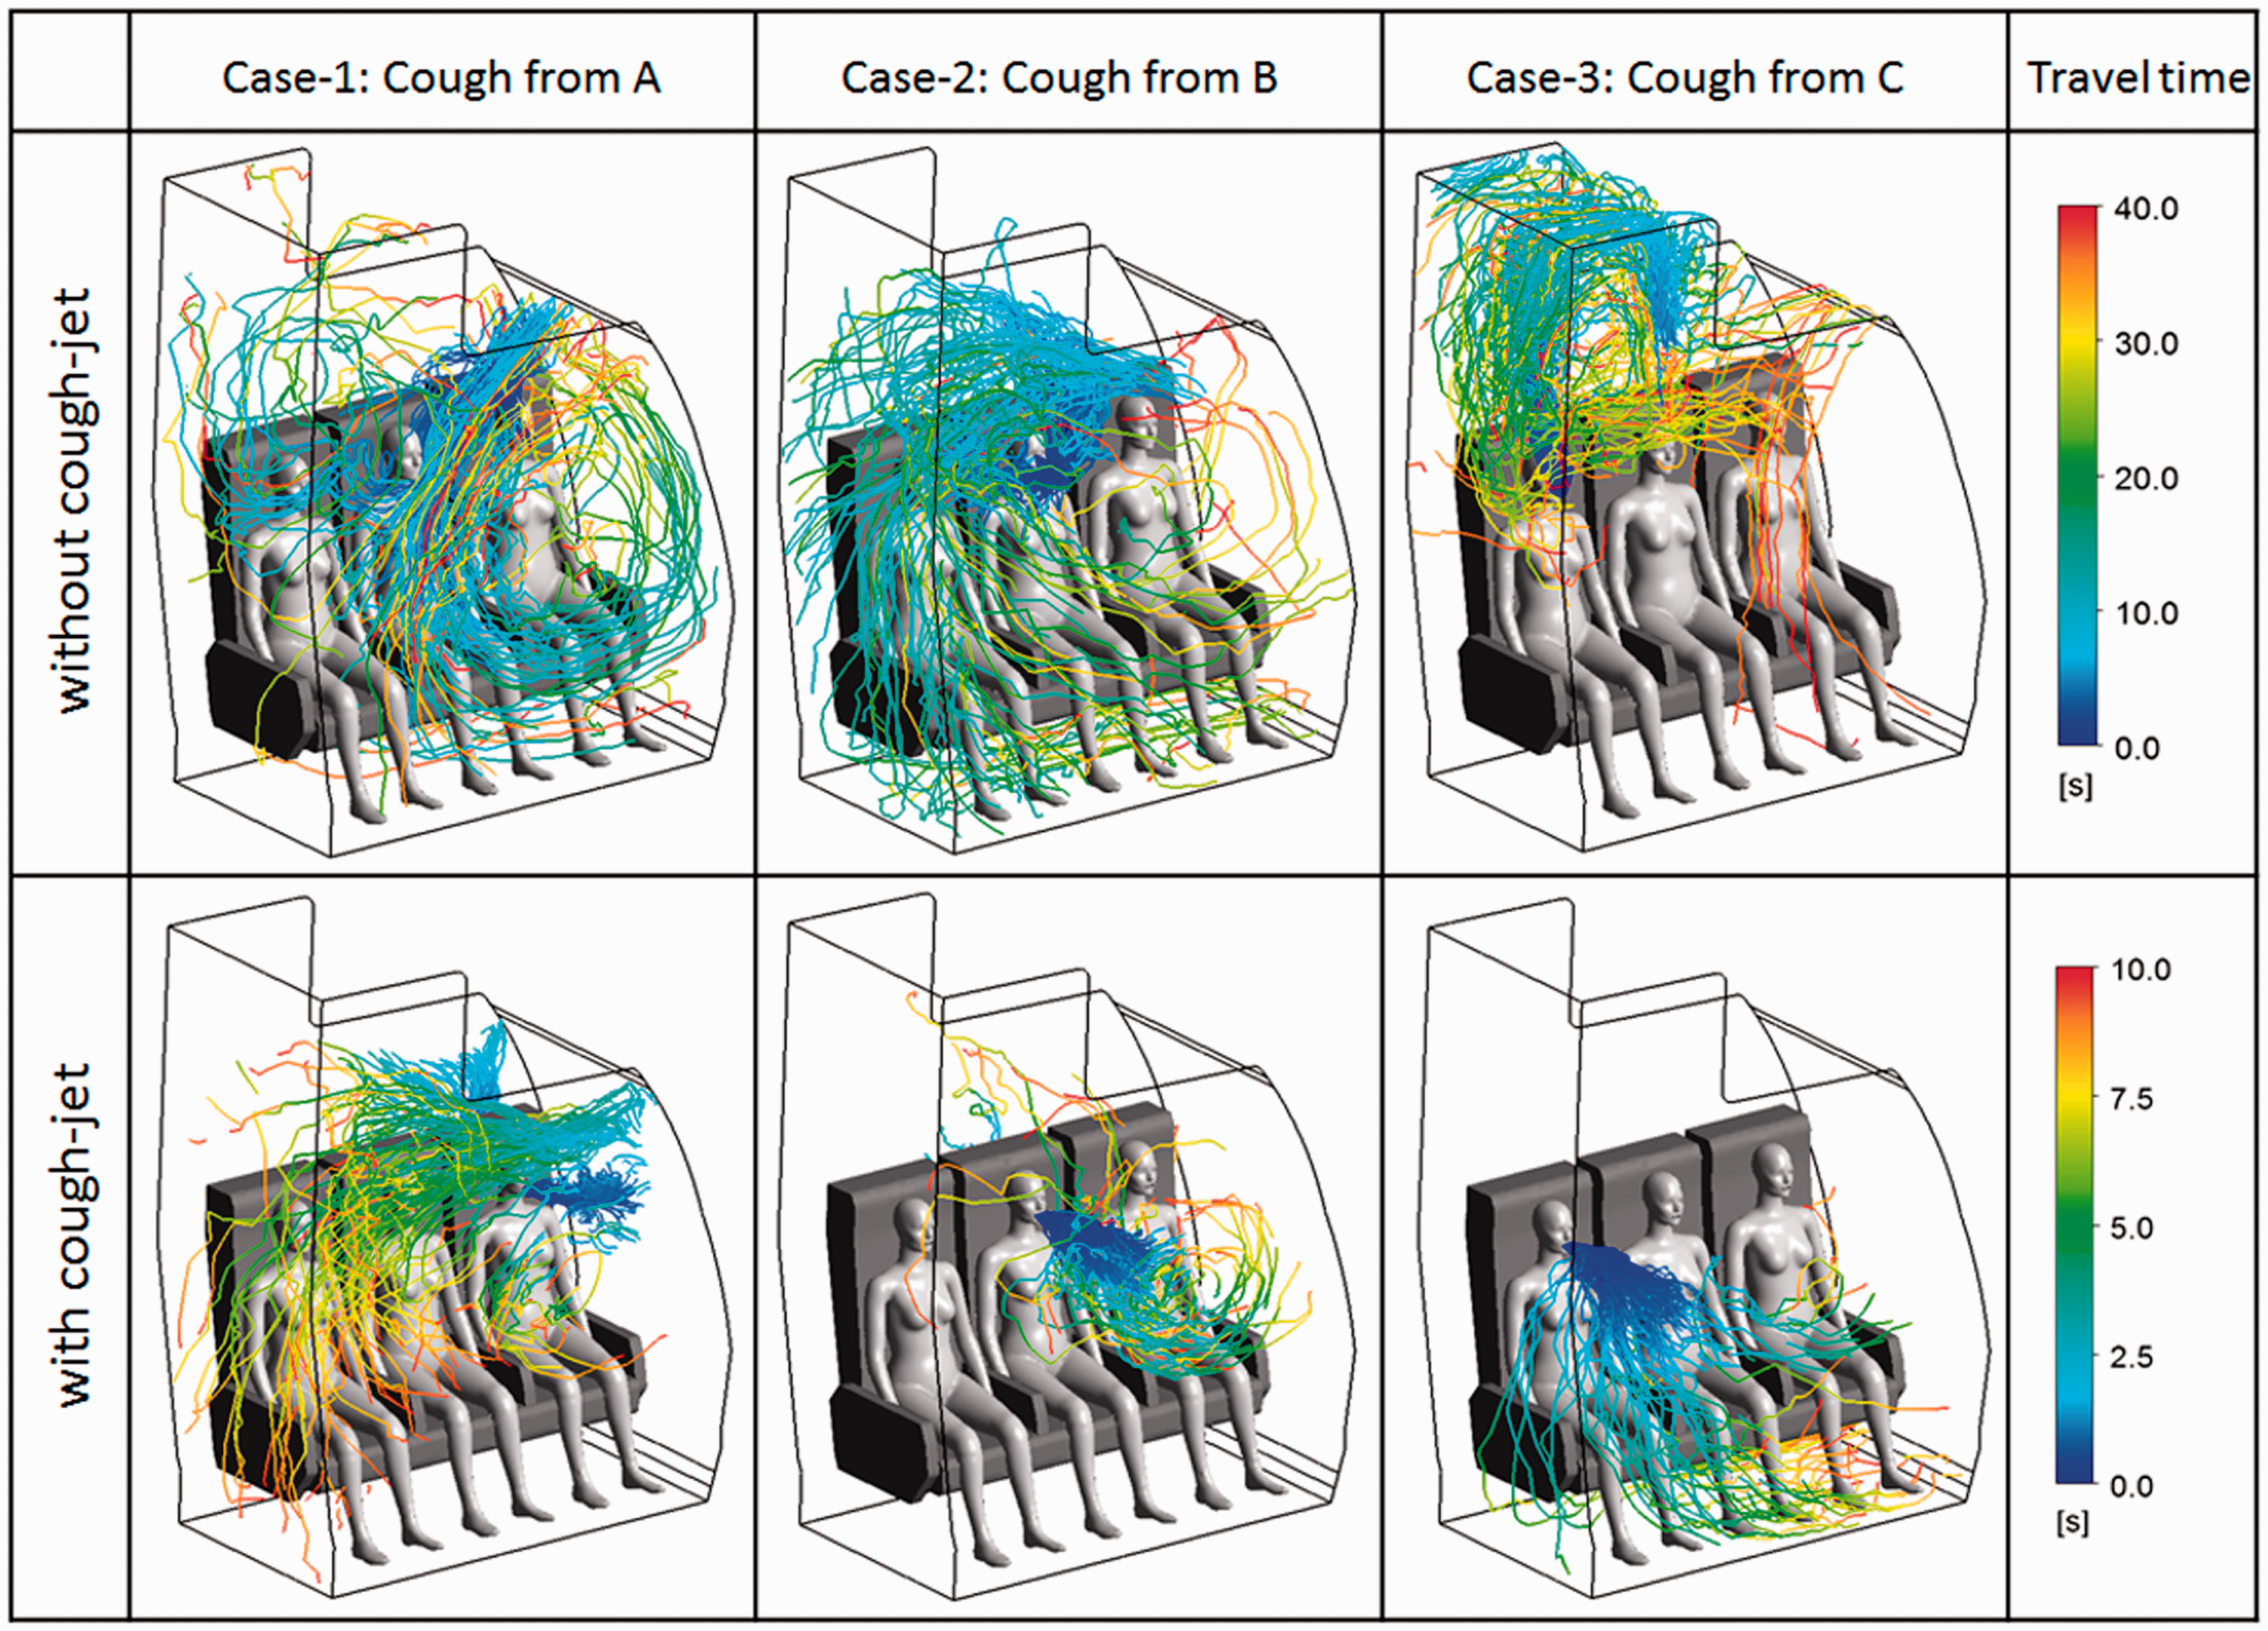
When the particles were released by Passenger A (Figure 6(a)) without cough-jet, they immediately move upward with the airflow and then suddenly changed their way downward when they reached the inlet diffuser as the particles were carried on by the fresh airflow. The particles were travelling with limited distance rather than travelling widely through the entire cabin section. Gradually, the particles formed a lock-up circle in front of Passengers A and B. However, when cough-jet was included in the model, the distribution trajectories of particles were significantly different. Figure 6(b) illustrates that the released particles were mainly carried by cough-jet until they reached the front seat. With part of particles sunk into the seat surface, the rest were carried by the arising airflow to the inlet diffuser area. Then the strong fresh airflow brought these particles into the aisle area. Due to the balance of the uprising thermal plume from front passengers against the descending ventilation airflow, the lock-up of particles as shown in Figure 6(a) was not existing in this situation.
Figure 6(c) and (d) illustrates the trajectories of particles exhaled by Passenger B, who was sitting in the middle of the seats. After released by non-flow cough from Passenger B, the particles quickly dispersed and joined the overall flow vortex and fully dispersed in the whole cabin section. However, when cough-jet was included in the model, most of the particles were predicted to be carried by strong cough-jet, deposited on the surface of front seat (Figure 6(d)). Only very little particle carried by uprising airflow can be observed. Therefore, both Passengers A and C were located in a region without particles.
The transport trajectories of particles exhaled by Passenger C are illustrated in Figure 6(e) and (f). It was noticed that when cough-jet was excluded, the model predicted that the particles exhaled by Passenger C were mainly concentrated in the bulk air above the Passenger C (Figure 6(e)). By considering cough-jet, the particles were predicted to be distributed in a different range (Figure 6(f)). Half of the particles were sunk into the front seat, the same as in Case 1 and Case 2. The other particles fell into the leg and seat area of coughing passenger following parabola trajectories.
For the quantitative analysis of the cough-jet's influence on particles, comparisons of average particle travelling distance in 13 s are plotted in Figure 7. From Figure 7, the dispersion of particles was quite sensitive to the release location. For instance, particles have the longest travel distance when they were released from Passenger A in both scenarios, with cough-jet and without cough-jet. However, in all the three cases, particles could travel further and faster in a short period of time when cough-jet was taken into simulation. Especially in Case 3, the average travelling distance in situation with cough-jet is three times longer than the situation without cough-jet. Therefore, the large difference of particle travelling distance has significant influence on the airborne disease transmission.
Particle travelling distance in 13 s for without cough-jet and with cough-jet cases.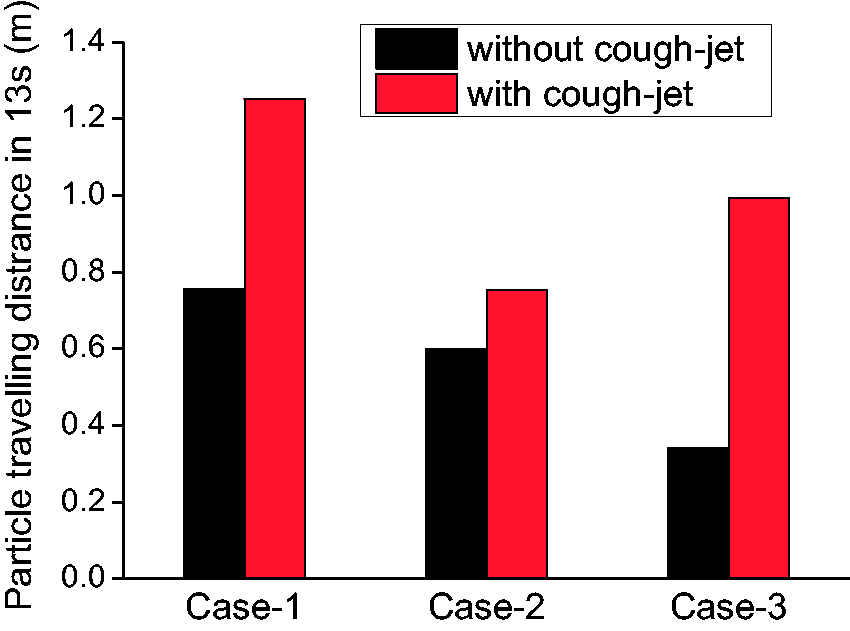
An overall review of Figures 6 and 7 demonstrates that as cough-jet was included in the model, particles were mainly carried by cough-jet for a certain time. The strong cough-jet caused significant changes in the particle trajectories from those yielded from the non-flow coughing cases. According to Figure 5, before 0.5 s, cough-jet dominates the particle transportation, while after 1.5 s, cabin ventilation airflow dominates the particles' distribution. Also, it demonstrated that dispersion speed and range of particles through the air were highly sensitive to their release locations, as the release locations were affected by the local ventilation airflow pattern.
Distribution analysis of different droplet sizes
According to Table 1, the quantity fraction of the particle in different diameters was distributed in Figure 8. According to previous research,
2
the disease transmission rate could depend on the saliva mass. Therefore, the mass fraction of droplets in various sizes was also plotted in Figure 8. By comparing the quantity fraction and mass fraction of different particle sizes, it is clear that in one cough process, even 95% particles had the size smaller than 100 μm, and the total mass value of these particles accounts only for 2% of the entire particle mass. While the large particles have very small amount, the mass fraction was significant. So from this point of view, it is necessary to discuss the transport and distribution characteristics of different size particles. Based on these, the different size particles exhaled during cough from three passengers were studied. Simulation results are plotted in Figure 9. The trajectories of different particle sizes are also marked in this figure using different colours.
Particle number and mass distributions of various sizes. Particle transport and distribution of various sizes.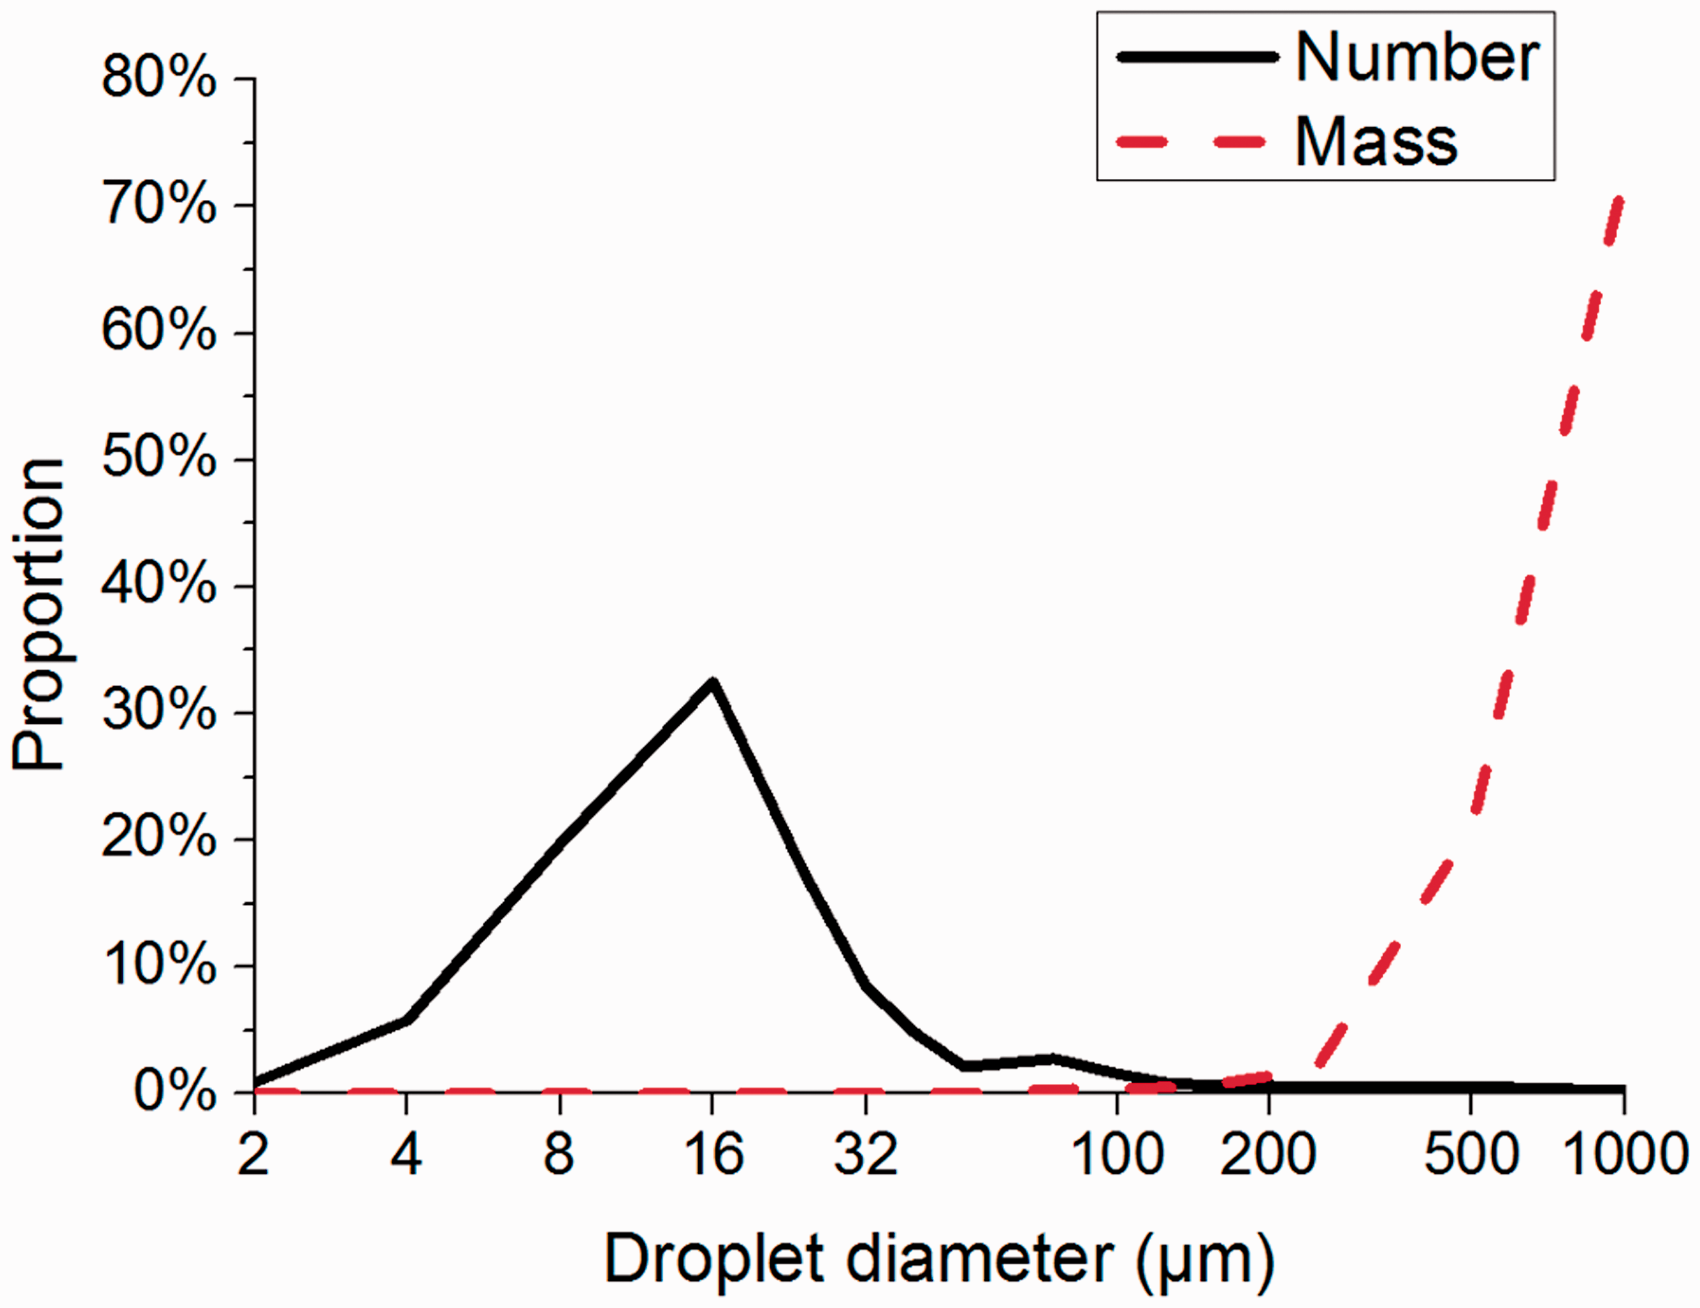
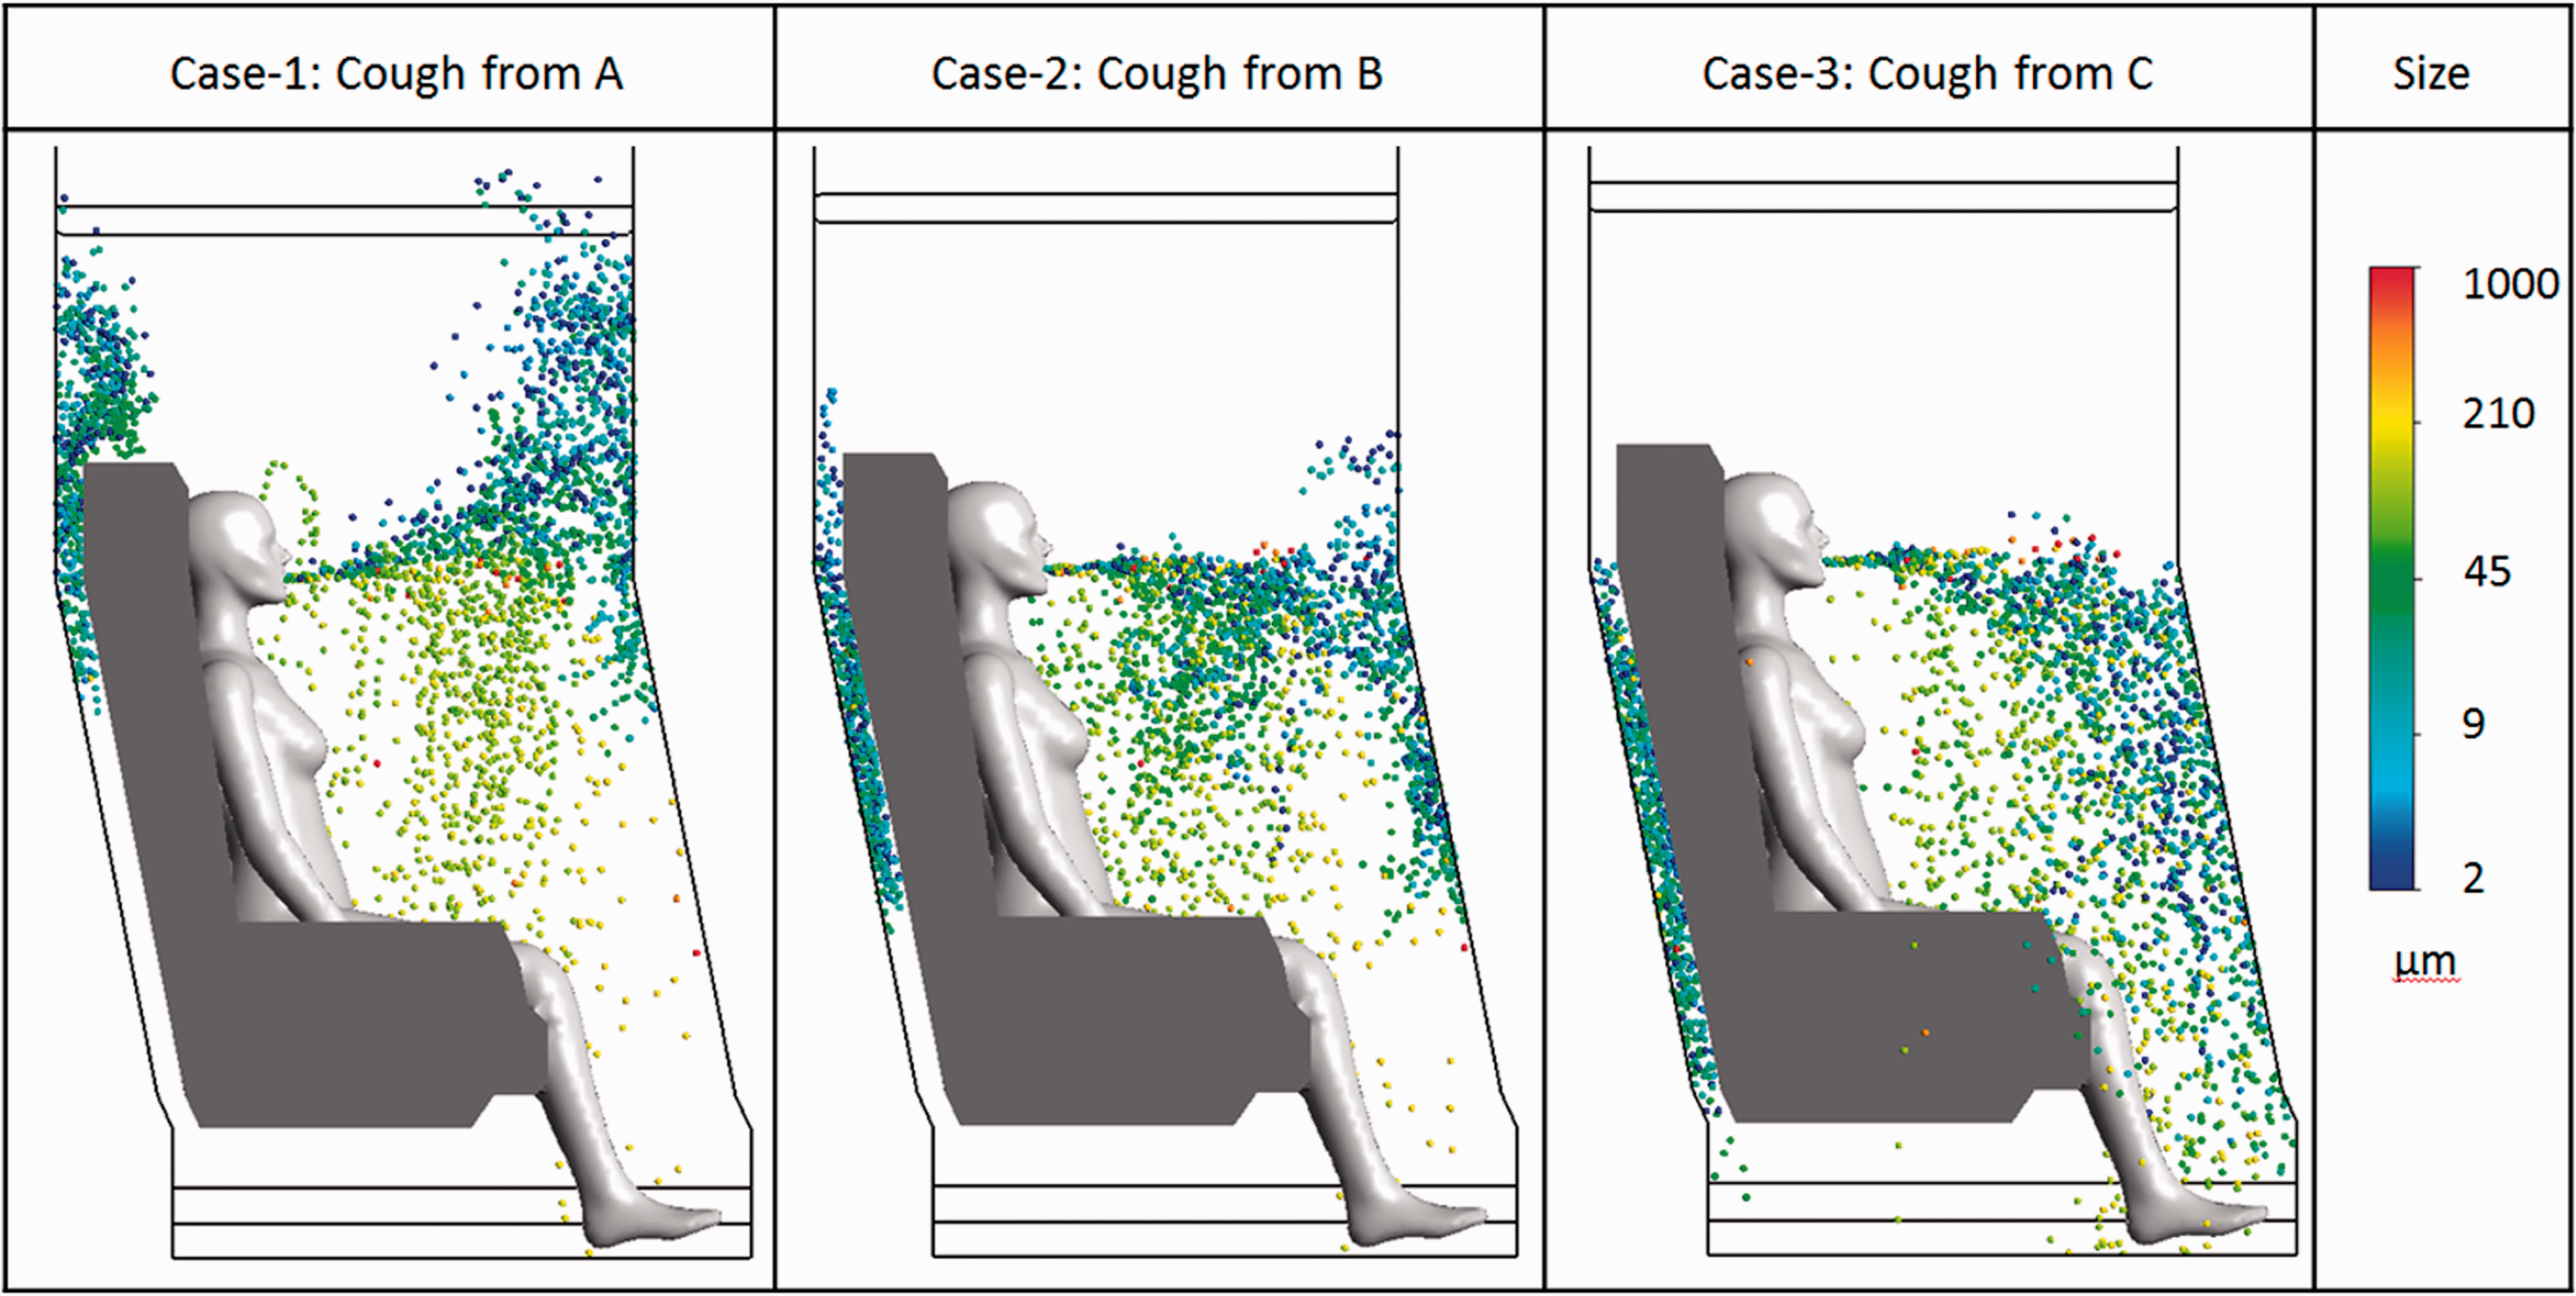
When comparing the distribution of particles with diameter larger than 50 μm, it can be seen that the trajectories of these particles are similar in all three cases. Particles sized between 50 μm and 200 μm fell into the leg and seat area of the coughing passenger following parabola trajectories, immediately after leaving the mouth. The particles with size larger than 200 μm have similar distribution trajectories as particles with size between 50 μm and 200 μm. However, these particles fell further into the shoes area or sunk into the back of front seat. Therefore, a conclusion can be made that cough-jet and cough location have a small effect on the trajectory of particle transport if the diameter of particle is larger than 50 μm.
However, for particles with diameter smaller than 50 μm, the cough-jet and cough location would significantly affect the trajectories of particles. In Case 1, these particles moved forward along with the cough-jet after released by Passenger A, and then changed their direction upwards when they reached the front seat. Case 2 model predicted that the particles with size smaller than 50 μm would mainly join the cough-jet ended by sticking on to the front seat. Similar to Case 2, these particles were carried by the cough-jet to the lower region of the front seat. Overall, the trajectories of particles in this size range were similar to the flow pattern as shown in Figure 9.
The main reason for why the small droplets and the large droplets travelled through significantly different trajectories can be explained by the Lagrangian method. In Lagrangian approach, small droplets were dominated by the drug force caused by airflow, while large droplets were dominated by the gravity caused by self-weight. Based on the above discussion, the droplets with size larger than 50 μm were mainly deposited in the leg area of the coughing passenger. Therefore, even these large droplets may have higher probability of spreading disease, they were mainly descended in a short time and could not be transported into other passenger's breathing zone. It can be concluded that in the simulation of cough, it may only need considering the droplets with size smaller than 50 μm.
According to Figure 6, under a given airflow field, the transport and distribution characteristics of exhaled particles were highly sensitive to the location of release. Therefore, the health risk impacted by the particles released by a sick passenger on other passengers may be different. In order to achieve a quantitative result of exposure risk assessment, the residence time of the particle in each manikin's breathing zone was analysed. The average residence time of the particles exhaled by a passenger into other passengers' breathing zone is illustrated in Figure 10. It was clear that the residence time of the particle is sensitive to both the location of release and the interested breathing zone. According to Figure 10, the particles exhaled by Passenger A had longer residence time than those exhaled by Passengers B and C. The longest residence time of particle appeared in Passenger B's own breathing zone could be as long as 10.2 s. Comparatively, the particles released by Passenger C are more easily carried on by the airflow. The computations also revealed the residence time of the particles in Passenger B's breathing zone when the particles were released by Passenger A, which was around 6.2 s. Such a long residence time of particle indicated poor ventilation in Passenger B's breathing zone; therefore, in order to minimize the risks thus caused, the personalized ventilation was strongly recommended for Passenger B.
Average particle residence time in passengers' breathing zones.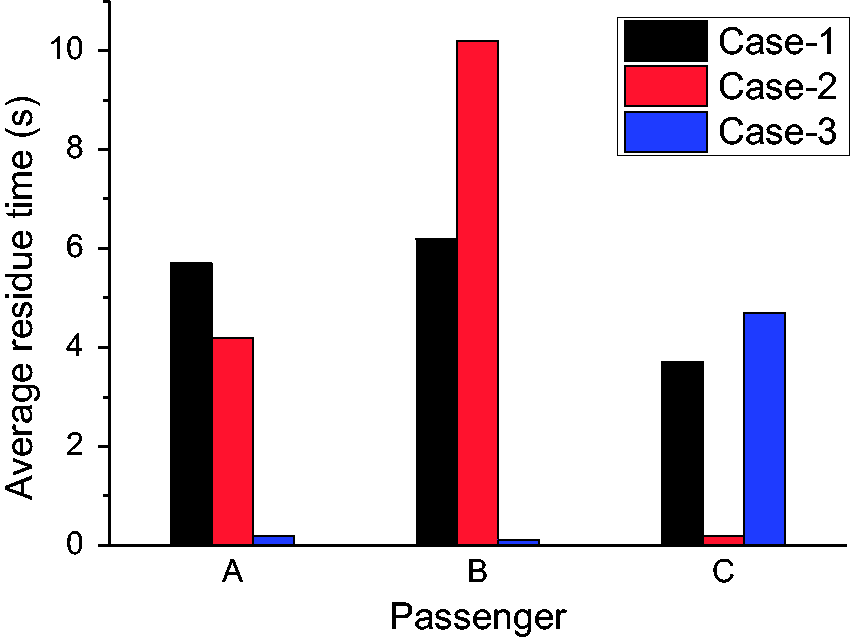
Conclusions
This study investigated the effects of cough-jet on airflow field and transport characteristics of droplets in an airliner cabin section. Simulations are conducted by considering coughing as a transient generated process and one cough consists of different droplet size and number. By comparing numerical results with experiment data, the prediction accuracy of the proposed numerical approach was validated. The conclusions yielded from this study are summarized as follows.
Cough-jet has significant effects on air flow in front of cough passenger in a short period of time. In the time region of 0–0.5 s and the distance from mouth less than 0.45 m, the cough-jet dominates the airflow. After this period, the effects of the cough-jet gradually decreases, ended by the airflow coming back to the steady state.
The simulation results of the droplet distribution by considering the cough-jet model have significant differences when compared to that without considering the cough-jet model. The most obvious difference was that particles were carried away by ventilation flow immediately after being released from the mouth in without cough-jet model situation, while in applying cough-jet model condition, the particles were dominated by the cough-jet flow until the effects of the cough-jet were decreased after a certain time and distance from the mouth.
Similar with a calm indoor environment, 26 the distribution process of the droplet was affected by the size in airliner cabin. For particles with diameter larger than 50 μm, the gravity caused by self-weight dominated the particle motion, while drug force caused by airflow dominated the motion of particles with size smaller than 50 μm.
However, due to the computational costs and real situation complexity, this study has some research limitations. Firstly, this simulation was based on one typical airline cabin. Thus, the influence of cabin geometry difference has not been considered. Also, the cough-jet data applied in this simulation were the average value of 28 persons' experimental results. The individual differences may also lead to different results. For future studies, some specific case investigations are recommended.
Footnotes
Declaration of conflicting interests
The author(s) declared no potential conflicts of interest with respect to the research, authorship, and/or publication of this article.
Funding
The author(s) disclosed receipt of the following financial support for the research, authorship, and/or publication of this article: Financial supports provided by the Natural Science Foundation of China (NSFC, Grant No. 21277080), the Australian Cooperative Research Centre for Rail Manufacturing (RMCRC, Project ID R3.6.1) and Australian Government Research Training Program Scholarship are gratefully acknowledged.