
Abstract
With the passage of time for chemical operations involving packed-bed reactors, especially in petroleum refining and petrochemical industries, non-filterable fines such as coke, corrosion products and fine clay in oilsands bitumen deposit on the catalyst particles. The gradual entrapment and deposition of fine particles of range 0.7–20 µm cause the pore-plugging phenomenon to occur which consequently blocks the flow passages inside the porous medium. To understand the plugging phenomenon and its effect on hydrodynamic of the reactor, we developed a computational fluid dynamics model which is based on reactor collection efficiency, filtration rate, Brownian motion and interfacial momentum exchange terms to simulate the pressure drop due to deposition of fine particles in real conditions. With the help of this model, we have studied the effect of fines deposition on bed porosity and clogging. This is for the first time that Ansys Fluent has been used to simulate fine-particle deposition in packed-bed conditions. The result was a Eulerian–Eulerian 2-D computational fluid dynamics model which considered all the three phases, i.e. liquid, catalyst and fine particles. The results were validated against the experiments reported in the literature and reached good agreement.
Introduction
Application of granular bed for water treatment can be traced back as early as 200 BC 1 where waste water passed over the grains and the small suspended particles deposited onto the grains during the process of water purification. However, fine particles deposition is not always a desirable phenomenon, e.g. for trickle-bed reactors, deposition of fine particles reactors has most unwanted effect in petrochemical industries which badly affect the performance of the reactors. In trickle-bed reactors, the catalysts are placed fixed in the long vertical column, and the gas–liquid stream is allowed to pass through them while accompanying chemical change. These reactors are designed in such a way that maximum contact could be made between the flowing feed and the catalysts to increase the conversion rate while maintaining the constant pressure difference across the reactor length. However, it remains a big challenge to maintain the pressure difference in the trickle-bed reactors due to the deposition of fine particles onto the catalyst. These non-filterable fine particles are either the coke particles produced inside the reactors, 2 organic precipitates 3 , or these are the iron sulfide particles which are produced as a result of equipment corrosion. 4 However, the most important source of these particles is the fine clay which is accompanied by the liquid feed. 5 The particles are usually of order <20 µm and cannot be trapped in the upstream filters. Although the concentration of these fines is much less, yet over the period of time, they start to get depositing onto the catalysts. This, in turn, blocks the small pores between the catalysts through which particle–liquid stream flows and consequently clogging process begins. In normal conditions, Deep Bed Filtration (DBF) is mainly considered to be responsible for clogging in trickle-bed reactors. DBF increases the pressure drop through the reactor to a limit where no more feed can be passed through the catalyst and plant has to shut down even before the catalyst loses its chemical activity. Not only that the plant shut down affects production, but it also accompanies losses due to replacement of the costly catalyst. Although the clogging of the trickle-bed reactor due to fine deposition is highly undesirable, yet it occurs quite frequently in the petrochemical industries.
Contrary to trickle-bed reactors, granular packed beds are usually packed with spherical grains of size 0.6–2 mm with height up to 1 m. The applied velocity of the fluid is less than 1 mm/s. The low velocity of the fluid contributes to the less effective and negligible inertial forces which can be ignored, and Darcy’s law remains applicable. 6 On the other hand, trickle-bed reactors differ from the classic packed-bed reactors due to the size of reactor and catalyst pellet. The catalyst pellet ranges from 1 to 3 mm in size while the height of the reactor can go up to 10 m. However, the main parameter which distinguishes it from classic packed-bed reactors is the high speed flowing gas. This reduces the volume occupied by the liquid phase in trickle-bed reactor, hence increases its velocity up to 0.025 m/s where Darcy’s law remains invalidated to estimate hydrodynamics of the flow. 7 Thus, deposition dynamics becomes more complex for flow in trickle-bed reactors.
Even though trickle-bed reactors are of high importance in hydrotreating and hydrocracking processes where trickle-bed operation is considered as the backbone of the process, relatively very little understanding prevails about the clogging mechanism in trickle-bed reactors as compared to packed-bed reactors with single-phase flow. For single-phase flows in packed-bed reactors, Herzig et al. 8 derived simplified basic kinetic equations for clogging mechanism. O’Melia and Ali 9 investigated the size of suspended particle on the filtration efficiency and found that pressure drop increases with the decrease in the size of suspended particle. One of the first visual studies to investigate the effect of DBF in clogging the reactor was conducted by Payatakes et al. 10 This study was unique as it accounted for the change in pH value and zeta potential in DBF mechanism. Vigneswaran and Tulachan made a deterministic endeavor to formulate empirical relations for suspension of particles in single-phase flow. In this work, a limit of deposition was hypothesized to define the filtration cycle, but due to lack of theoretical knowledge about the empirical constants, the model was ineffective in estimating the hydrodynamics of the DBF as a function of pressure loss. 11 Narayan et al. 12 conducted a systematic experimental study to investigate the effect of suspended particles in a packed-bed with non-aqueous media. They investigated DBF hydrodynamics for both upward and downward flow and found that there was not much difference in the deposition phenomenon for two different cases. However, Reynolds number had a certain effect on deposition and hence on pressure drop. A similar study was performed by Gray et al. 3 who this time conducted similar experiments with fines suspended in multiphase flow. This work suggested that pressure drop increases with increase in the concentration of fine particles in the bed.
To describe deposition of fines in packed beds, a group of Laval University led by F Larachi modeled the DBF phenomenon using Computational Fluid Dynamics (CFD) approach. In the first work, Ortiz-Arroyo et al. 13 performed CFD simulation of DBF with non-aqueous media in granular beds. Macroscopic volume averaged approach was used in this work to model 2-D transient single-phase flow. Deposition of fine particles was modeled with balanced mass and momentum conservation equations. The main contribution of this work was the formulation of the effective specific surface area of the catalyst after deposition which contributes to the rise in pressure drop. The results were in good agreement with experimental data from Narayan et al. 12
Carrying the CFD modeling approach forward, Iliuta et al. 6 performed the CFD modeling of the multiphase flow in trickle-bed reactors. This CFD model was too based on macroscopic volume averaged balanced mass and conservation equations which were solved in 1-D using Euler–Euler scheme. They expressed the filter coefficient in terms of collector efficiency as proposed by Rajagopalan and Tien. 14 This model was formulated both in a single-layer and multilayer filter coefficient and its effect on pressure increase was investigated. The results were validated against the experimental outcomes of Gray et al., 3 and reasonable agreement was reached.
The effect of superficial gas velocity on trickle-bed hydrodynamics under filtration condition was investigated by Edouard and Iliuta. 15 The experiments were based on kaolin/kerosene suspension. Kaolin makeup was periodically mixed in the reservoir. They found that specific deposit in the trickle-bed reactor decreased with comparatively low gas superficial velocity. Their results showed that filter coefficient changed rapidly with specific deposit and liquid holdup, which is affected by superficial gas velocity. A new correlation was established to mark dependence of filtration rate on liquid holdup in filtration condition.
In order to get the first-hand information of the hydrodynamics inside the trickle-bed reactor, Hamidipour et al. 16 applied Electrical Capacitance Tomography (ECT) imaging technique on trickle-bed reactors under filtration condition. ECT imaging technique proved to be useful in determining the transition point of flow regime from pulse to trickle due to clogging. According to the observations made in work, fine deposition in the trickle-bed reactors rises with an increase in liquid or gas superficial velocity.
At the moment, there is no any expressive or deterministic model available to fully understand the hydrodynamics of the trickle-bed reactor during clogging. The first step in simulating the hydrodynamics of trickle-bed reactor in filtration condition might be to get a fundamental understanding of granular packed-bed reactor. This study is an effort in this direction which can be further extended to model filtration condition in trickle-bed reactor. Also, this is the first time that filtration condition in granular packed bed is modeled in Ansys Fluent. Not only that this work is a potential contribution to the hydrodynamics of clogging in trickle-bed reactor, but it can also be seen as an endeavor to simulate wastewater treatment in granular packed beds.
Experimental data
In this study, the experiment conducted by Narayan et al. 12 has been used to validate the CFD model. This experiment was the first systematic approach to study the effect of fine deposition on the hydrodynamics of granular bed. A vertical bed of height 0.3 m and diameter 25.4 mm was filled with spherical particles (glass bead or Ni–Mo γ-alumina catalyst) to simulate as granular bed. Kerosene was selected as primary fluid for its stability and similarity of chemical properties with the hydrocarbons used in packed-bed operations in petrochemical industries. Similarly, carbon black particles of size 8 µm were used for their similar chemical properties to the in situ coke particles in industrial reactors. The carbon black particles were mixed with kerosene and its concentration was determined by spectrophotometry. First, kerosene was allowed to pass through the bed column with adding carbon particles, and pressure drop through the packed-bed column was determined. Once steady state was reached, treated carbon black particles were added to kerosene. The experiment was allowed to run for several hours while specific deposit was measured by the difference of carbon black concentration at inlet and outlet of the reactor.
Different aspects of plugging phenomenon were made subject to study in this work, and mainly the effect of Reynolds number on pressure drop and the specific deposit was investigated. Different experimental flow conditions were tested, e.g. effect of upward and downward flow in the reactor, variable influent concentration with single- and multi-pass flow, specific deposit in various regions of the bed, change in collector efficiency and filter coefficient with liquid superficial velocity. The study shows that effect of liquid superficial velocity has great influence on the particle deposition and pressure drop. Also, filter coefficient and collector efficiency were found to be sensitive to the liquid Reynolds number.
Summary of experimental conditions used for CFD modeling.
Governing equations
Under the assumptions described in the previous section, the CFD model was formulated for two conditions: clean bed condition and then under filtration bed condition after reaching steady state.
Clean bed condition
Conservation of volume in terms of volume fraction occupied by collectors (solids), and liquid is given as

In fluent, discrete solid phase particles of the collectors were assumed to be pseudo-continuous, and solid phase was patched inside the reactor column with certain fraction governed by the bed porosity. The velocity of collectors was fixed to remain zero throughout the reactor.
Continuity of mass for the collector is expressed as

Similarly, for liquid phase, mass continuity can be written as

For liquid without any entrained particle, momentum conservation is governed by the equation in Euler formulation as


Also, Fls, the interaction force between liquid and solid, is taken from the Ergun’s equation which is given by

The above equation was programmed in C-language and was introduced in Fluent default Navier–Stokes equation using user defined function.
Bed under filtration condition
After running the simulation for clean bed condition until it reached the steady state, the fine particles were introduced at the inlet of the reactor. As the fine particles flow through the reactor with the fluid, depending on filter coefficient, the concentration of particle decreases with the flow and it starts getting deposited onto the collector surface. Here, it is assumed that attached particles are converted into the solid phase while accompanying loss in mass to the fine particles. This way, the mass lost by the particles is balanced by the increase in the mass of collector by the same proportion. Thus, the porosity of the reactor is changed from ɛ to ɛn.
Now, under filtration conditions, conservation of volume is given as

Here forward subscript n is used for the new respective modified parameter due to fine deposition. For liquid, continuity under filtration condition is

Similarly, for fine particles, mass conservation is governed by the equation

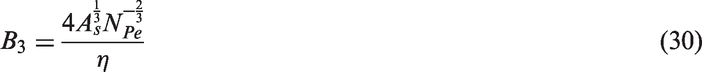
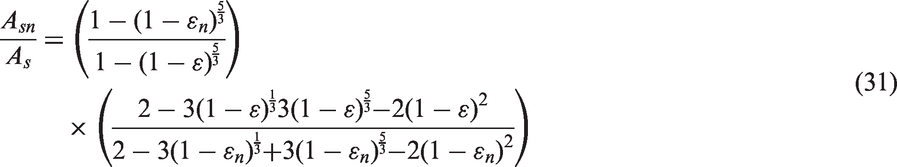
For collectors, continuity becomes

For liquid phase, momentum conservation is given as
Special considerations for momentum exchange and mass transfer
It can be noted from the mass conservation equations that as the particles flow through the packed bed, they start losing mass. The rate of this lost mass is proportional to filtration rate, N. Conversely, same amount of mass is added to the collector. This filtration rate depends on the concentration of the particles in the fluid and contributes to the mass transfer phenomenon.
For momentum conservation equations, deposition of the fine particles effects the hydrodynamics of the reactor by changing the two parameters:
The increase in the diameter of the collector. The decrease in porosity of the bed.
Interestingly, as can be seen in Ergun’s equation, an increase in diameter decreases the pressure drop of the reactor while a decrease in bed porosity causes the overall pressure drop to increase. However, after an increase in diameter of the collector, the whole surface area does not contribute in momentum exchange. There arises the need of formulation of the new effective diameter to estimate true hydrodynamics of flow in a granular bed.
In short, under filtration condition, mass conservation depends on filtration rate while momentum conservation relies on effective collector size. We have discussed both these parameters in detail in upcoming sections.
Filtration rate
The rate of filtration gives the extent at which the fines filter through the collector, or in terms of packed-bed reactors, it determines the amount of fine deposition onto the collector surface. Filtration rate depends on the rate at which specific deposit varies in the bed. Since specific deposit is function of space, hence filtration rate is also a parameter which varies with location in bed and with time. The variables which affect the filtration rate are:
Time Location in the bed (height) Specific deposit Concentration of fines in liquid
Generally, filtration rate is given by
1

Although the above relation is the representative expression for filtration, but during its implementation in CFD modeling, it does not prove to be very useful due to the absence of basic parameters which produces specific deposit in the bed. One such expression of filtration rate which takes into account the basic parameters which produce deposition in the granular bed was given by Iwasaki et al.
17
According to the proposed relation, rate of change in concentration of influent particles decreases with the depth of the bed and depends on the initial concentration. Mathematically, it can be written in dimension z as

The integrated form of the above equation is

Thus, while working in CFD, filtration rate can be written as


The diffusion coefficient 

NR is the interception number given by

NG is the gravity number defined as


As is porosity dependent Happel parameter and is defined as


It should be noted from filtration rate expression that as the fine particles start depositing onto the collector, the probability of the particles to be captured by the granular bed is changed. So, it remains valid until a single layer of fines is deposited onto the collector surface. Once another layer of the fine particles starts depositing onto the already attached fines on the collector, the filter coefficient changes. The new filter coefficient due to deposition is given as
20


Effective collector size for momentum exchange
As described in the previous sections, during the deposition process, a layer of fine particles is deposited onto the collector surface. Consequently, apparent size of collector is increased and porosity of the bed reduces. This new diameter of the collector and porosity of the bed is given by
20


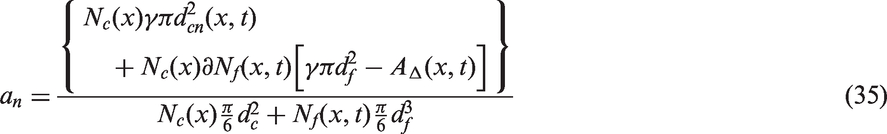
However, it can be observed that the collector geometry which is spherical in the beginning, does not remain spherical anymore after deposition of fine particles. This is because particles do not deposit uniformly on the collector surface. So, the effective diameter of the irregular-shaped collector which contributes to momentum exchange with the fluid is given as

Under filtration condition, the reciprocal of effective diameter is given by
6

Nc is the number of collectors in the grid volume, v, given as

Nf is the number of fine particles captured in the grid volume, v, defined as


β is the cross-section fraction of the collector and is illustrated in Figure 1.
Geometry of single collector with fine deposition.
6
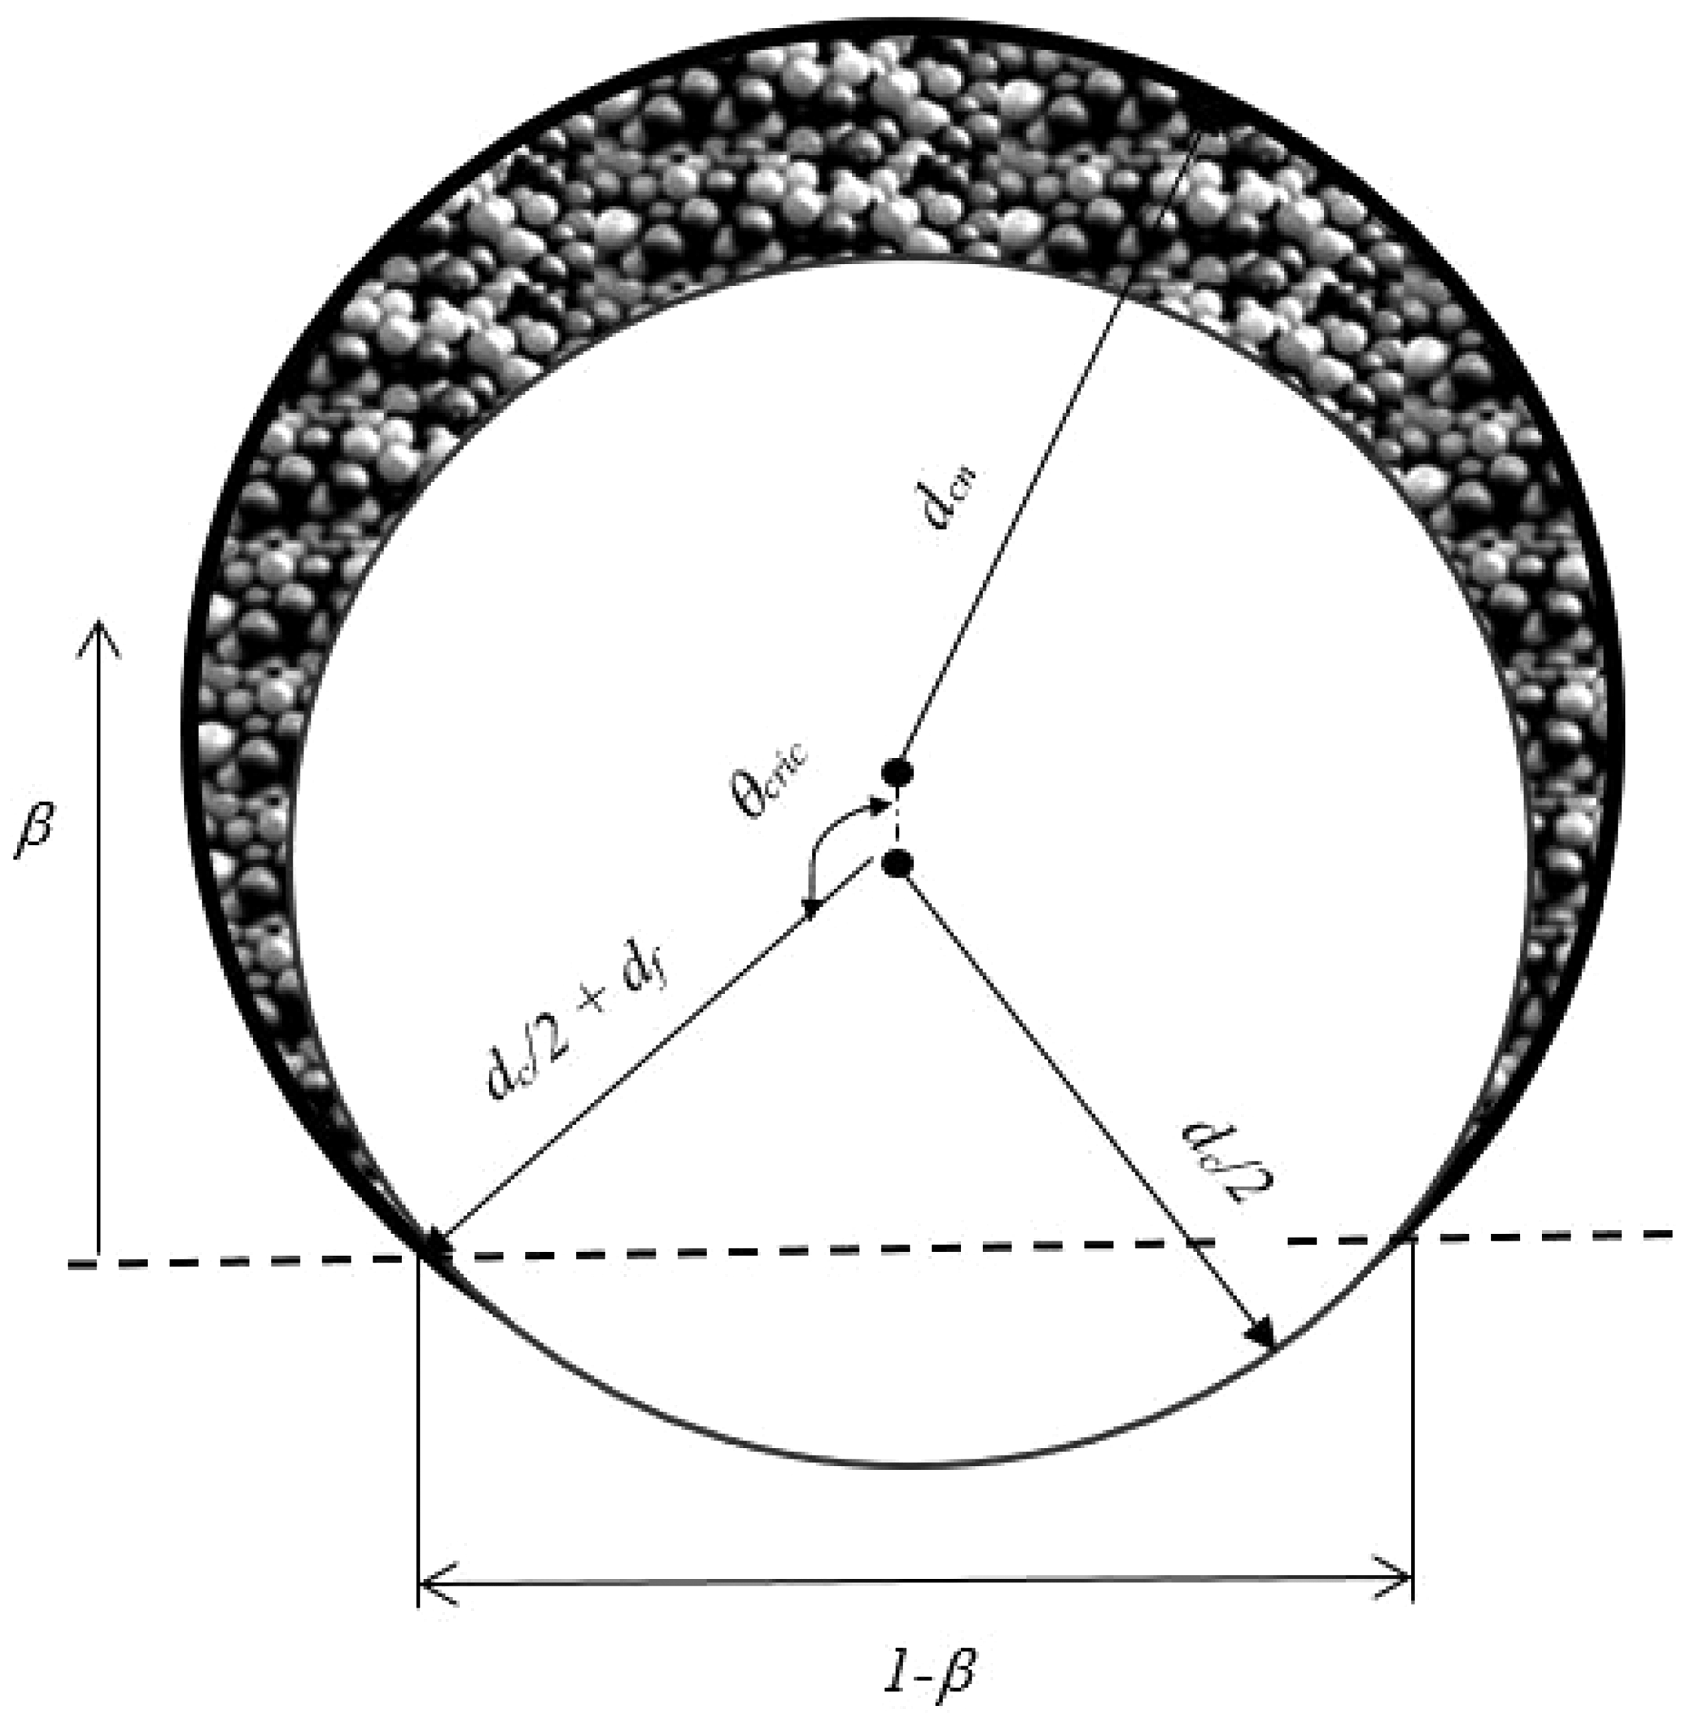
In above expression, β can be calculated as


If 
Development of CFD model
The CFD model was created in commercial CFD package Ansys Fluent (Version 14.0). To the best of our knowledge, no any attempt has been made before to model granular-bed reactor in Ansys Fluent under filtration condition. In the view of the work by Hamidipour et al.
22
where they proved for multiphase flow in packed-bed reactor that same results were obtained both for 3-D and 2-D geometries due to constant bed porosity assumption, to reduce the computational cost, we created 2-D geometry to simulate deposition in homogeneously packed-bed reactor. Thus, a transient Euler–Euler CFD model was developed, based on 2-D geometry. As mentioned in Figure 2, CFD model consisted of two parts. First, a multiphase model consisting of liquid and collectors was formulated without fine particles (i.e. clean bed condition). Euler–Euler scheme was implemented, and the model was run until it reached steady state. Once steady state was reached in clean bed condition, the fines were introduced at the inlet of the reactor. In order to take into account the mass of particles that is lost and is collected by the solid phase (collector), the mass continuity equation was modified. Similarly, due to change in porosity and the effective diameter of the collector, momentum conservation equation was also modified and implemented in default Navier–Stokes equation. The simulation with fine particles was run for elapsed time of 20 h and results were compared with the experimental data.
Schematic of CFD model development for single-phase flow particle deposition.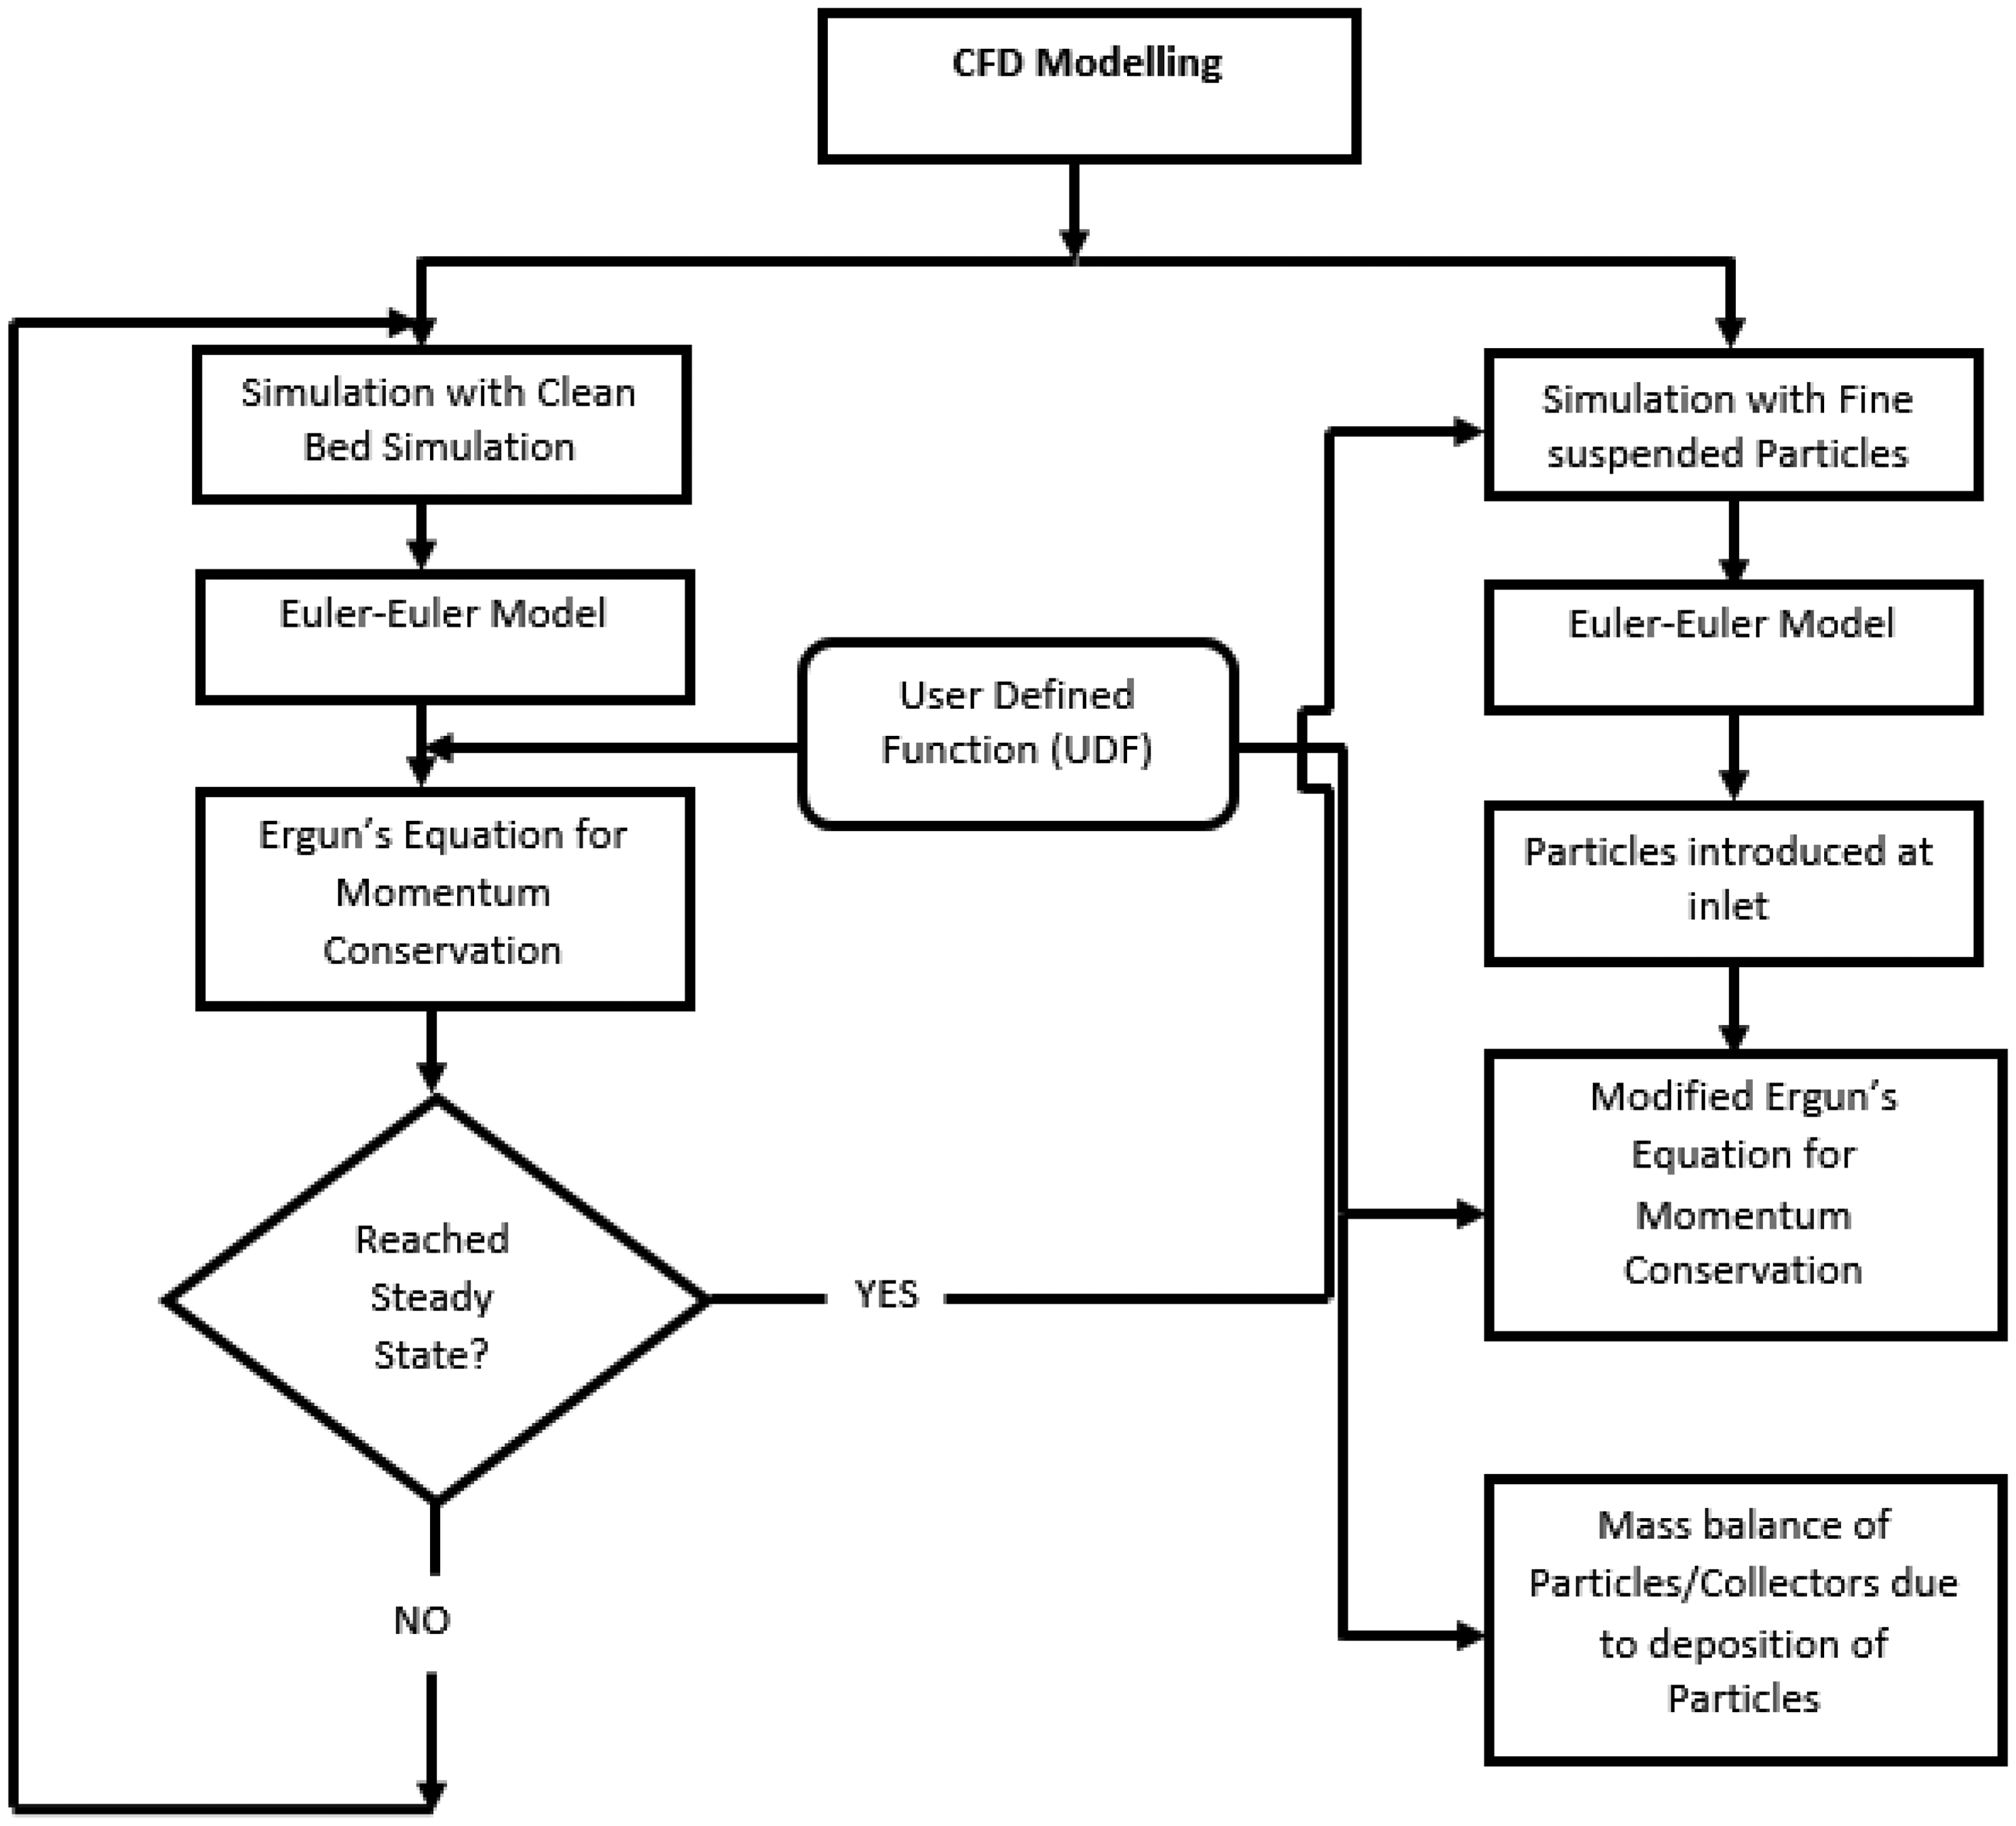
Mesh and solution method
We created a 2-D mesh in Ansys Workbench for the reactor and imported it into Ansys Fluent 14.0. The 2-D mapped-mesh is shown in Figure 3. The space chosen was 2-D planar and multiphase Eulerian–Eulerian model was used. Initial velocity was given a value at inlet while pressure outlet condition was set at the exit of the reactor domain. The no-slip condition was set for the liquid for the walls. Porosity dependent volume fraction of the solids (collector) was patched in the reactor domain while their velocity was forced to remain zero. Numerical scheme of first-order upwind was implemented and pressure–velocity coupling was performed through SIMPLE scheme. The solution was initialized with standard initialization method and time step of size 1 s was set with maximum of 30 iterations per time step. The simulation was run for an elapsed time of 20 h.
Two-dimensional mesh for granular bed.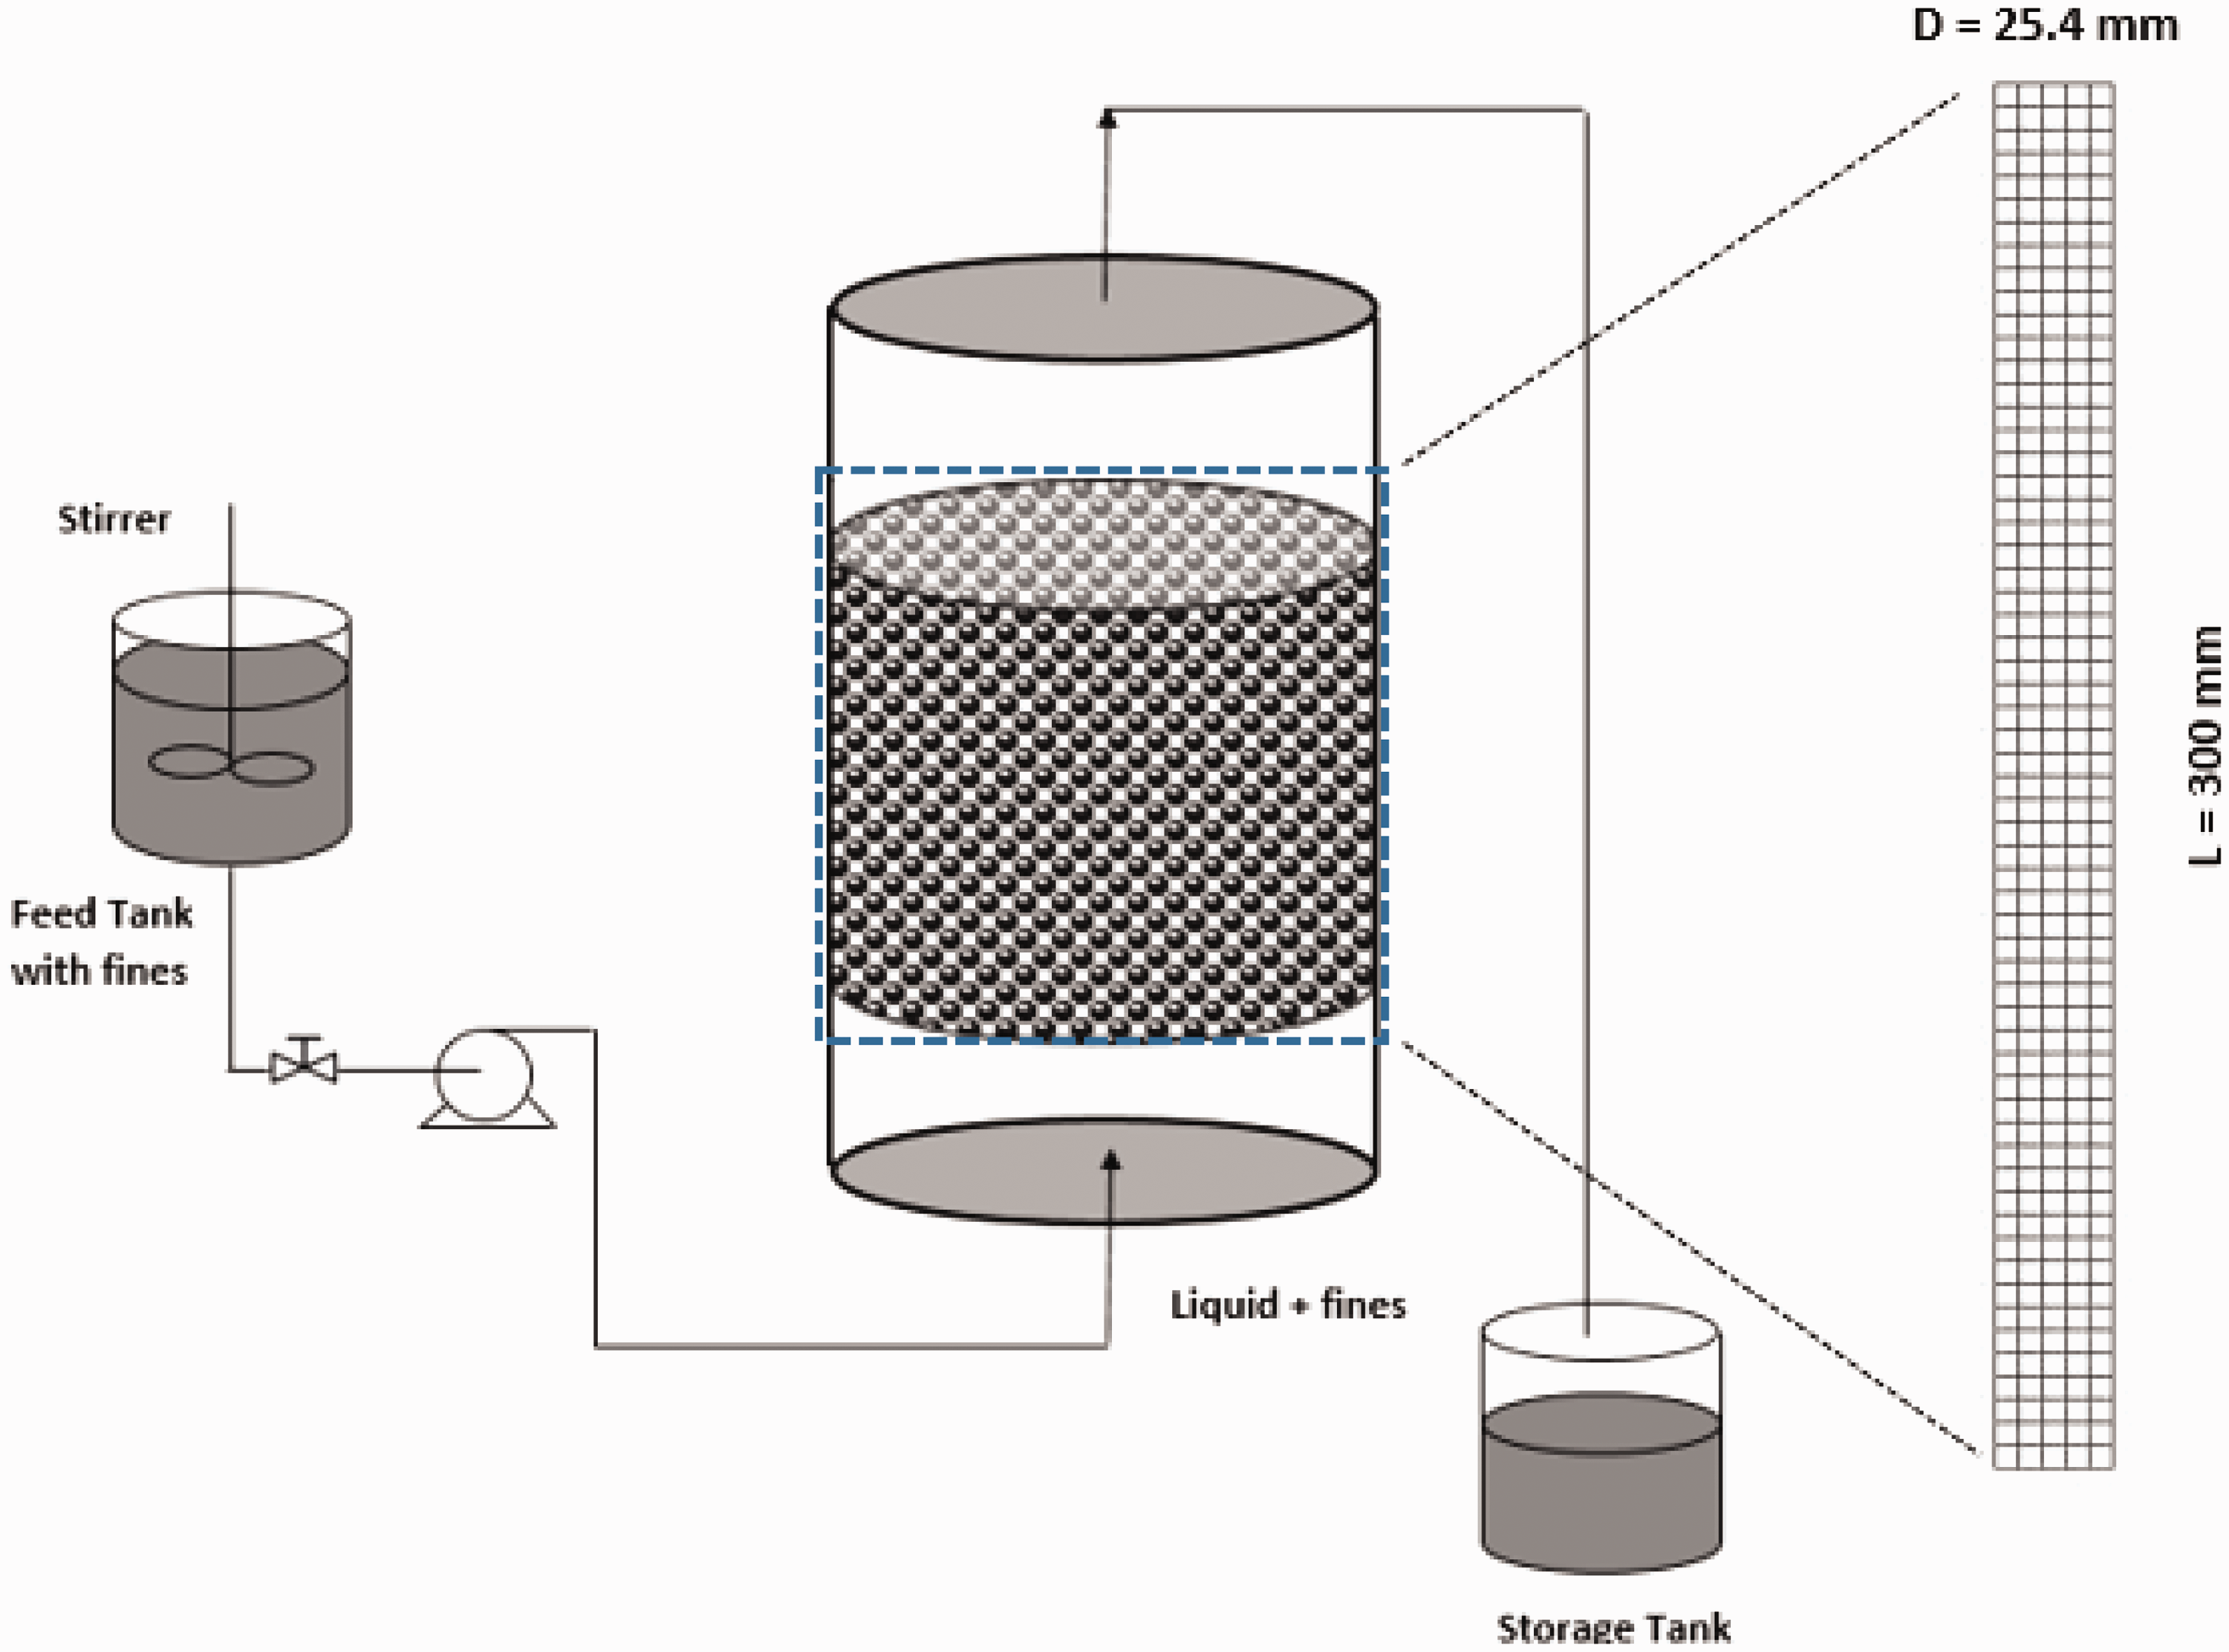
Results
Preliminary results
Initially, pressure drop was determined manually through the Ergun’s equation. As shown in the previous section, considering whole volume of the reactor for volumetric force and in situ conditions, a different form of Ergun’s equation was implemented. To compare the results of pressure drop in CFD model with that of manual calculations, we ran preliminary simulations to find pressure drop without fine particles. Pressure drop was determined for Re = 0.1, 0.25, 0.5, 0.75 and 0.1, and the results were found to be in good agreement with the manual calculations as shown in Figure 4.
Comparison of pressure drop with manual calculation from Ergun’s equation and its implementation in CFD.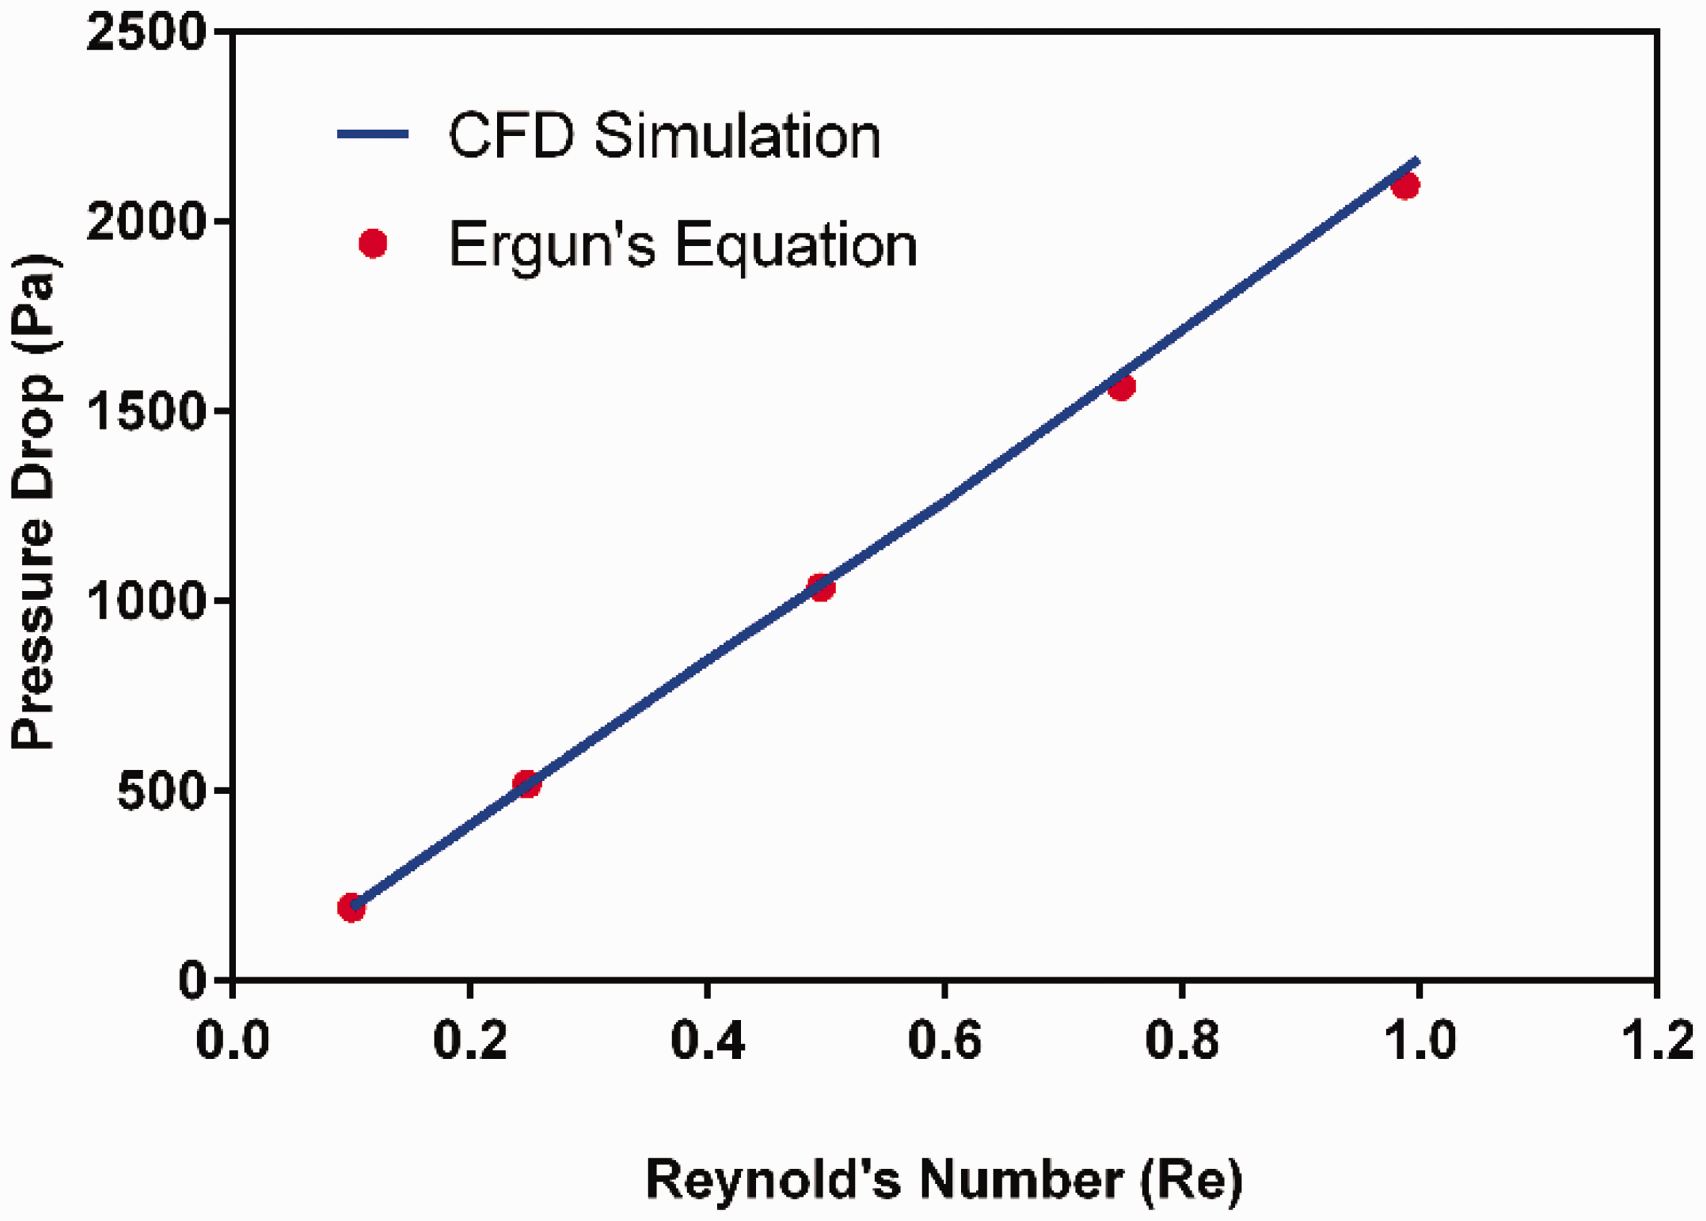
To obtain the grid-independent results, it was necessary to perform grid sensitivity analysis to choose the right grid size for the simulation. We created nine different sized grids with a total number of cells varying as 12, 48, 105, 300, 581, 1180, 2655, 10,620 and 118,100 nos. Pressure drop was determined for each grid size (Figure 5) at Re = 0.1 in clean bed condition. It was observed that pressure tends to increase continuously with fine grid size; however, after grid size of 105 no. of cells, increase in pressure drop was almost negligible (0.1279% increase in pressure from increasing number of cells from 105 to 118,100). Given the negligible associated error and high computational cost to perform simulations with 118,100 no. of cells, we choose grid size of 300 no. of cells to perform simulations presented in this work.
Grid sensitivity at Re = 0.1 in clean bed condition.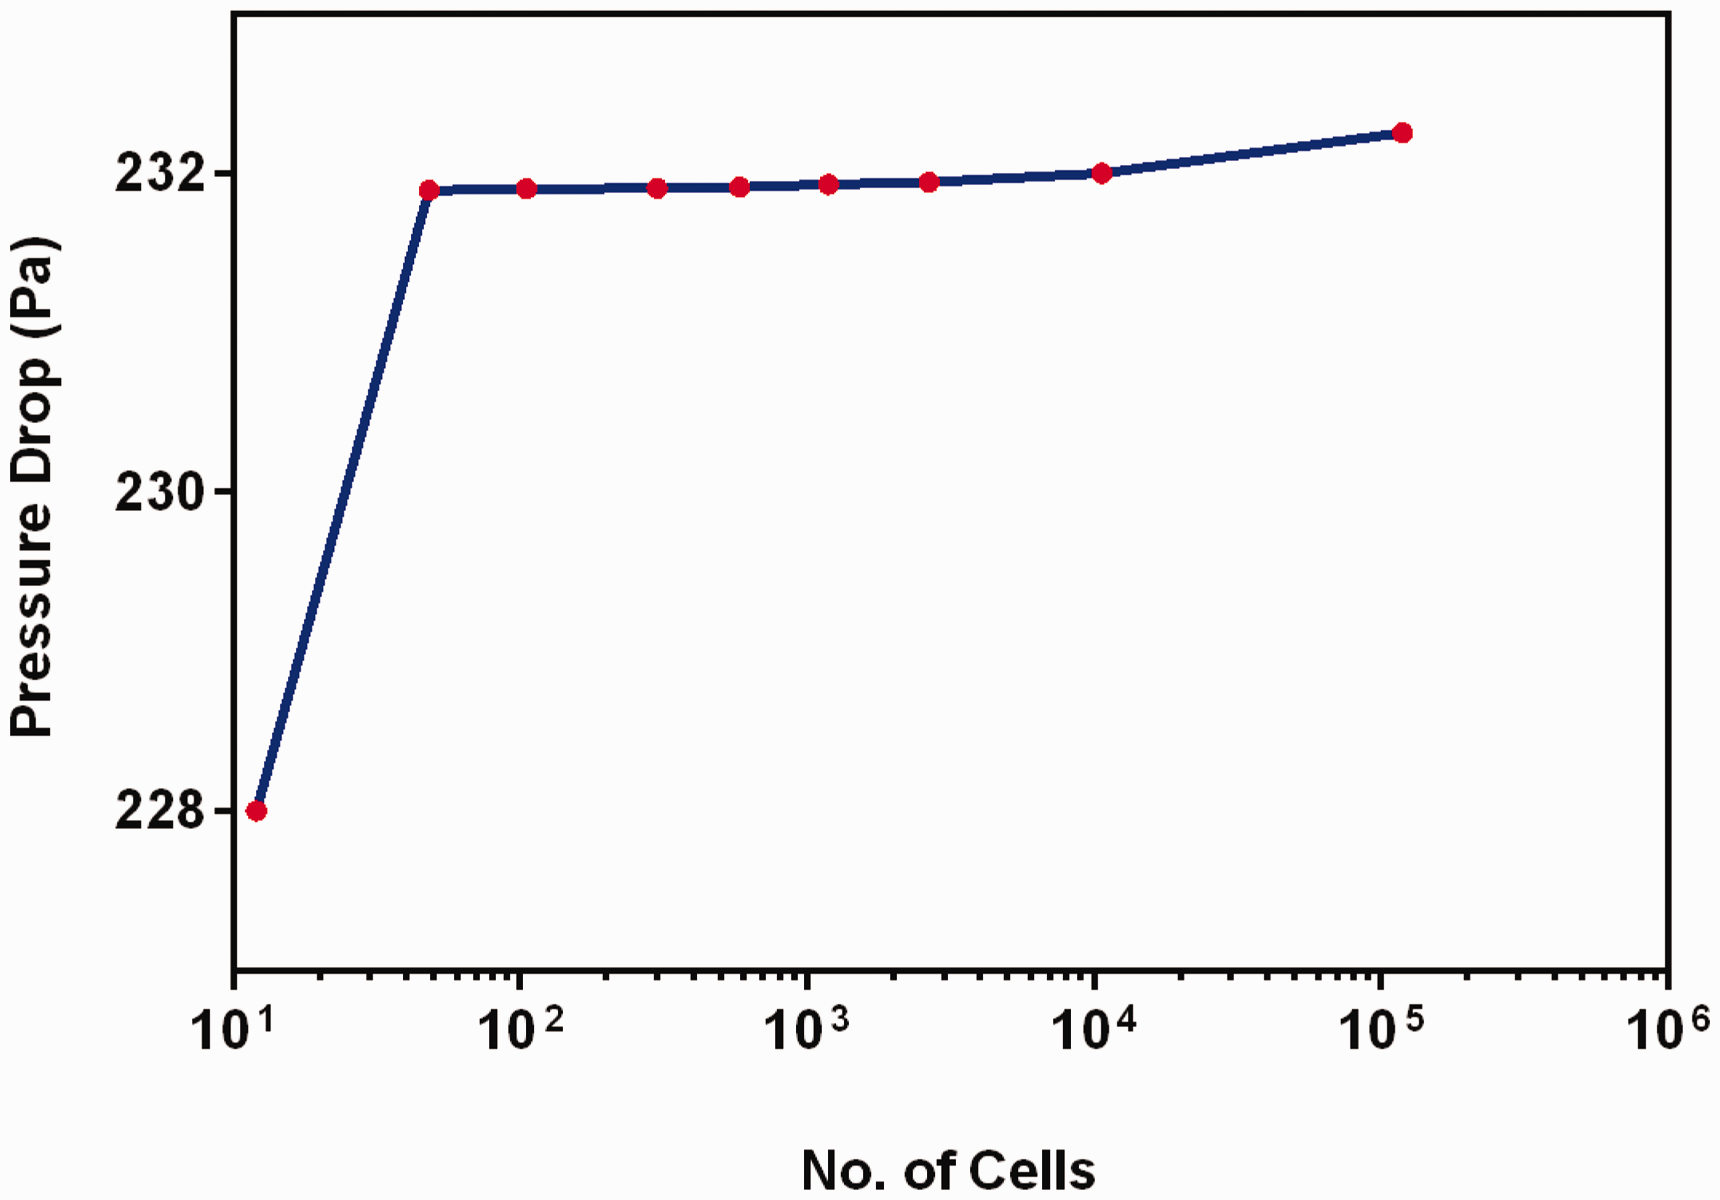
Hydrodynamics under filtration condition
In the previous section, it was established that CFD model could be used to capture the pressure drop in clean bed condition. One of the purposes of this study is to evaluate if we can use CFD model to estimate the increase in pressure drop due to fine deposition and the specific deposit. The simulations were run for two Reynolds numbers, i.e. Re = 0.5 and 1.0, and pressure drop was estimated using the CFD model. We have compared the results for varying increase in pressure with time for different Reynolds numbers in Figures 6 and 7.
Comparison of pressure drop with experiments at Re = 0.5. Comparison of pressure drop with experiments at Re = 1.0.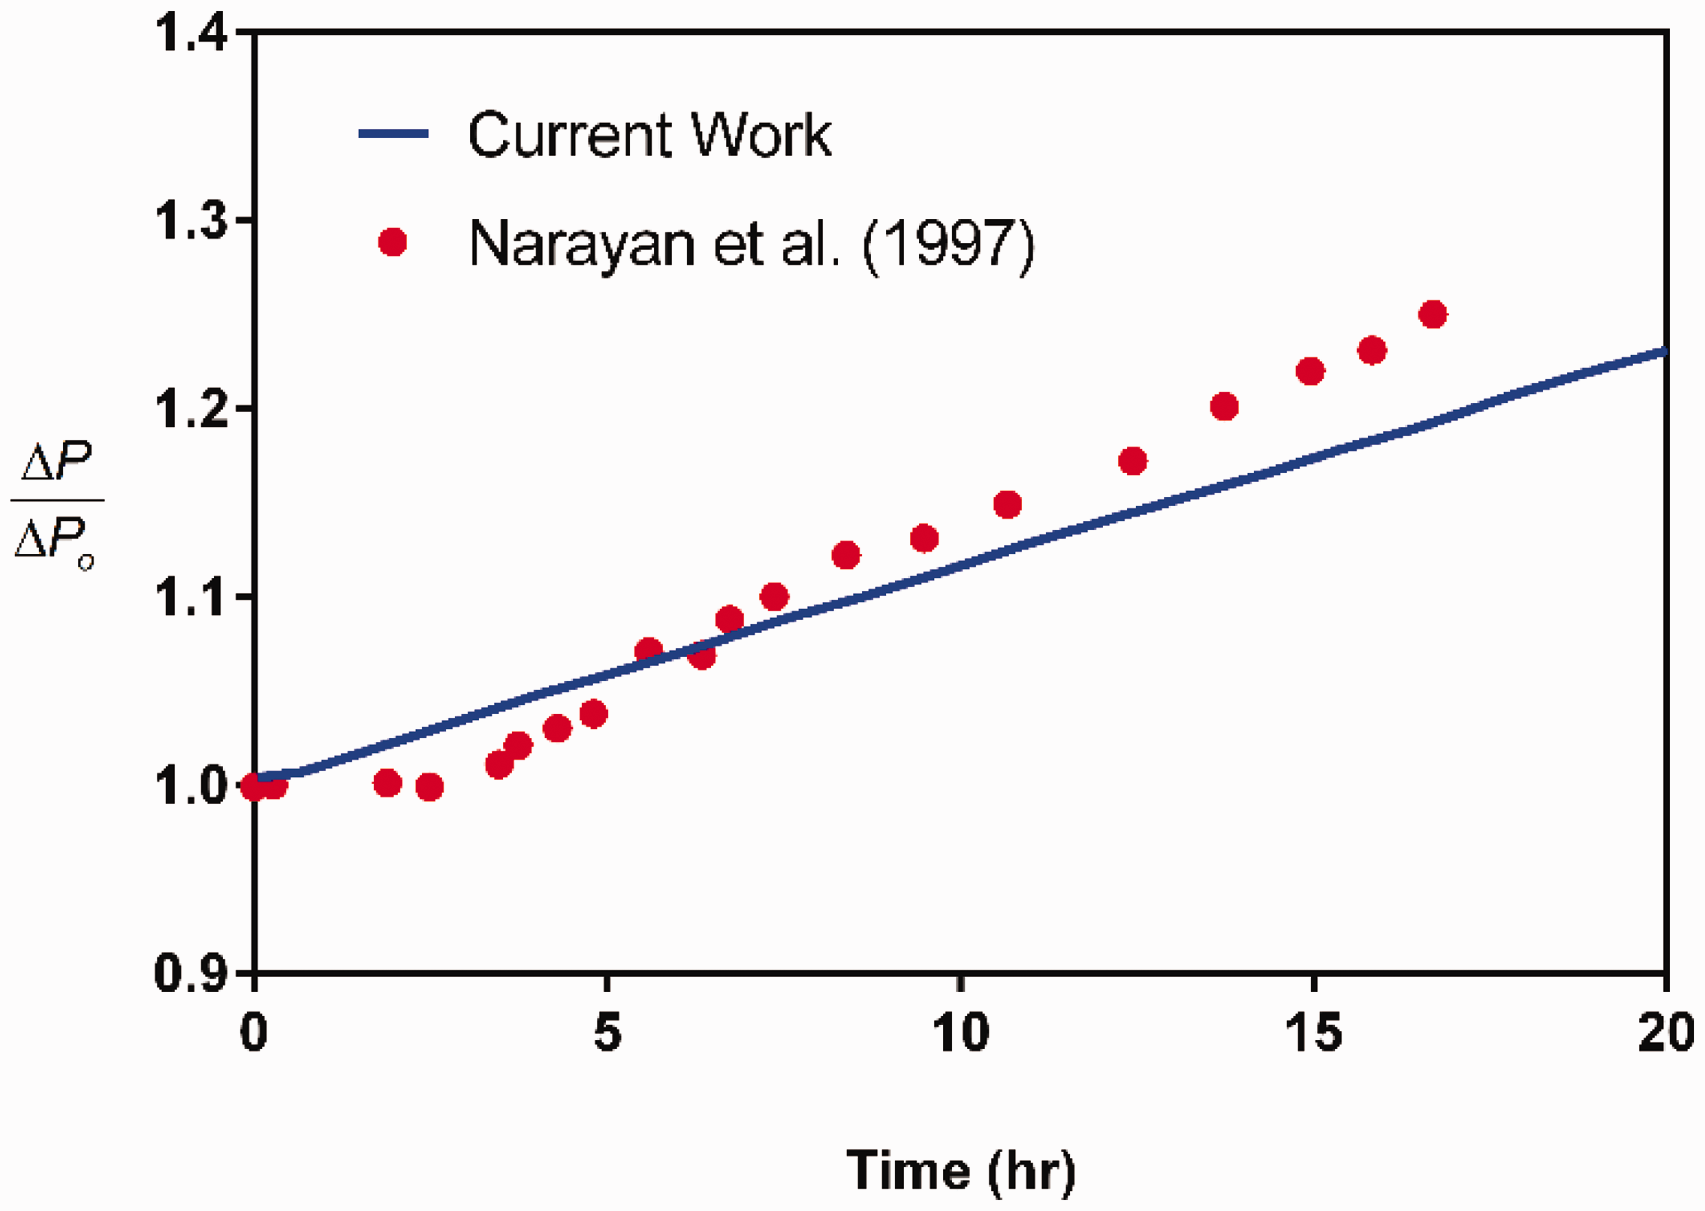
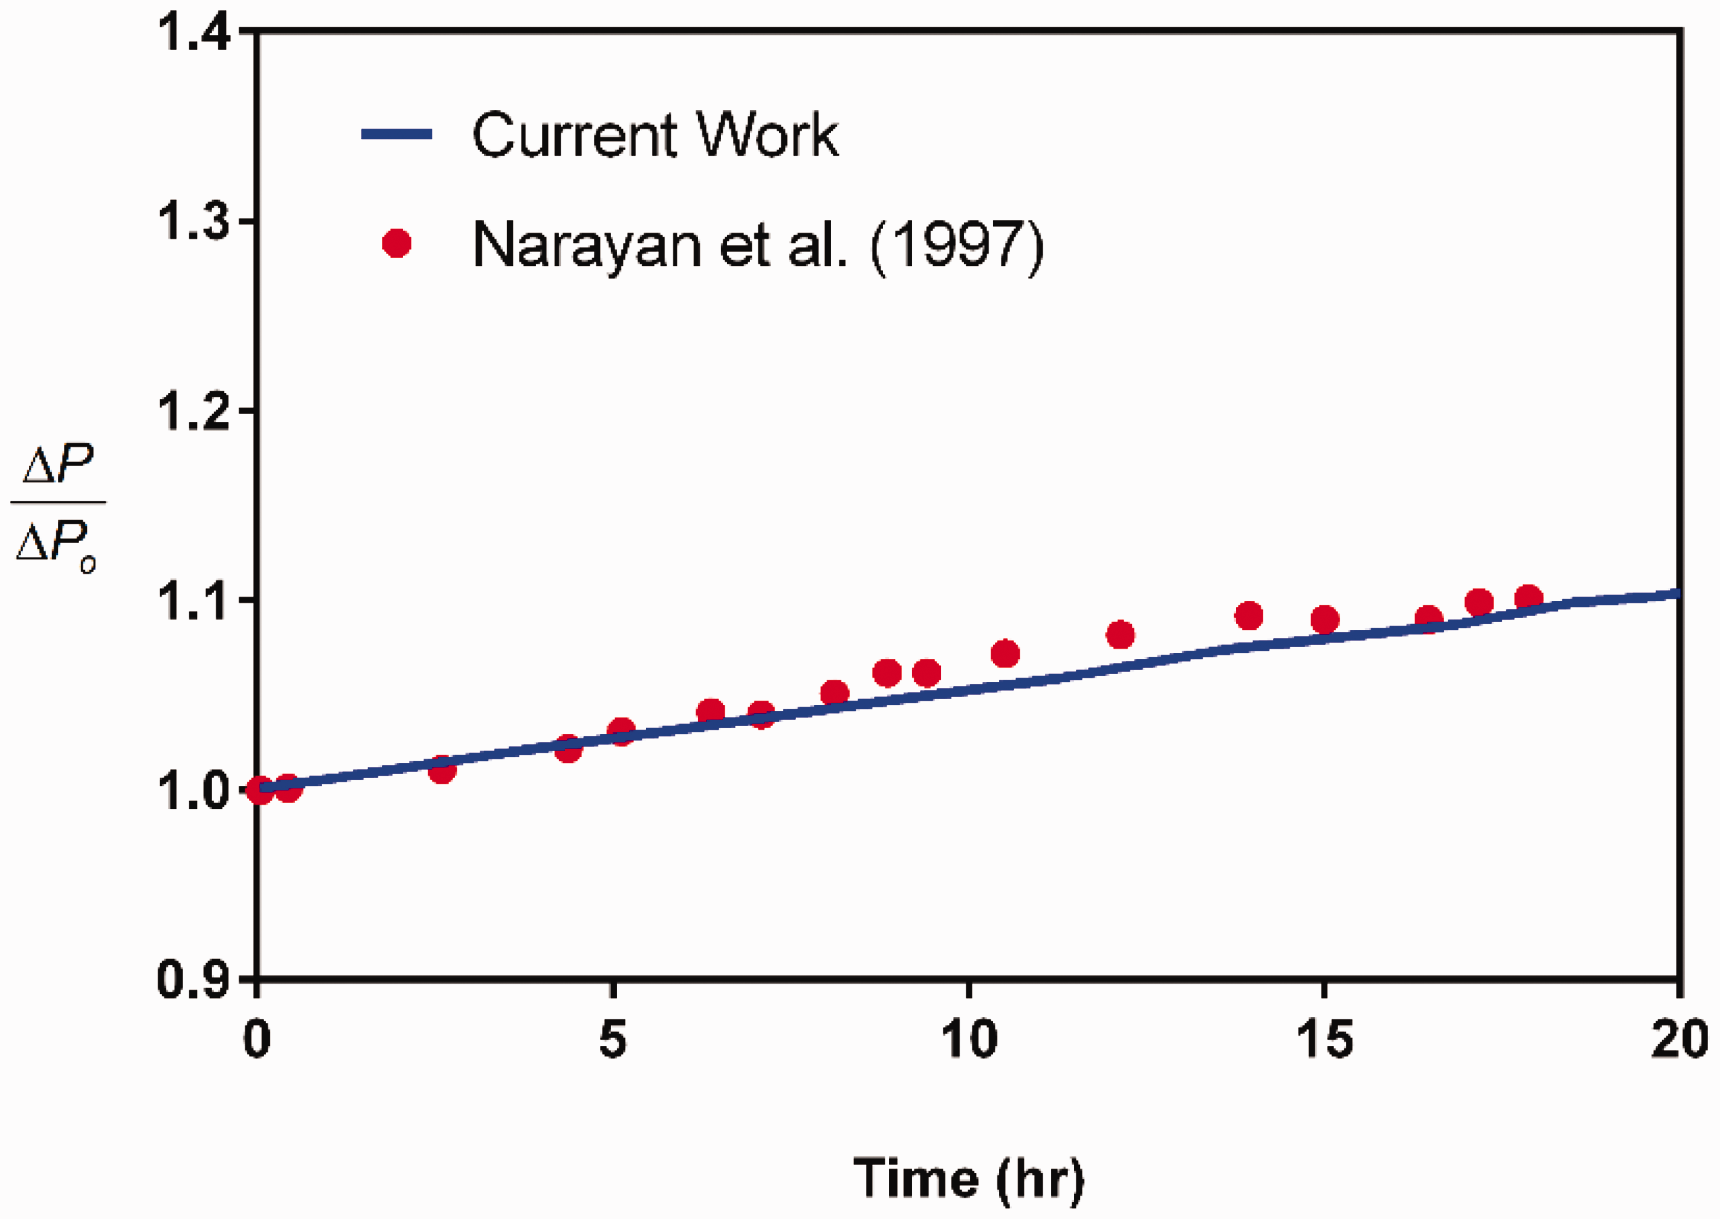
It can be seen from Figures 6 and 7 that the result from CFD simulation seems to match the experimental results well when Reynolds number is relatively high. The variation in porosity can also be seen in Figure 8. It is clear from the figure that porosity is low near the inlet of the reactor due to deposition of the fine particles.
Contours of porosity in the reactor after 20 h at Re = 1.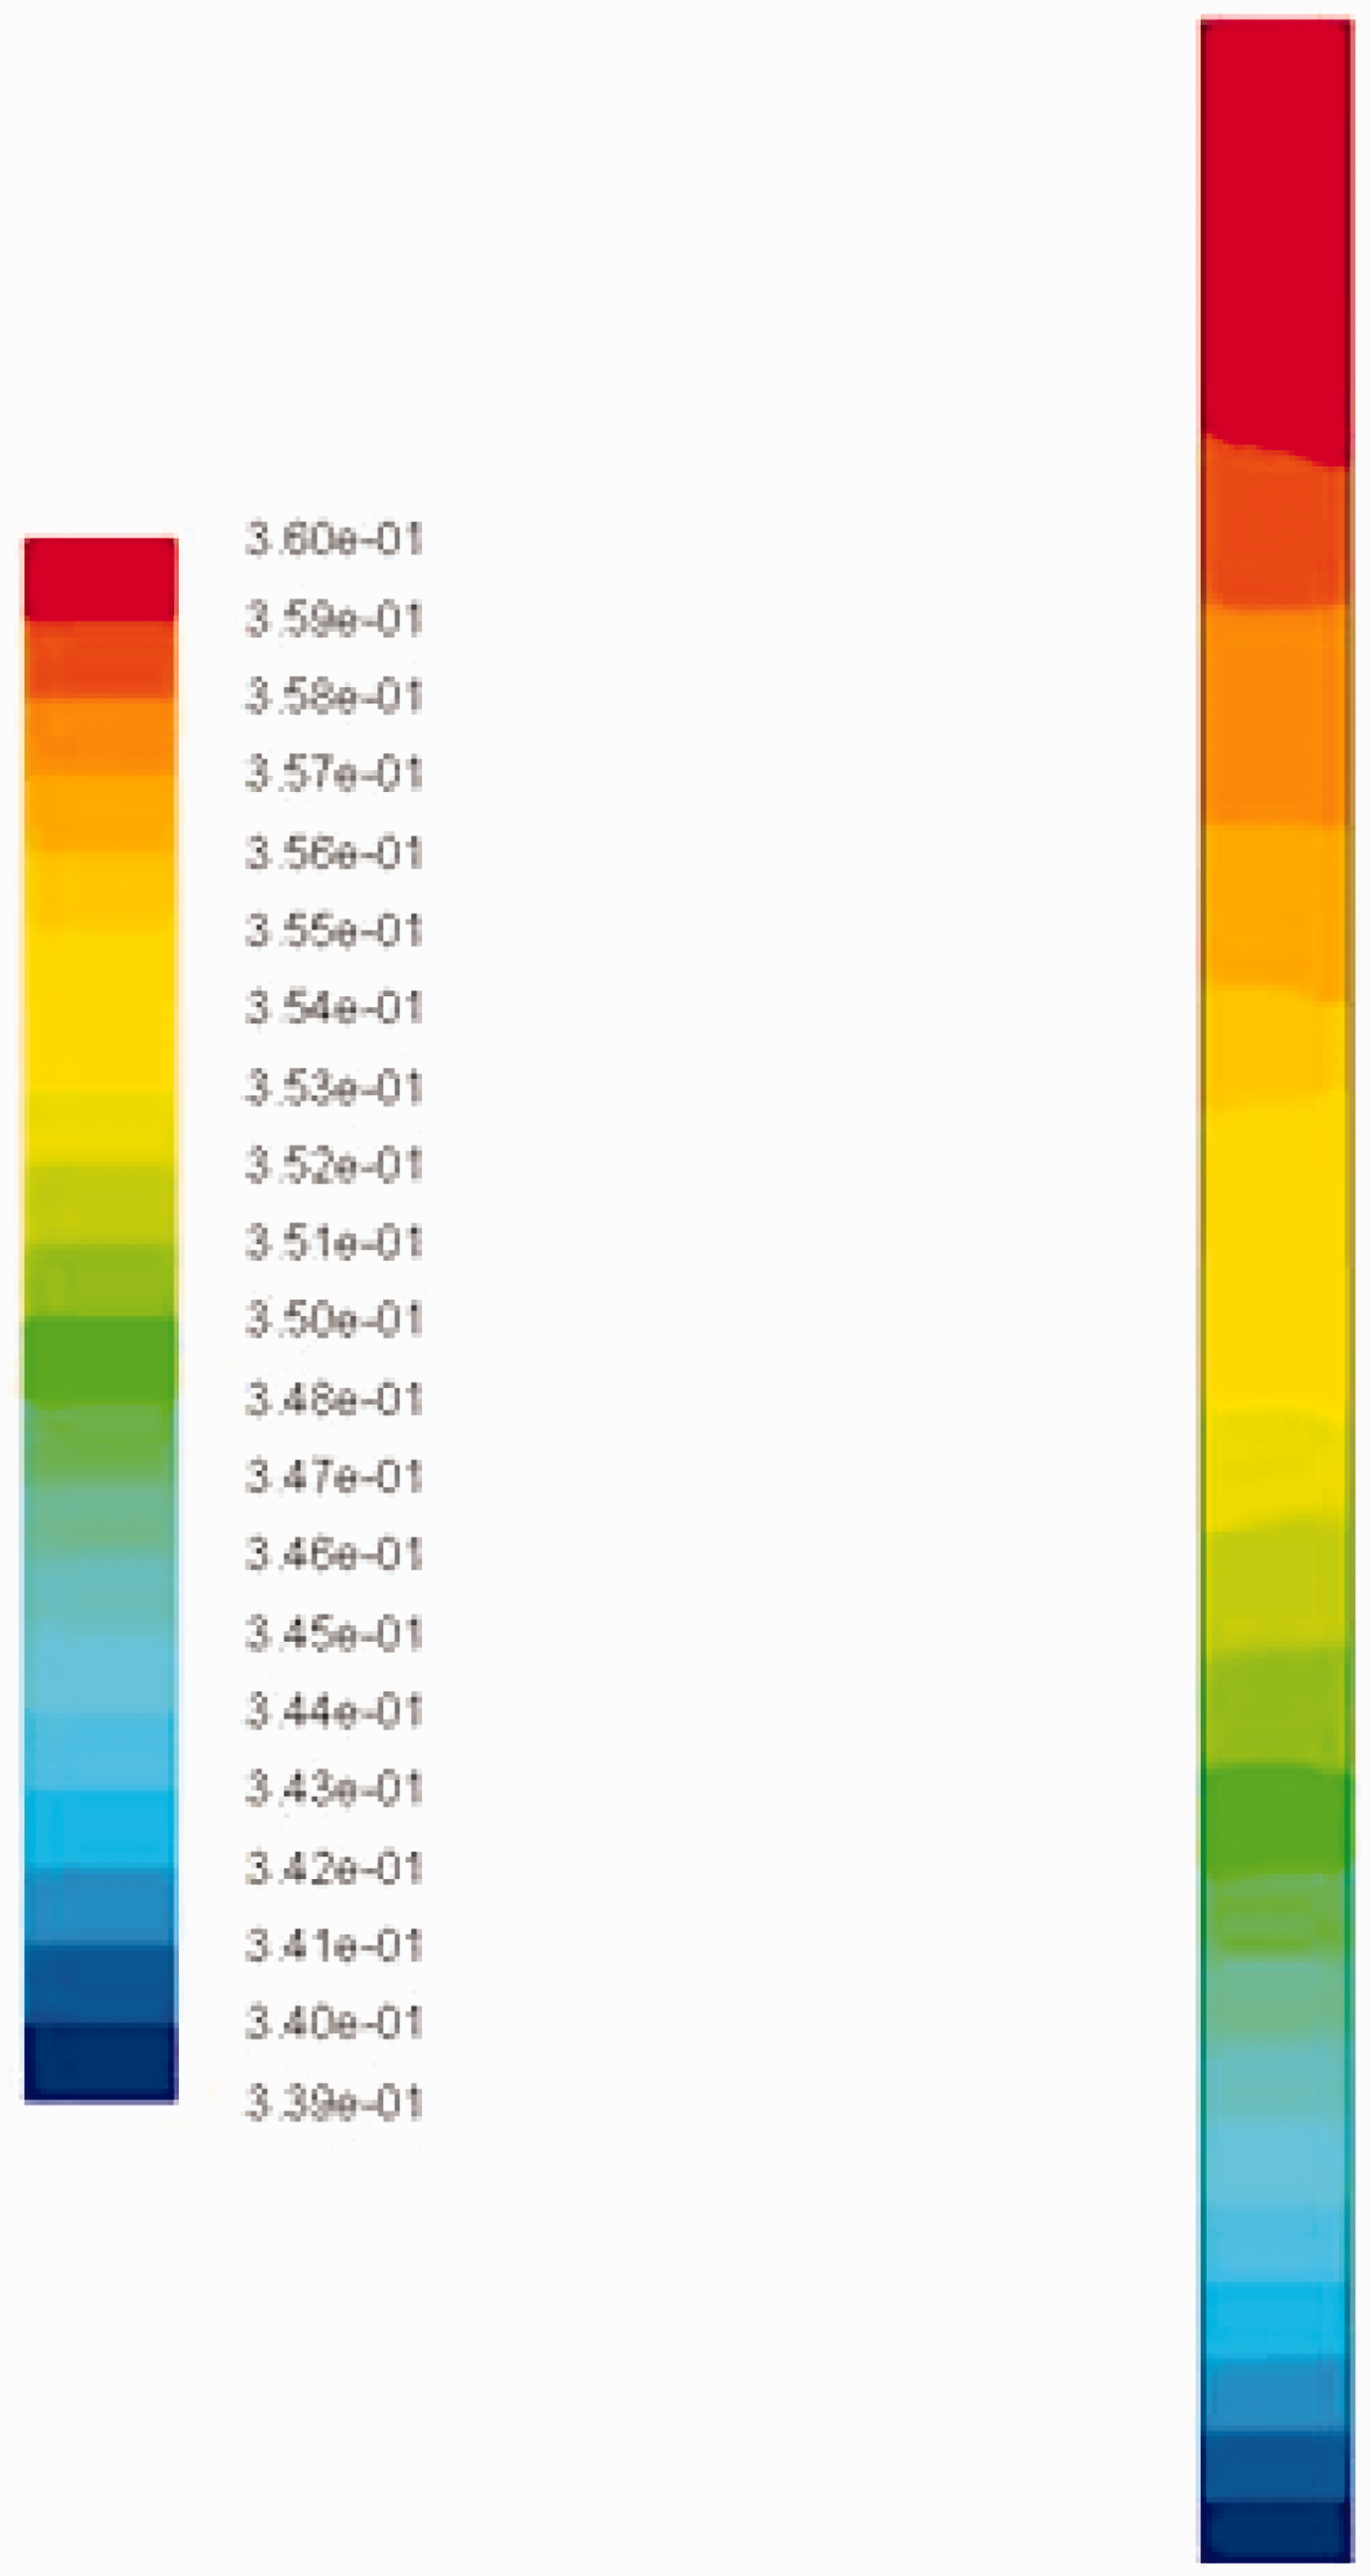
As the particles flow through the reactor, their concentration reduces due to their conversion into collector. This phenomenon is evident from Figure 9 where the concentration of the particles is high near the inlet. As the flow passes through the reactor, they are deposited onto the collector, and volume fraction in the reactor reduces.
Contours of volume fraction of particles in the reactor after 20 h at Re = 1.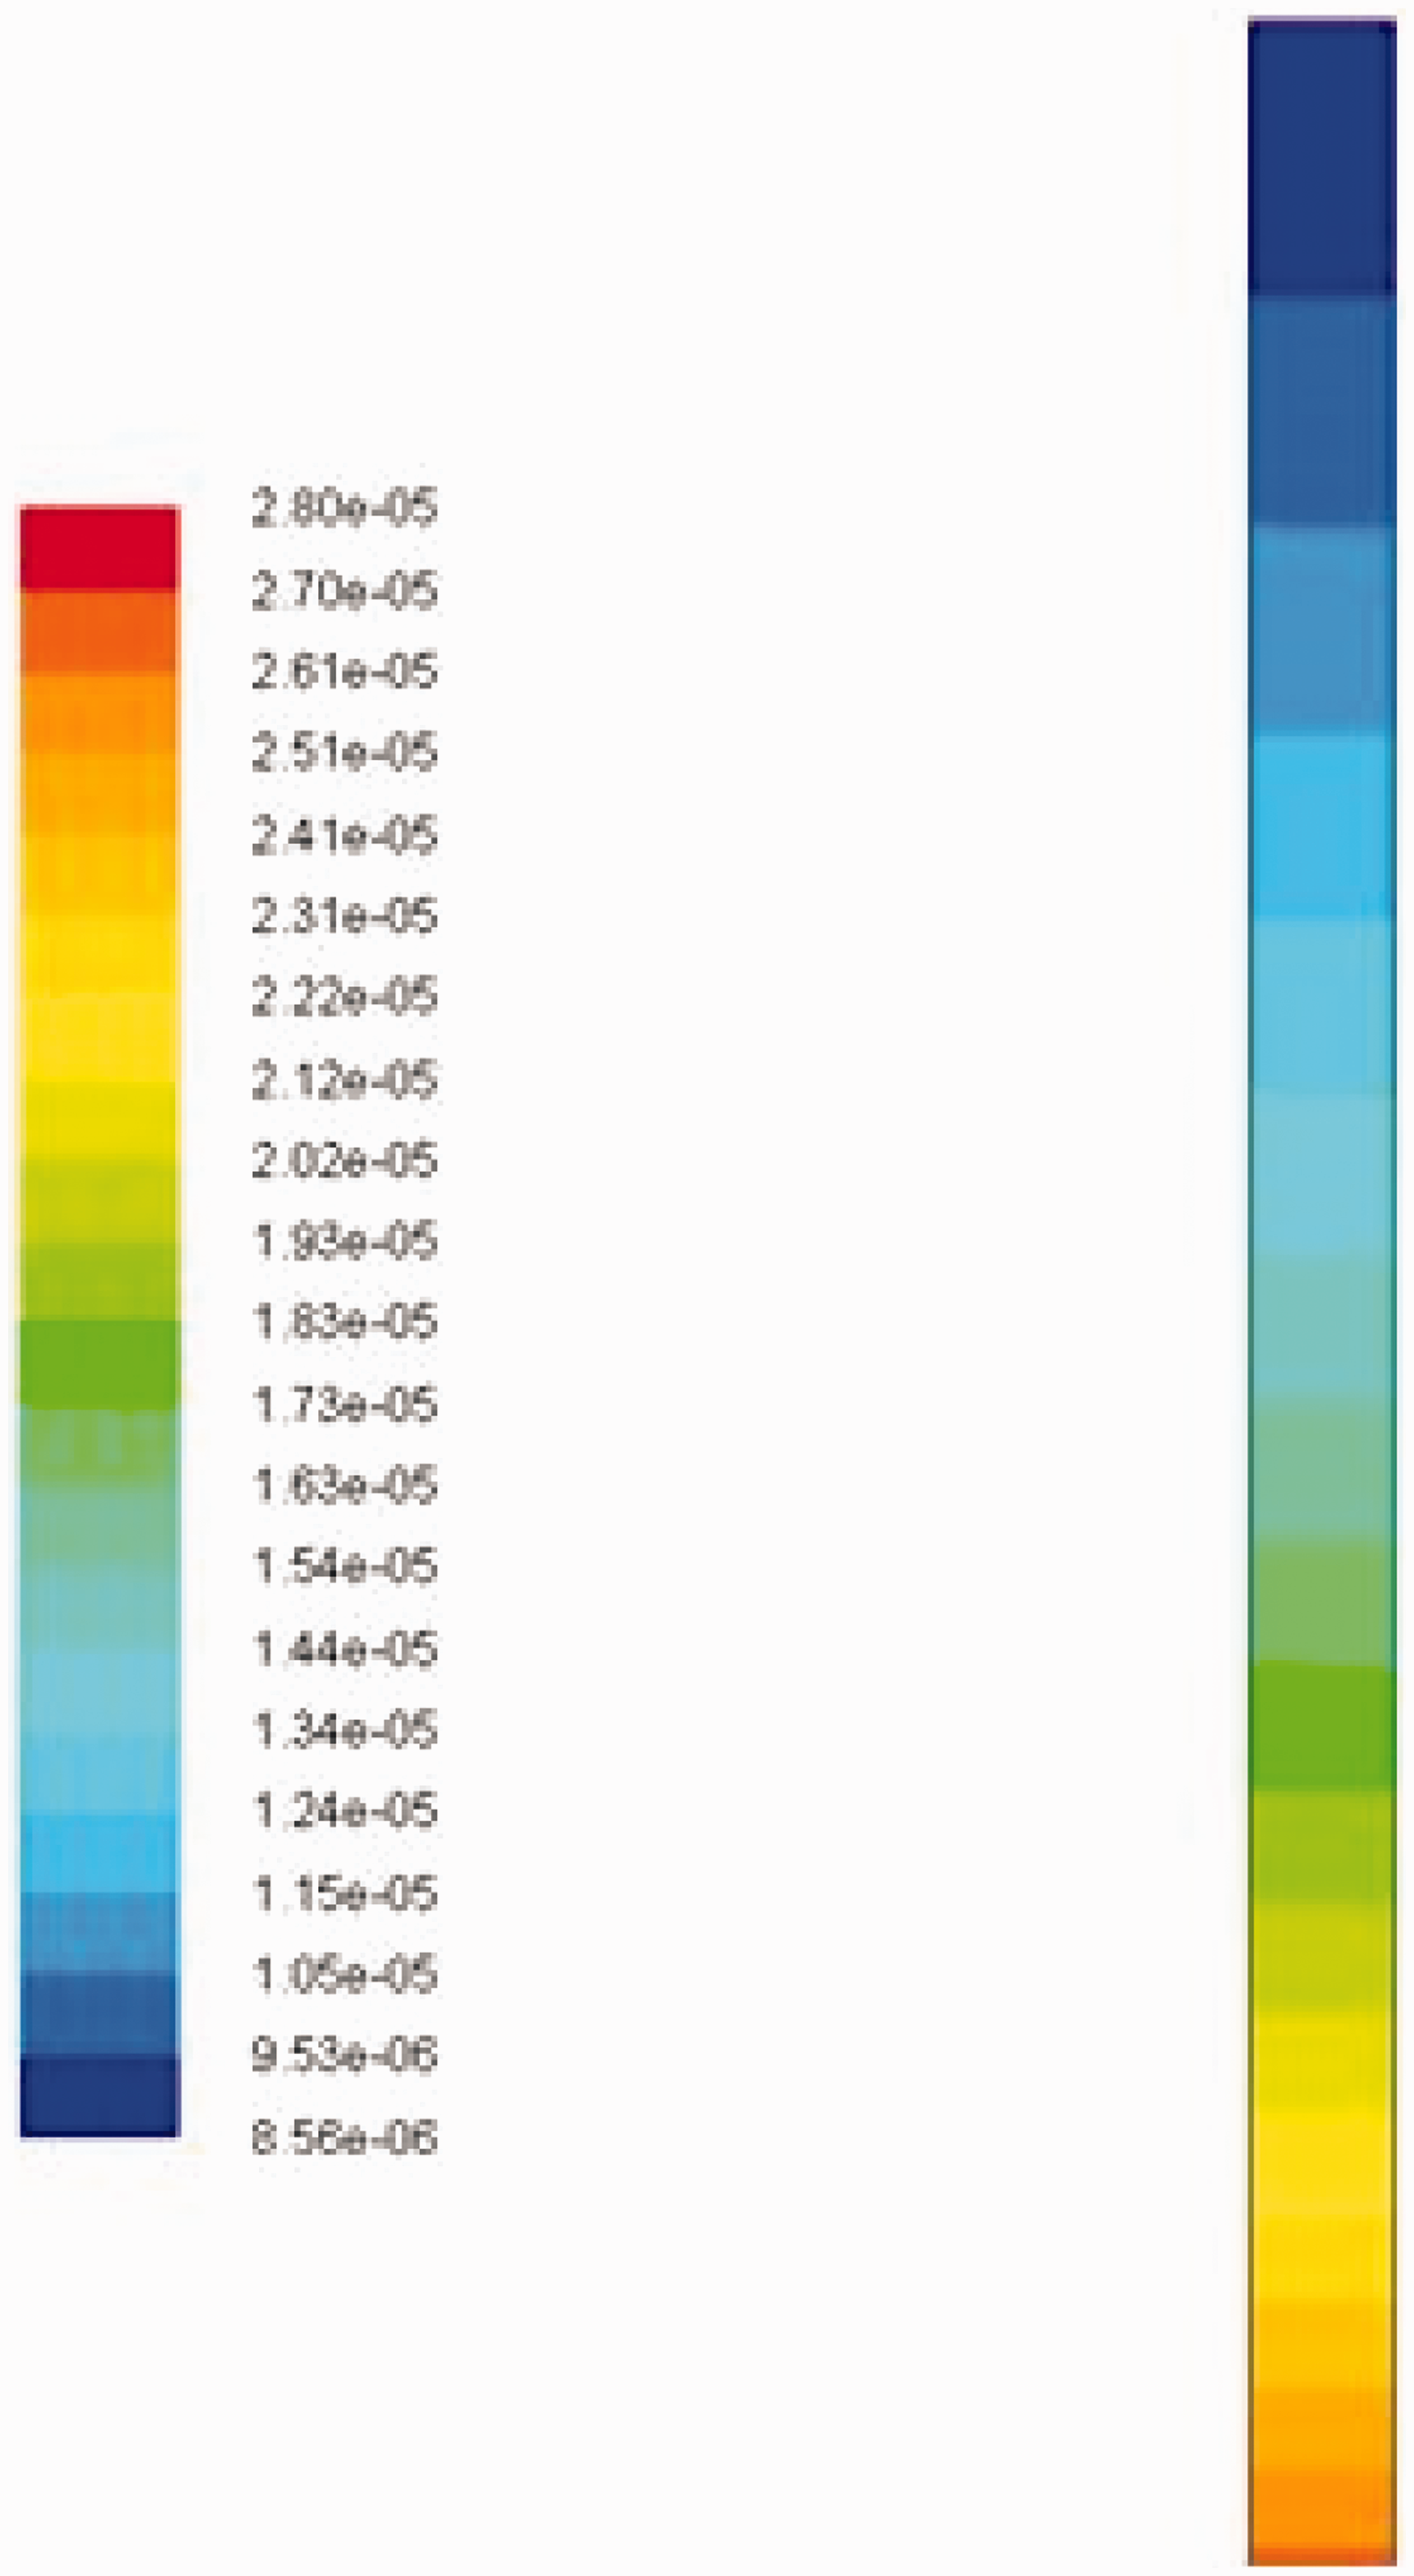
As the particles’ concentration reduces, the volume fraction of solid phase (collector) increases. This, in turn, reduces the porosity and increases the pressure drop. The contours of distribution of collectors’ volume fraction are given in Figure 10.
Contours of volume fraction of collector in the reactor after 20 h at Re = 1.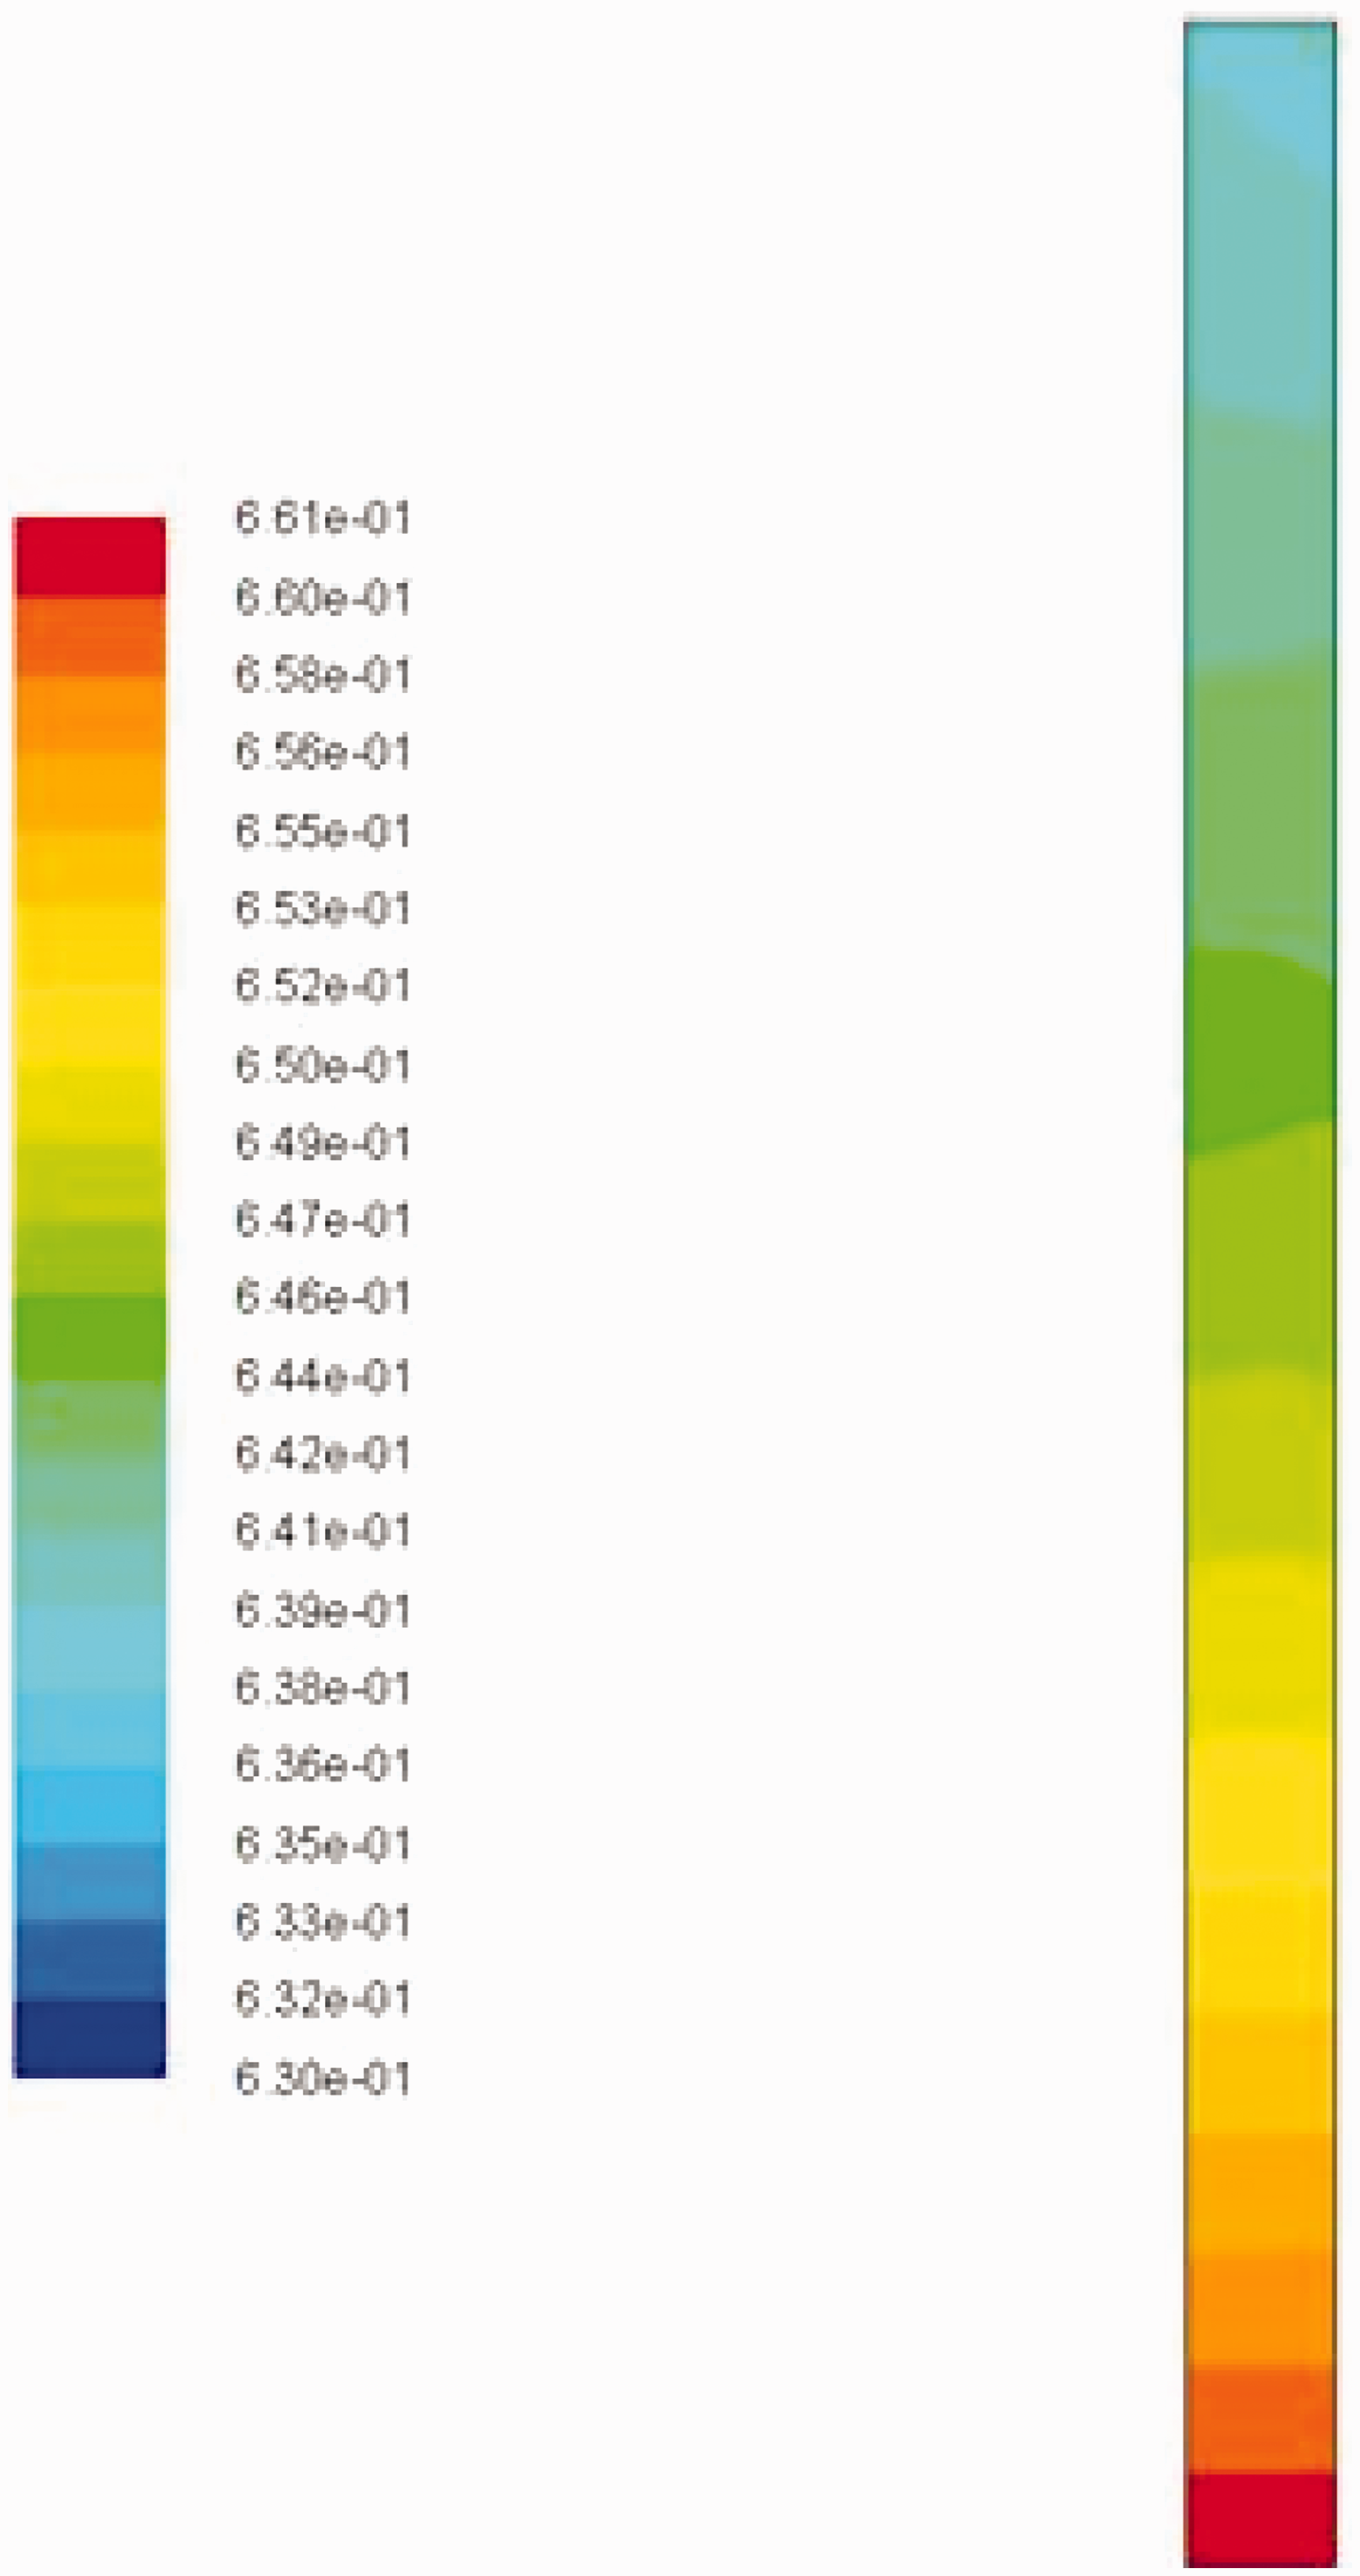
Conclusion
A CFD model for deposition of fine particles in granular bed was created in Fluent and results were compared with experimental data. Ergun’s equation was used to obtain the pressure drop. A reasonable agreement was reached between the simulation and the experimental data. Good results were obtained with relatively high Reynolds number. The error can be accounted due to the following:
Non-consideration of zeta potential between the liquid and fine particles. Lack of information about the morphology of the deposit particles, i.e. their porosity in the reactor after deposition. Lack of information about the effective fractional area γ of collector during deposition. Lack of information about the porosity distribution in the reactor.
However, this CFD model was able to capture the details of conversation of fine particles onto the collector which causes decrease in porosity. More comprehensive modeling of the filter coefficient is required to exactly simulate the clogging of the reactor under cake formation condition. Also, it will be useful to model the zeta potential forces which change the rate of deposition of particles and hence the pressure drop.
Footnotes
Declaration of conflicting interests
The author(s) declared no potential conflicts of interest with respect to the research, authorship, and/or publication of this article.
Funding
The author(s) disclosed receipt of the following financial support for the research, authorship, and/or publication of this article: This research was funded and supported by Takreer Research Centre (TRC) and Government of Abu Dhabi, UAE, to fulfill the vision of late President Sheikh Zayed Bin Sultan Al Nahyan for sustainable development and empowerment of the UAE and humankind.