
Abstract
Aerosol transport and deposition in human lungs has attracted considerable attention in the past few years, as it has significant value to the study of toxicity consequence as well as therapeutic potential in occupational health and medical applications. In reproducing human tracheobronchial airways, two approaches were frequently taken: (1) anatomical realistic reconstruction through image scans (e.g. CT and MRI) or cadaver casts and (2) mathematical description using simplified models. Strengths and limitations are primarily focused on accuracy, resolution, repeatability, and computational\physical expenses. While both approaches were reported in literature, detailed comparison of aerosol transport and deposition in the two representations were scarcely performed, largely due to the challenge to acquire comprehensive data from the irregular structured airway replicas (approach 1). To fill the gap, the current study performed a numerical comparison of nanoparticle transport and deposition in human upper tracheobronchial airways by using an anatomical realistic reconstruction (through CT scans) and a mathematically simplified airway model. As the first step, the current study was focused on the variation in breathing airflow pattern and the effect towards fate of the inhaled nanoparticles in human upper tracheobronchial airways. The study provided important information to understand geometric sensitivity of nanoparticle modeling in the human tracheobronchial tree and is of significant value to predict the whole lung uptake of inhaled nanoparticles in the human respiratory system.
Keywords
Introduction
Aerosol transport and deposition in human respiratory airways has attracted considerable attention in the past few years. The study provided valuable information in understanding the toxicity consequence of inhaled small particles, and at the same time, rendered an insight for the therapeutic design of the targeted drug delivery systems. First task of such study is to rebuild the respiratory system, most closely resembling the physical and physiological features. The human respiratory system consists of the extrathoracic airways (nasal cavity, pharynx, and larynx), lungs, and the respiratory alveolar ducts, responsible for air exchange and particle removal along with many other functions. Due to significant irregularity, extrathoracic airways are frequently reconstructed via image scans or cadaver casts,1,2 whereas for tracheobronchial and alveolar airway branches, mathematical description is favored as it offers greater assembling flexibility and computing efficiency.3,4 With the human tracheobronchial tree containing millions of branches tailored to its physiological function, whole lung modeling can only be accomplished through stochastic protocols guided by main branching features obtained from airway samples.5–7 Using this approach, Weibel 8 prescribed a symmetric planar human lung morphometry covering 23 generations with branching details quantified by mathematical equations. Further improvements were made by subsequent researchers accounting for the asymmetry and the out-of-plane morphologies.5–7 It should be noted that, while whole lung modeling unanimously took the mathematical route, anatomical realistic reconstruction from CT/MRI scans or cadaver casts were also used in the study of transport phenomenon in regional tracheobronchial trees.9–11
While both anatomical realistic and mathematically simplified models were used to investigate transport phenomenon in human tracheobronchial airways, a systematic comparison of the transport outcome was scarcely performed. Morphology-induced variation is anticipated; however, to what extent and on what ground have not been fully studied. On the other hand, correlations of the two representations in determining flow and particle dynamics could provide critical information to understand the transport process and provide solid ground to assess whole lung modeling efficacy. Of the very few reported comparative studies, Martonen et al. 12 numerically investigated the influences of cartilaginous rings on tracheobronchial fluid dynamics focused on local features in the trachea. Zhang and Finlay 13 presented an experimental study on the effect of the cartilaginous rings on particle deposition of micron meter range in a proximal lung bifurcation model. Both studies noticed distinctive flow dynamics in the vicinity of the cartilaginous rings, and measurement from Zhang and Finlay 13 showed significant enhancement of particle deposition in the trachea, though this effect did not propagate further downstream. A similar study was reported by Russo et al. 14 using computational fluid dynamics method, and enhanced particle deposition was also noted though to a lesser extent. A direct comparison of basic flow parameters was performed by Johari et al. 15 in a two-generation single tracheobronchial pathway in an anatomical realistic and two simplified models, and the observed flow features implied morphology dependency especially at a higher breathing rate.
Rather than directly comparing to seek morphology-induced variation in transport processes, majority of the inhalation simulations in human tracheobronchial airways focused on flow and particle dynamics most accurately replicating the resistance, energy consumption, and particle fate of various practical applications. By viewing the human tracheobronchial tree as a sequence of connected bifurcating passages, Tian and Ahmadi 3 reconstructed the first four generations by fusing a sequence of base bifurcating elements on the prescribed physiological realistic mathematical description. 4 Micro- and nanoparticle transport and deposition were investigated, and the simulated deposition efficiency in the trachea and the first three bifurcations were comparable to the experimental measurement. 9 Comer et al. 16 investigated the flow structures and particle deposition patterns in a symmetric double bifurcation airway models (G3–G5) based on Weibel’s description. 8 Luo et al. 17 applied large eddy simulation (LES) in a simple airway model, and Hofmann et al. 18 investigated the inspiratory deposition efficiency of ultrafine particles in a G3–G4 human airway bifurcation model. Similar approach with various focuses can be found in a series of studies reported in literature.19–26 While these studies provided valuable insight to the regional flow and particle dynamics in human tracheobronchial airways, a detailed morphology effect on nanoparticle transport cannot be inferred. With the advancement of nanotechnology and an increased interest on nanoparticle transport in the human respiratory system, such information is of significant importance.
Using an anatomical realistic reconstruction via CT scans and a mathematically simplified airway model, this study performed a detailed numerical comparison of nanoparticle transport and deposition in human upper tracheobronchial airways. As the first step, the current study was focused on the variation in breathing airflow pattern induced by anatomical morphology features such as surface roughness, airway morphology, cross-sectional profiles and branching angles. The effect towards the fate of the inhaled nanoparticles was also investigated. The study provided important information to understand geometric sensitivity of nanoparticle modeling in the human tracheobronchial tree and is of significant value to predict whole lung uptake of inhaled nanoparticles in the human respiratory system.
Method
Human upper tracheobroncial airway geometric models
An anatomical realistic human respiratory system, containing major tracheobronchial tree, was reconstructed via segmentation technique using the CT scans of a 43-year-old healthy male (Hubei Cancer Hospital, Wuhan, China). The scans captured the outlined slices of the geometry in X–Z plane along the Y-axis at an interval of 0.5 mm from the entrance of the nasal cavity to bronchioles up to the 15th generation. The reconstructed “cloud points” lying on the geometric surface were connected and further smoothed out with reverse engineered image processing algorithms, and the final surface model was created which defines the internal domain bounded by the tracheobroncial geometry (Figure 1(a)). Further details on model reconstruction and verification can be found in the work of Inthavong et al. 27
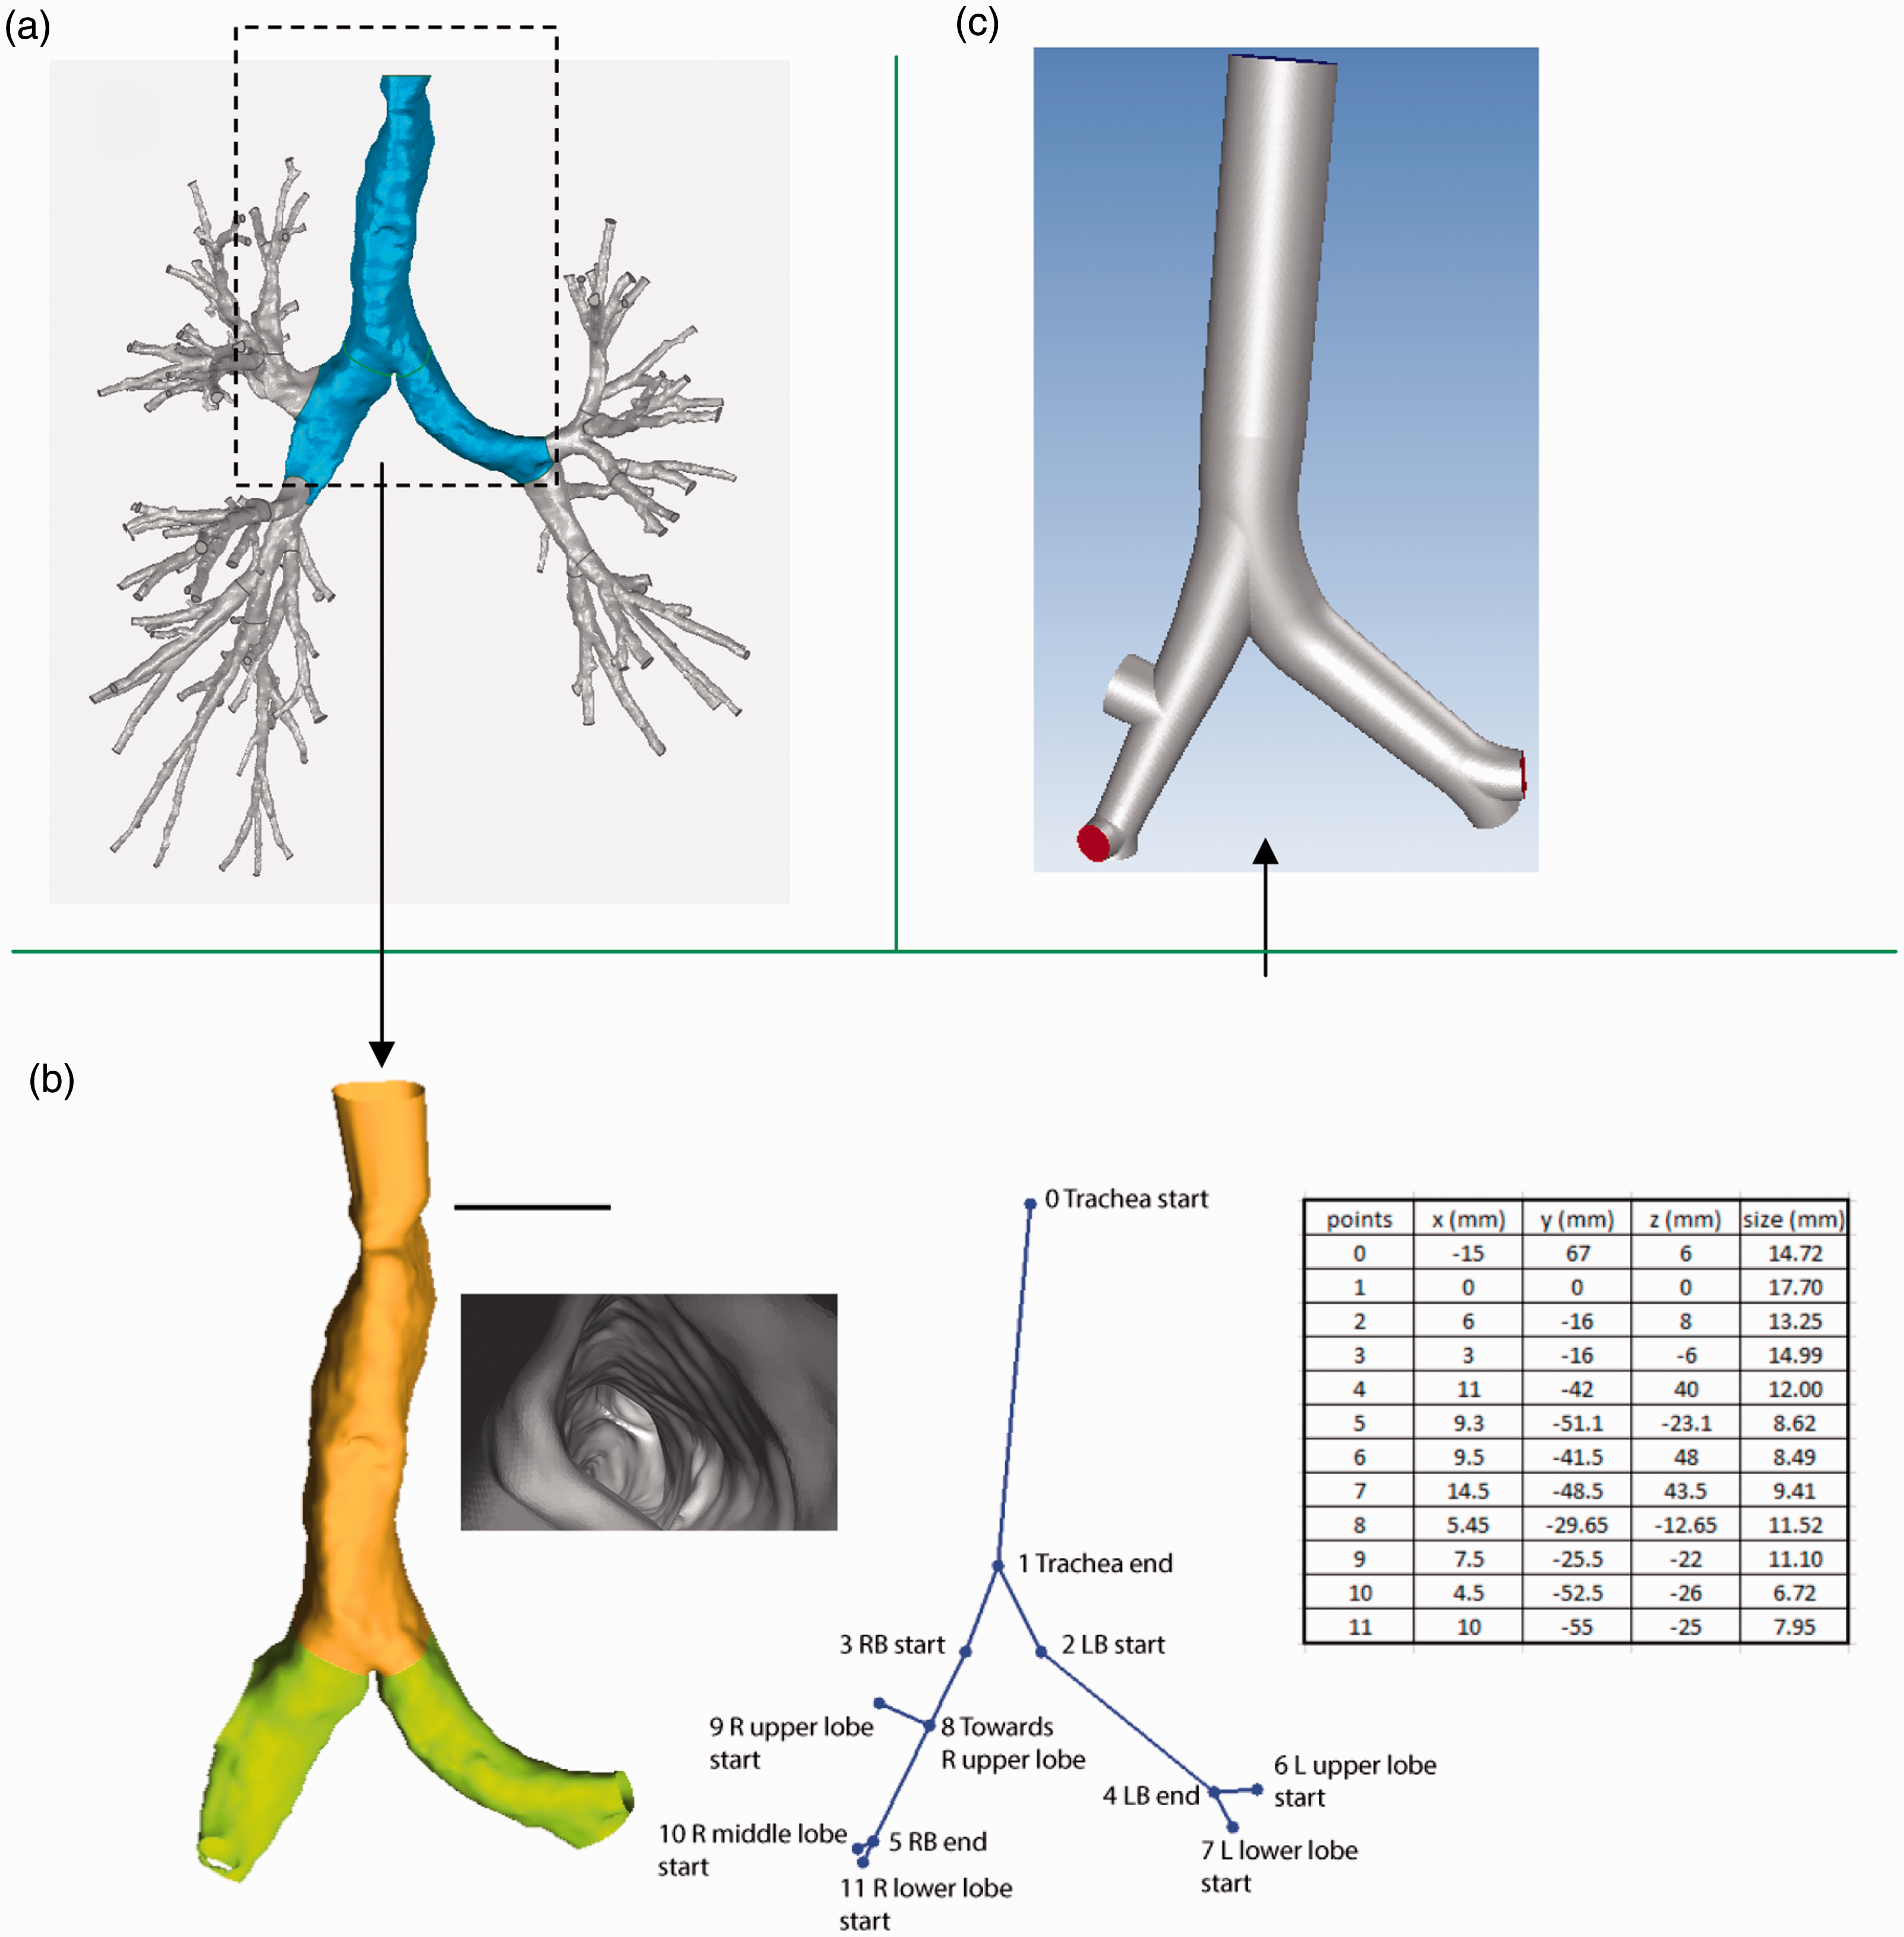
Schematic of the human airway geometric model: (a) anatomical realistic human tracheobronchial airway reconstruction (CT scans); (b) mathematically simplified model development and (c) reconstructed mathematically simplified airway model.
As the first step for a systematic detailed comparison between the anatomical realistic tracheobronchial airway and the simplified mathematical models, rather than including the entire tracheobronchial tree of 15 generations, the current study was focused on the trachea and the main bronchus leading to the left and right lung. The truncated airway is shown in Figure 1(b), which initiated from the trachea entrance and existed at openings of the secondary bronchi, including the three right and two left lobes respectively. Short artificial extension toward the head airway was joined to the trachea to form a contiguous pathway for future integrated study. Key geometric features of the truncated airway are given in Figure 1(b), which defines the main branching outline such as airway cross-sectional diameters, airway lengths, and the branching angles. It should be noted that, rather than being circular and smooth, the cross sections of the trachea were wavy and predominantly C-shaped with cartilaginous rings uniformly spaced to support the airway (Figure 1(b)). This feature continued in subsequent airways (G1) though to a lesser extent (due to smaller sizes of the cartilaginous rings). While the right bronchus was observed to be highly oblate in major segment, the left bronchus appeared to be more rounded throughout. As the anatomical cross section is non-circular, diameter shown in Figure 1(b) was defined as the average of the maximum and minimum span of the cross-sectional area in the tracheobronchial airways. 28
Mathematically simplified airway model was constructed based on the anatomical outline, where airway branches were modeled as idealized circular tubes with fine features such as surface roughness, cartilaginous rings, and oblate distortion neglected. The simplified model enforced the exact match at key nodes along the geometry outline (Figure 1(b)) and ensured smooth transition between airway generations (Figure 1(c)). It is shown in Figure 1 that the idealized airway conformed to the main features of the anatomical replica; however, airway curvature and deviation of airway morphology to that of straight tubes were not considered.
Computational mesh
Fluent Meshing (ANSYS 18.0) was used to generate the computational mesh (Figure 2). A new polyhedron scheme was employed and shown to be computationally efficient, numerically accurate, and generating solution with superior converging capabilities. Polyhedron elements with minimum cell dimension of 0.5 mm filled the main bronchial airway, while a highly dense prism layer of hexahedron elements in normal direction of the wall was attached to resolve near-wall features. The 10 prism layers evolved from the first grid point with cell dimension of 0.05 mm to the core region with a growing factor 1.2. The resulting mesh consisted of 789,310 elements and 3,364,729 faces for the anatomical model, 692,446 elements and 3,111,176 faces for the mathematically simplified representation. Mesh independency was conducted and achieved at the specified size.
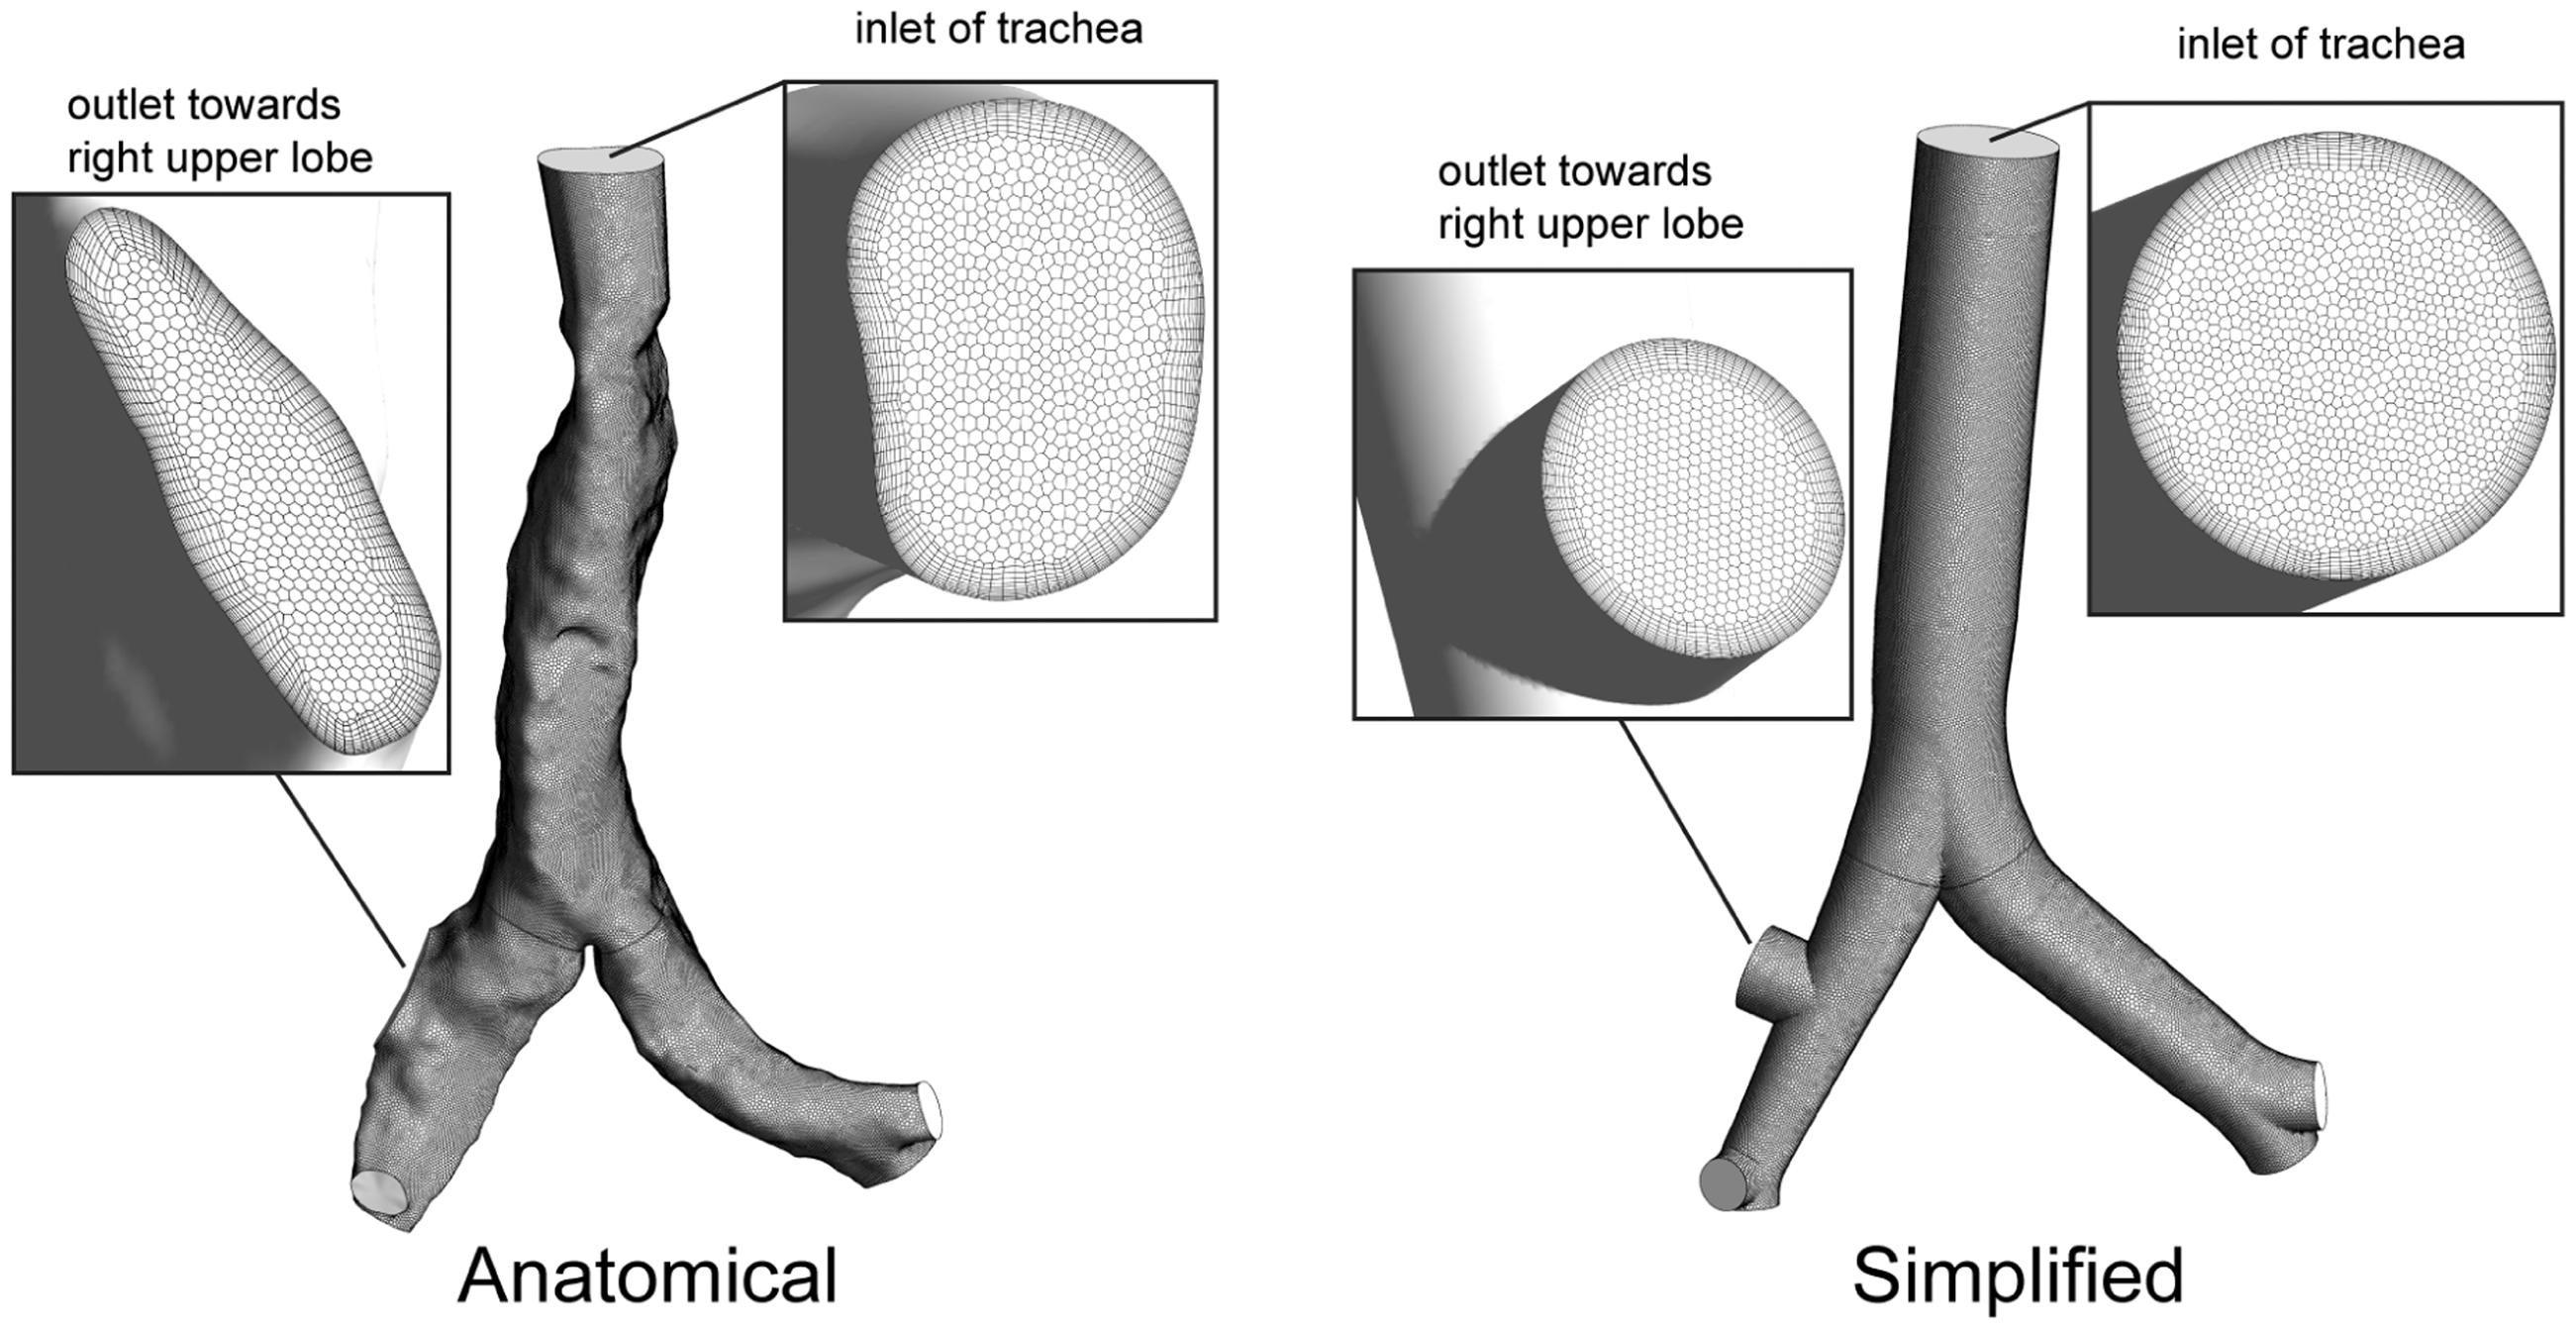
Computational mesh with polyhedron meshing schemes.
Fluid flow simulation
The current study employed a steady inhalation model with the assumption that particle deposition mainly occurs during the inhalation phase. 29 It is worth to note that breathing pattern was shown to affect deposition for micron range particles between 1 and 5 µm 30 ; however, the effect toward nanoparticle deposition was still not fully understood. A moderate breathing of 30 L/min was considered in this study. According to Tian and Ahmadi, 3 laryngeally induced turbulence propagates in the trachea and the first two bifurcations before fully dissipated; therefore, breathing air in the current study was in turbulent state. Reynolds stress transport model (RSTM) together with the “two-layer zonal” boundary condition was shown to bring the most accurate particle deposition prediction,3,31 and therefore was used in the current study.
Turbulence mean flow
Under normal breathing conditions, the air behaves as an incompressible fluid. Turbulence mean flow is governed by the Reynolds-averaged continuity and momentum equations, given as
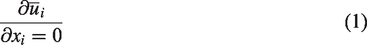
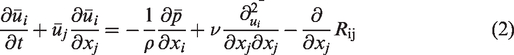
where
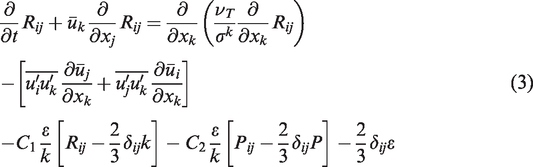
where Pij is the production, with P = Pii/2. Standard values for the constants are σk= 1.0, C1 = 1.8, C2 = 0.6, originally obtained by matching
Turbulence fluctuations
“Discrete random walk” model was used for stochastic tracking of particle motion accounting for the turbulent stresses. The model assumes successive encounter of particles with discrete turbulent eddies, and the fluctuation velocity is given as


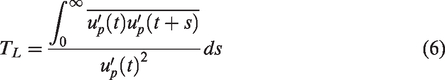
For small particles that follow the flow, TL can be approximated as
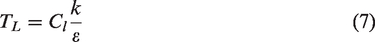
where Cl is the model constant, taking the value of for the RSTM turbulence model. 31
Turbulence near-wall modeling
Standard turbulence models such as RSTM were formulated primarily for turbulent flows in the core region. Modifications to the flow and turbulence fluctuations are needed to accurately predict wall deposition of small particles in the wall bounded flow. Chen and Patel
34
proposed a two-layer wall boundary condition for resolving the near-wall features of the flow by combining Wolfstein’s
35
one-equation turbulence near-wall model with the traditional Reynolds averaged Navier–Stokes turbulence models in the core region. In near-wall region, turbulence kinetic energy k is evaluated using its transport equation, while the dissipation rate ε and eddy viscosity νt are estimated as
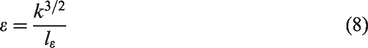

Here, the wall effects are taken into account with the damping of the length scales lε and lµ by the following equations


In equations (9) and (10), the constants are Cl = κCµ3/4, Aµ = 70, Aε = 2Cl. In the above equations, Ry is the turbulence Reynolds number near wall, defined as
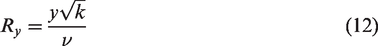
The damping of turbulence reaches the maximum at the wall, and decays as the distance is further away from the wall. Transition of the turbulence from near wall to the core region was made when Ry = 200.
Airflow was simulated using ANSYS-FLUENT18.0. The flow was driven by pressure gradient between entrance of the trachea and bronchi exits. A steady breathing was imposed with assumption of equal pressure drop at the five lobar bronchi exits. Further details of fluid flow modeling can be found in the work of Tian and Ahmadi. 3
Particle simulation
Lagrangian particle tracking method is used where individual particle trajectory is computed. The particle equation is
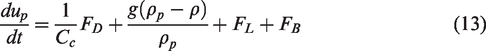

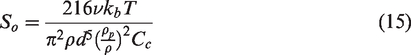
where ν is the fluid kinematic viscosity, kb is the Boltzmann constant, and T is the absolute temperature of the inspiratory air in the nasal cavity. The simulation was carried out with ANSYS-FLUENT18.0 discrete phase model (DPM).
In this study, particles were uniformly released from the trachea entrance. Statistically independent 10,000 uniformly concentrated mono-dispersed ultrafine particles of 1, 1.1, 1.2, 1.3, 1.4, 1.5, 1.7, 2, 3, 5, 10, 15, 20, 30, 40, 50, 70 and 100 nm were released. Deposition onto the respiratory walls occurred when the particle was within radius distance away from the airway surface.
Deposition efficiency
Particle deposition efficiency (DE) is defined as the ratio of the deposited particles in a region to the total number entering nasal cavity. That is

It is an important parameter characterizing the regional filtering capacity and particle penetration rate. Deposition efficiency (DE) is closely related to the transport mechanisms and for nanoparticles, size, diffusivity and airflow rate are the governing parameters. Due to the geometric complexity of human airways, no analytical expression is available for deposition efficiency (DE). Frequently, empirical fitted equations are used to relate measured data (DE) to the governing parameters.
Model validation
The particle equation (13) was solved by stepwise integration over discrete time steps yielding a new particle velocity at each time step. Inthavong et al. 37 identified the sensitivity of nanoparticle diffusion behavior (in Lagrangian tracking) to the integral time step factor, mesh size and flow condition. The evaluation was based on selecting the most appropriate time step factors to achieve optimal Lagrangian tracking outcome, and was proposed and verified in a pipe and a human pharynx model. 37
In ANSYS-FLUENT, the length scale factor of integration, Ls, controls the integration time step size and Δt is a function of the particle velocity and the continuous airflow phase velocity
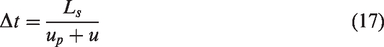
This means that the length scale factor is proportional to the integration time step, which is the distance that the particle travels before its equations are solved again and its trajectory updated. A smaller value for the length scale increases the number of calculations per step length. Its selection must reproduce the diffusion dispersion mechanism for nanoparticles. A standard geometry in the form of a pipe (Figure 3(a)) with analytical solution by Ingham
38
was used to validate the particle dispersion. A fully developed flow of 1 L/min and 5 L/min was used which has a corresponding Re = 312 and Re = 1560, respectively. The particles were introduced into the pipe with a mass flow rate distributed with a fully developed profile as

Brownian diffusion validation testing in a pipe geometry. Particle deposition in a pipe for nanoparticles between 1 and 20 nm were compared against the analytical solution by Ingham.
38
Three length scale factors, 5e-6m,  1e-5m, and
  5e-5m, were investigated to determine the most suitable value.
Particle deposition in a pipe length of 0.9 m was compared for length scale factors of 5e-5 m, 1e-5 m, and 5e-6 m, which showed that the deposition was best described using a value of 1e-5 m. Applying the method to the current model in this study showed that an optimal value is of 1e-5 m. Further detail of the methodology was given in Inthavong et al. 37
Results and discussion
Breathing airflow pattern
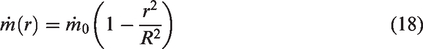
A moderate breathing of 30 L/min was considered in this study. Key features of the airflow pattern were similar, conforming to the geometric details of the airway. Figure 4 displays the stream-wise airflow pattern at moderate breathing in central plane of the tracheobronchial airways. Simulation results from anatomical and idealized geometries were plotted side by side for comparison. Uniform flow entered from the trachea entrance with a prescribed turbulence intensity of 15%, and existed at openings of the secondary bronchi driven by pressure gradient. As shown in Figure 4(a), flow development in the trachea of the idealized model was smooth, with parabolic profiles gradually forming due to no slip boundary condition. The flow partitioned at the carina ridge with distortions to enter subsequent branches asymmetrically. Due to inertia, more flow penetrated to inner walls of the daughter branches and a low-velocity zone was formed near outer walls in vicinity and downstream of the carina ridge. Due to the immediate opening of right upper lobe, flow was more uniform in the right bronchi. High velocity was observed in the center of the trachea upstream carina ridge, and in daughter branches before the final exits. Flow pathlines appeared to be ordered that recirculation was only observed in the upper corner following the exit into the right upper lobe. Low velocity and high pressure mainly concentrated at the bifurcating ridge in both the trachea and the daughter branches (Figure 4(a) and (b)).
Stream-wise airflow pattern at moderate breathing in central plane of the tracheobronchial airways: (a) pressure; (b) velocity magnitude; and (c) flow pathlines.
On the other hand, development of the breathing airflow in the anatomical model was non-parabolic and was significantly affected by the contraction at the trachea entrance (Figure 4(a)). Prominent pressure drop and flow acceleration were observed with highly distorted flow shifting toward left side of the trachea, and a low velocity zone was formed on the right near the wall where flow recirculation was clearly observed (Figure 4(a) and (b)). Velocity magnitude distribution in daughter branches appeared to be similar to that of the idealized model. When comparing the flow pathlines, anatomical model apparently caused more mixing in the trachea and the left bronchi. In summary, while the stream-wise flow pattern showed global similarities in the two geometric models, significant variation was observed with fine details.
Figure 5 displays the velocity vectors of the secondary flow in the axial planes at selected locations (Figure 4) along the trachea and the bronchi. While the color map indicated the velocity magnitude including the stream-wise component, the length of the vectors implied the magnitude of the in-plane secondary flow components. It was clearly shown that the level of the secondary flow in the anatomical model was much higher than that in the idealized representation throughout the airways. The data showed strong mixing in the anatomical model corresponding to the observation in Figure 4(c). While the secondary flow in the idealized model was mainly induced by the formation of the boundary and flow partition at the bifurcations, geometrical irregularity in the anatomical model was also a major contribution. Figure 5(b) also shows the strong deviation from circular shape of the cross section in the right bronchi to be highly oblate, while cross sections in the trachea and the left bronchi were more rounded though deformation was clearly observed due to the presence of cartilaginous rings.
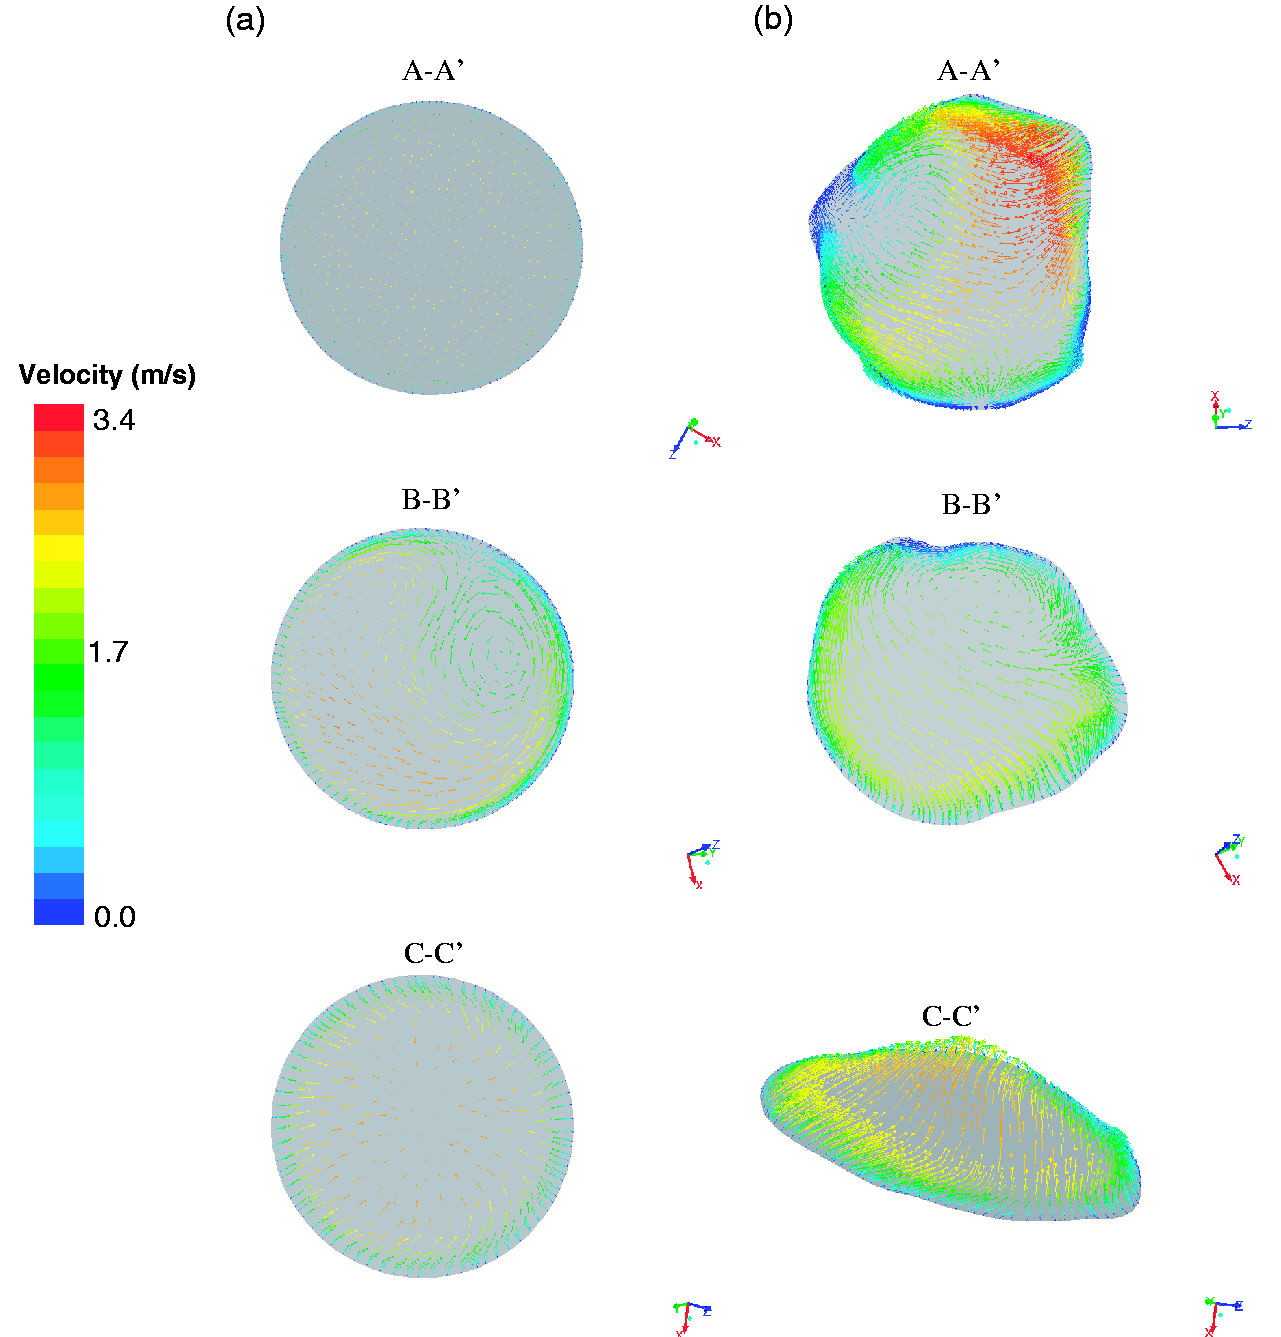
Secondary flows at selected cross sections (Figure 4) along the trachea and the left and right bronchi: (a) an idealized model and (b) an anatomical model.
Turbulence
Figure 6 compares the turbulent activity at the breathing rate of 30 L/min in the truncated airway models. In the idealized geometry, maximum turbulence activity was at the tracheal entrance, which was gradually dissipated as the airflow traveled downstream and a minimum level was reached upstream the trachea carina ridge. Minor turbulence production associated with flow partition was observed which raised the turbulence kinetic energy as the flow traveled further down to the daughter branches. A slightly higher level of turbulence was exhibited in the left bronchi than that in the right. On the other hand, significant higher turbulent activity was observed in the anatomical model. Peak turbulence was seen following trachea contraction, where substantial production was induced. High-level turbulence filled the entire trachea up to the carina ridge, which was gradually dissipated in the daughter branches.
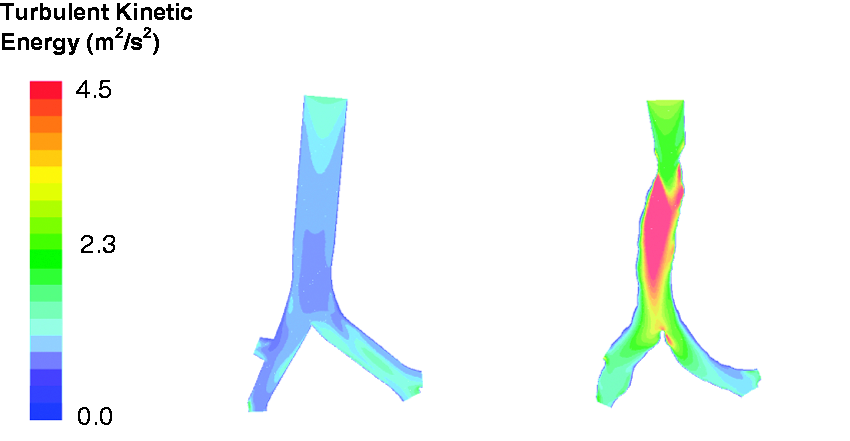
Comparison of turbulence kinetic energy.
Wall shear stress
Figure 7(a) displays the wall shear stress on the airway surface of the anatomical tracheobronchial model at a breathing rate of 30 L/min. To elucidate the obscured region in the 3D domain (Figure 7(a)), a surface mapping technique 39 was applied where the 3D bounding surface was unwrapped to a 2D surface as shown in Figure 7(b). The model was first sliced along axial lines on the surface of the trachea and daughter branches; then the 3D surface coordinates were transformed into a new set of 2D coordinates, mimicking the surfaces being unfurled. Resulting boundaries in red represented the initial axial lines where the cut was made, while boundaries in blue represented the trachea entrance and bronchi exits respectively. The layout of the 2D unwrapped anatomical model, showing details of the relative position of airway branches, is displayed in Figure 7(b). Instead of examining the wall shear stress on the 3D model, 2D representations with significantly improved view are given in Figure 8.
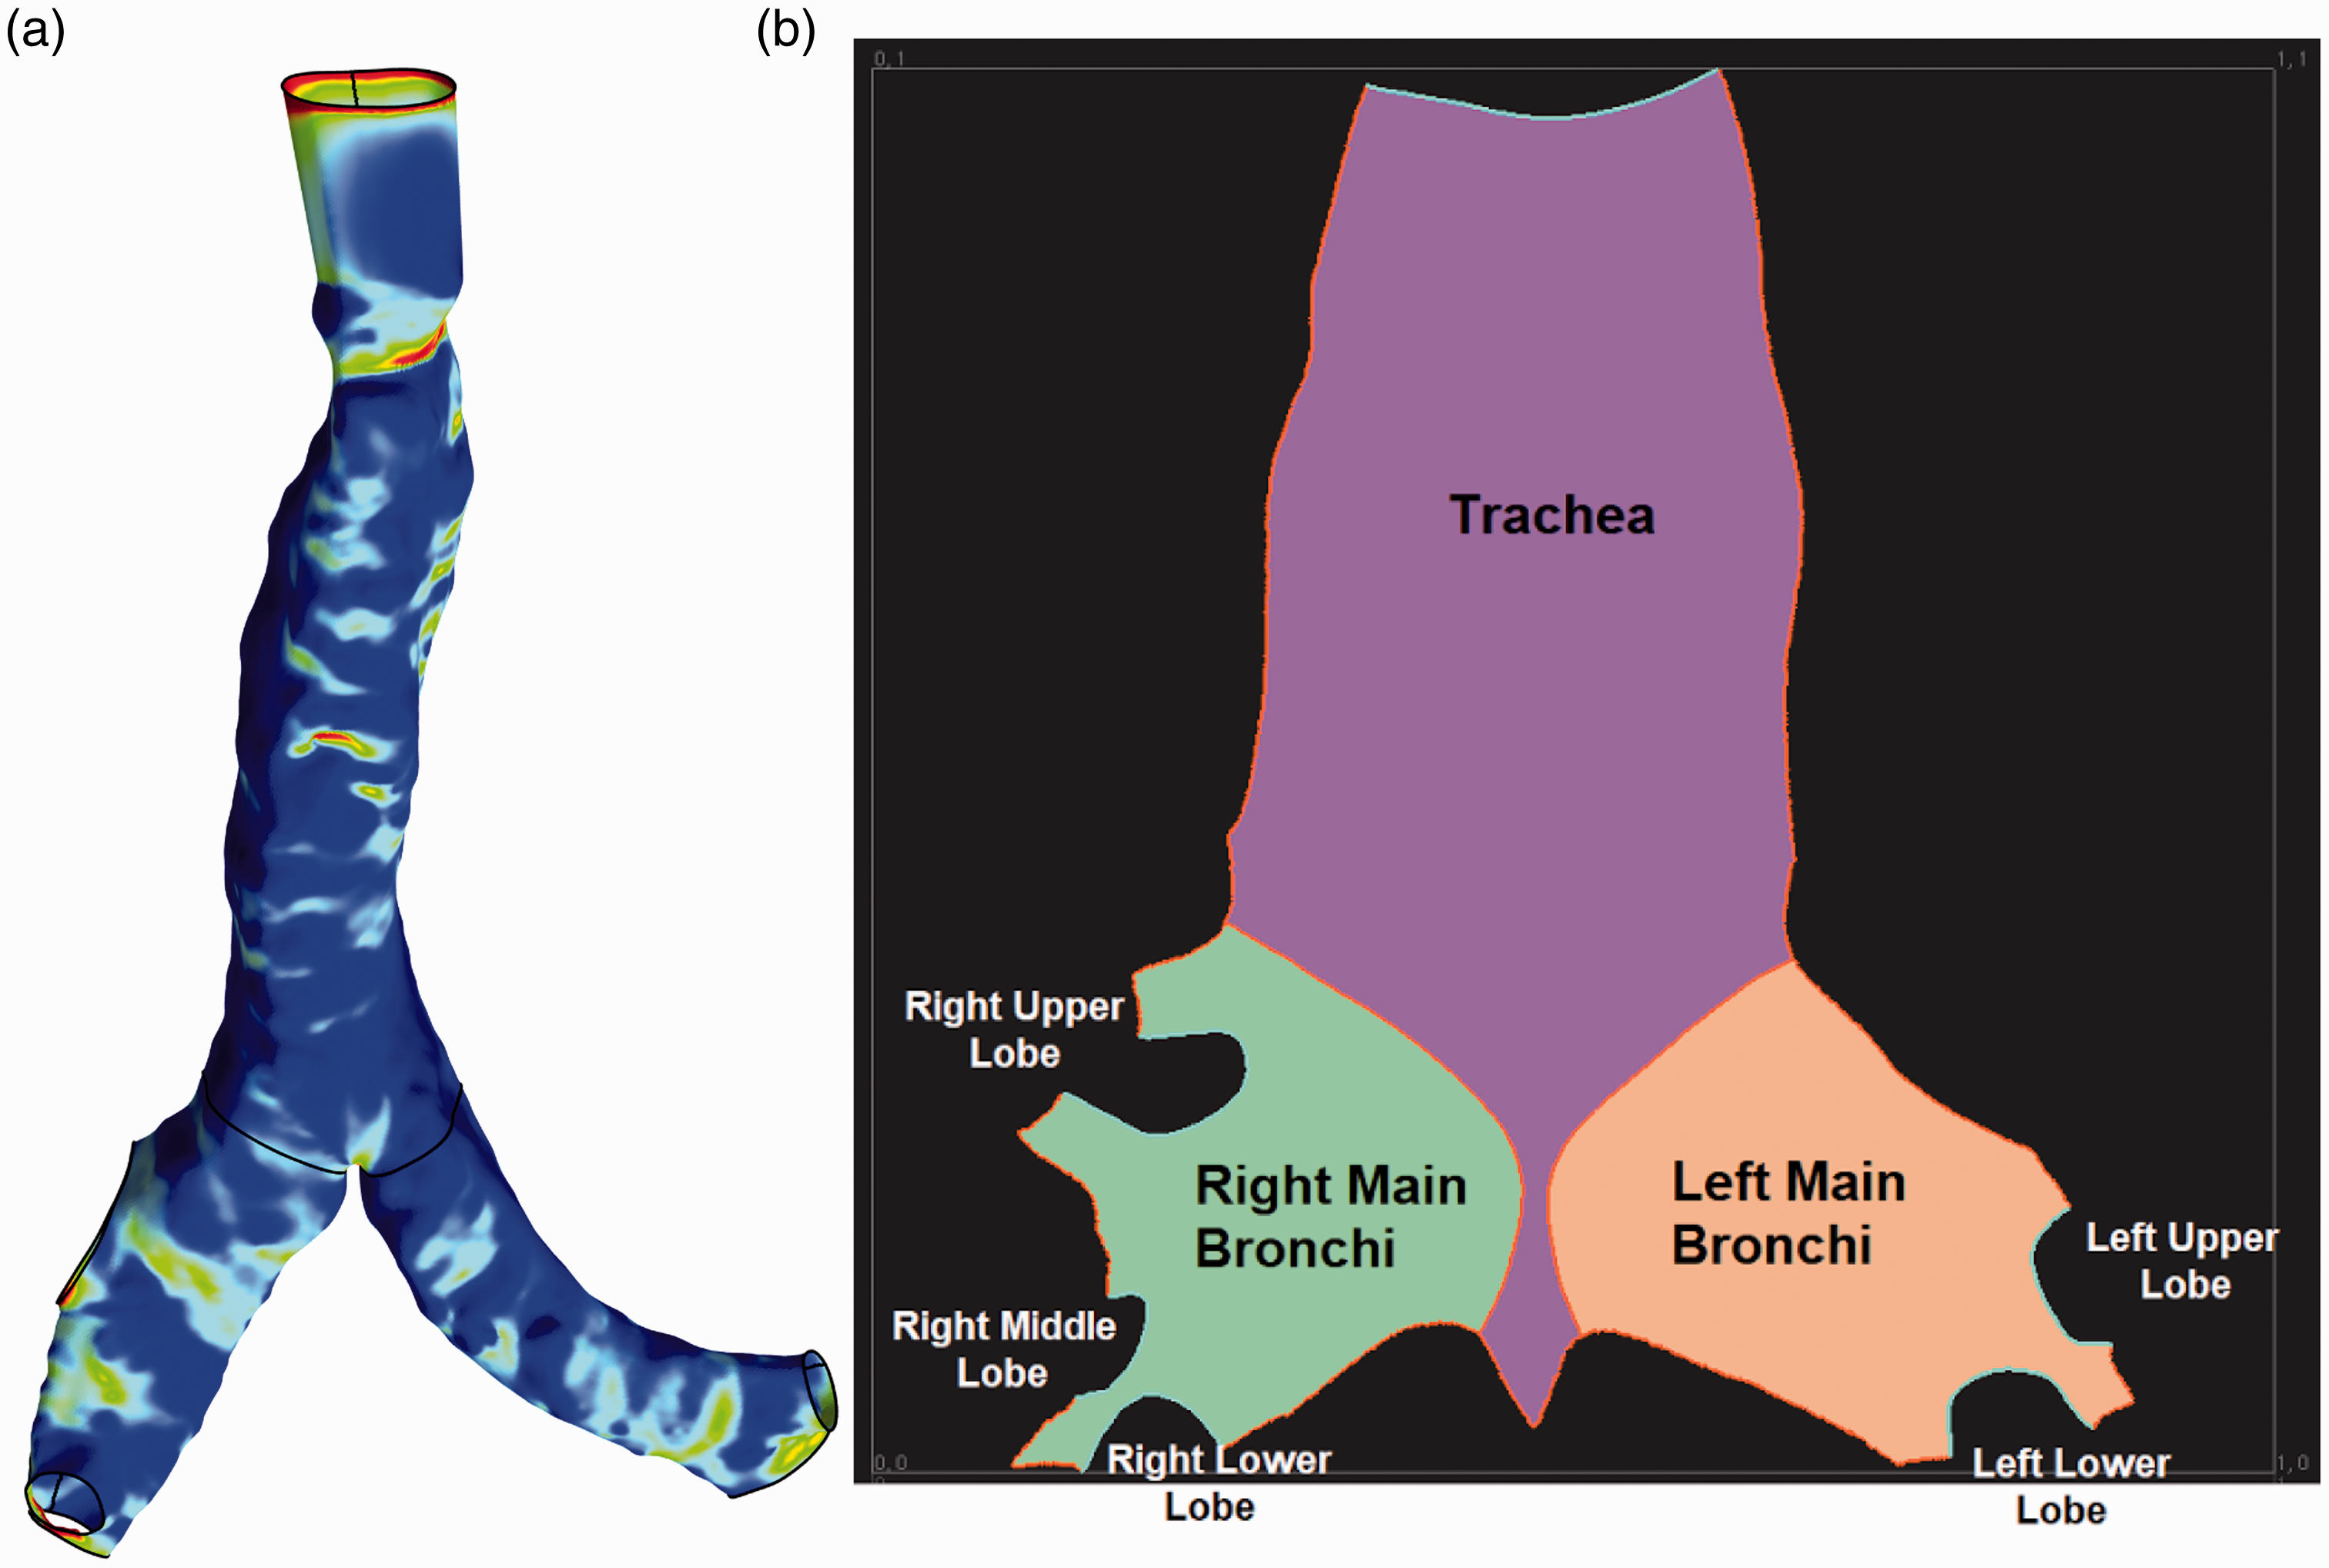
Schematic of surface mapping from 3D to 2D domain: (a) 3D model showing wall shear stress and (b) unwrapped 2D surface of the 3D truncated airway model.
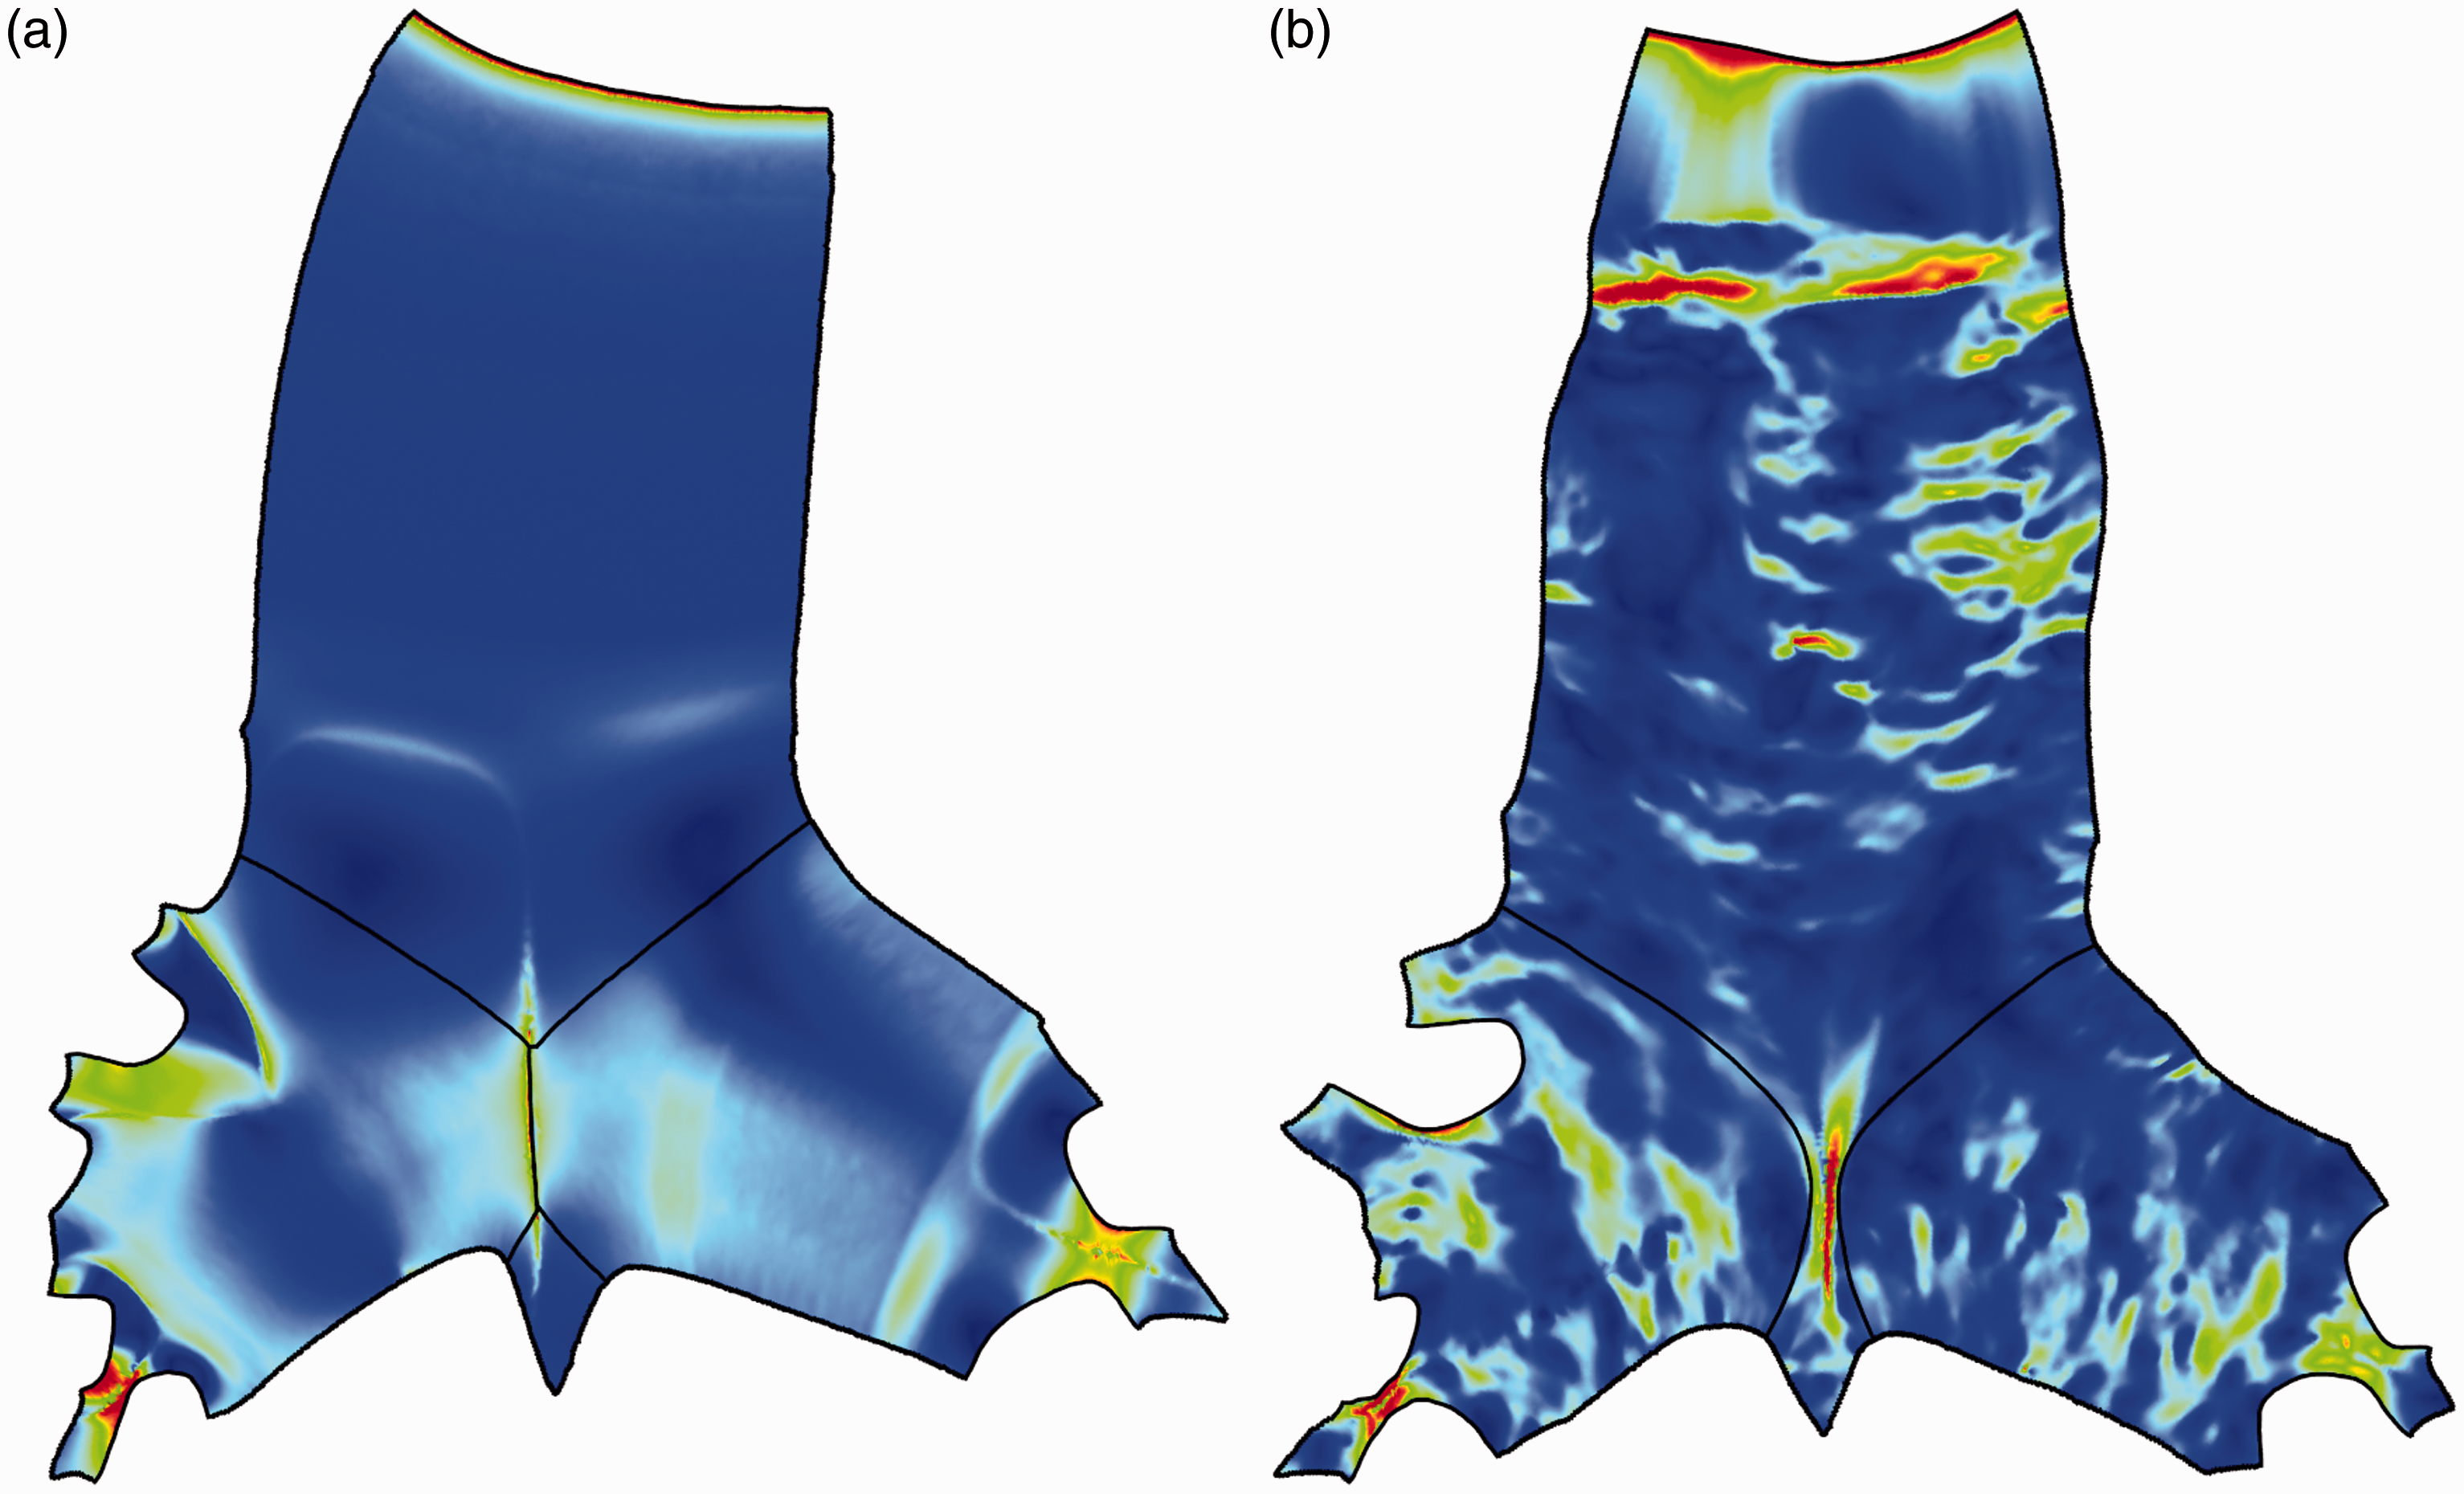
Comparison of wall shear stress on the unwrapped 2D surface models: (a) an idealized model and (b) an anatomical model.
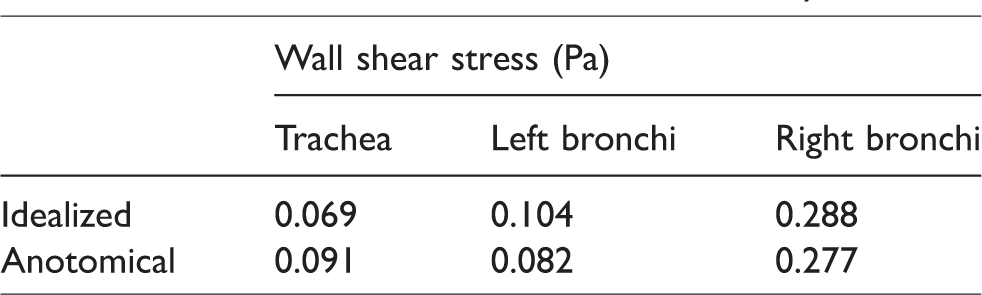
It is shown in Figure 8(a) that, for the idealized geometry, strong localized high shear was observed at the tracheal entrance and bifurcation in both trachea and the daughter branches. High shear was also observed upstream bifurcation where the flow partition took place. Very low and uniform distribution of the wall shear in the trachea and bulk region of the daughter branches implied a smooth airway surface with low frictions. On the contrary, wall shear in the anatomic model exhibited significant fluctuations throughout the airway model (Figure 8(b)). Sporadic and streak patterned wall shear implied a rough surface which corresponded to the predominantly wavy channel interior as observed in Figure 1(b). Similar to that of the idealized geometry, peak wall shear appeared to be at trachea entrance and airway bifurcations. In addition, due to significant friction induced by the geometric contraction near trachea entrance, significant peak wall shear was also observed in this region (up to 0.8 Pa). Table 1 lists the averaged wall shear stress in trachea, left and right bronchi in the idealized and anatomical models. It was seen that, while anatomical model exhibited higher stress in the trachea (24.2%), the wall shear of the left and right bronchi was higher in the idealized model (26.8% and 9.5%).
Wall shear stress distribution in the airway models.
Wall shear distribution could well indicate the level of secondary flow and forming of local eddies contributing to enhancement of the particle deposition. As clearly shown in Figure 8(a) and (b), the 2D unwrapped surface mapping provided considerably more information than that of the 3D presentation.
Particle deposition pattern
Figure 9 shows the sample deposition pattern of the inhaled nanoparticles (1 and 10 nm) onto the tracheobronchial airway surface at a breathing rate of 30 L/min. Data mapping onto the unwrapped 2D surface were applied and presented for superior visualization. A total of 60,000 mono dispersed water droplet particles were uniformly released near the tracheal entrance. Particles deposited onto the trachea, left and right bronchi were marked in red, green and blue for comparison. As clearly shown in Figure 9, particle deposition pattern was highly affected by particle size, with high diffusivity particles (such as 1 nm in Figure 9(a) and (b)) significantly more likely to be collected. For the size of particles considered, other than tracheal entrance, no preferential deposition site was exhibited, indicating a diffusive transport mechanism. High deposition onto trachea bifurcation, frequently observed for high inertia particles, was not seen, re-emphasized that diffusion rather than inertia impaction was the dominant transport and deposition mechanism.
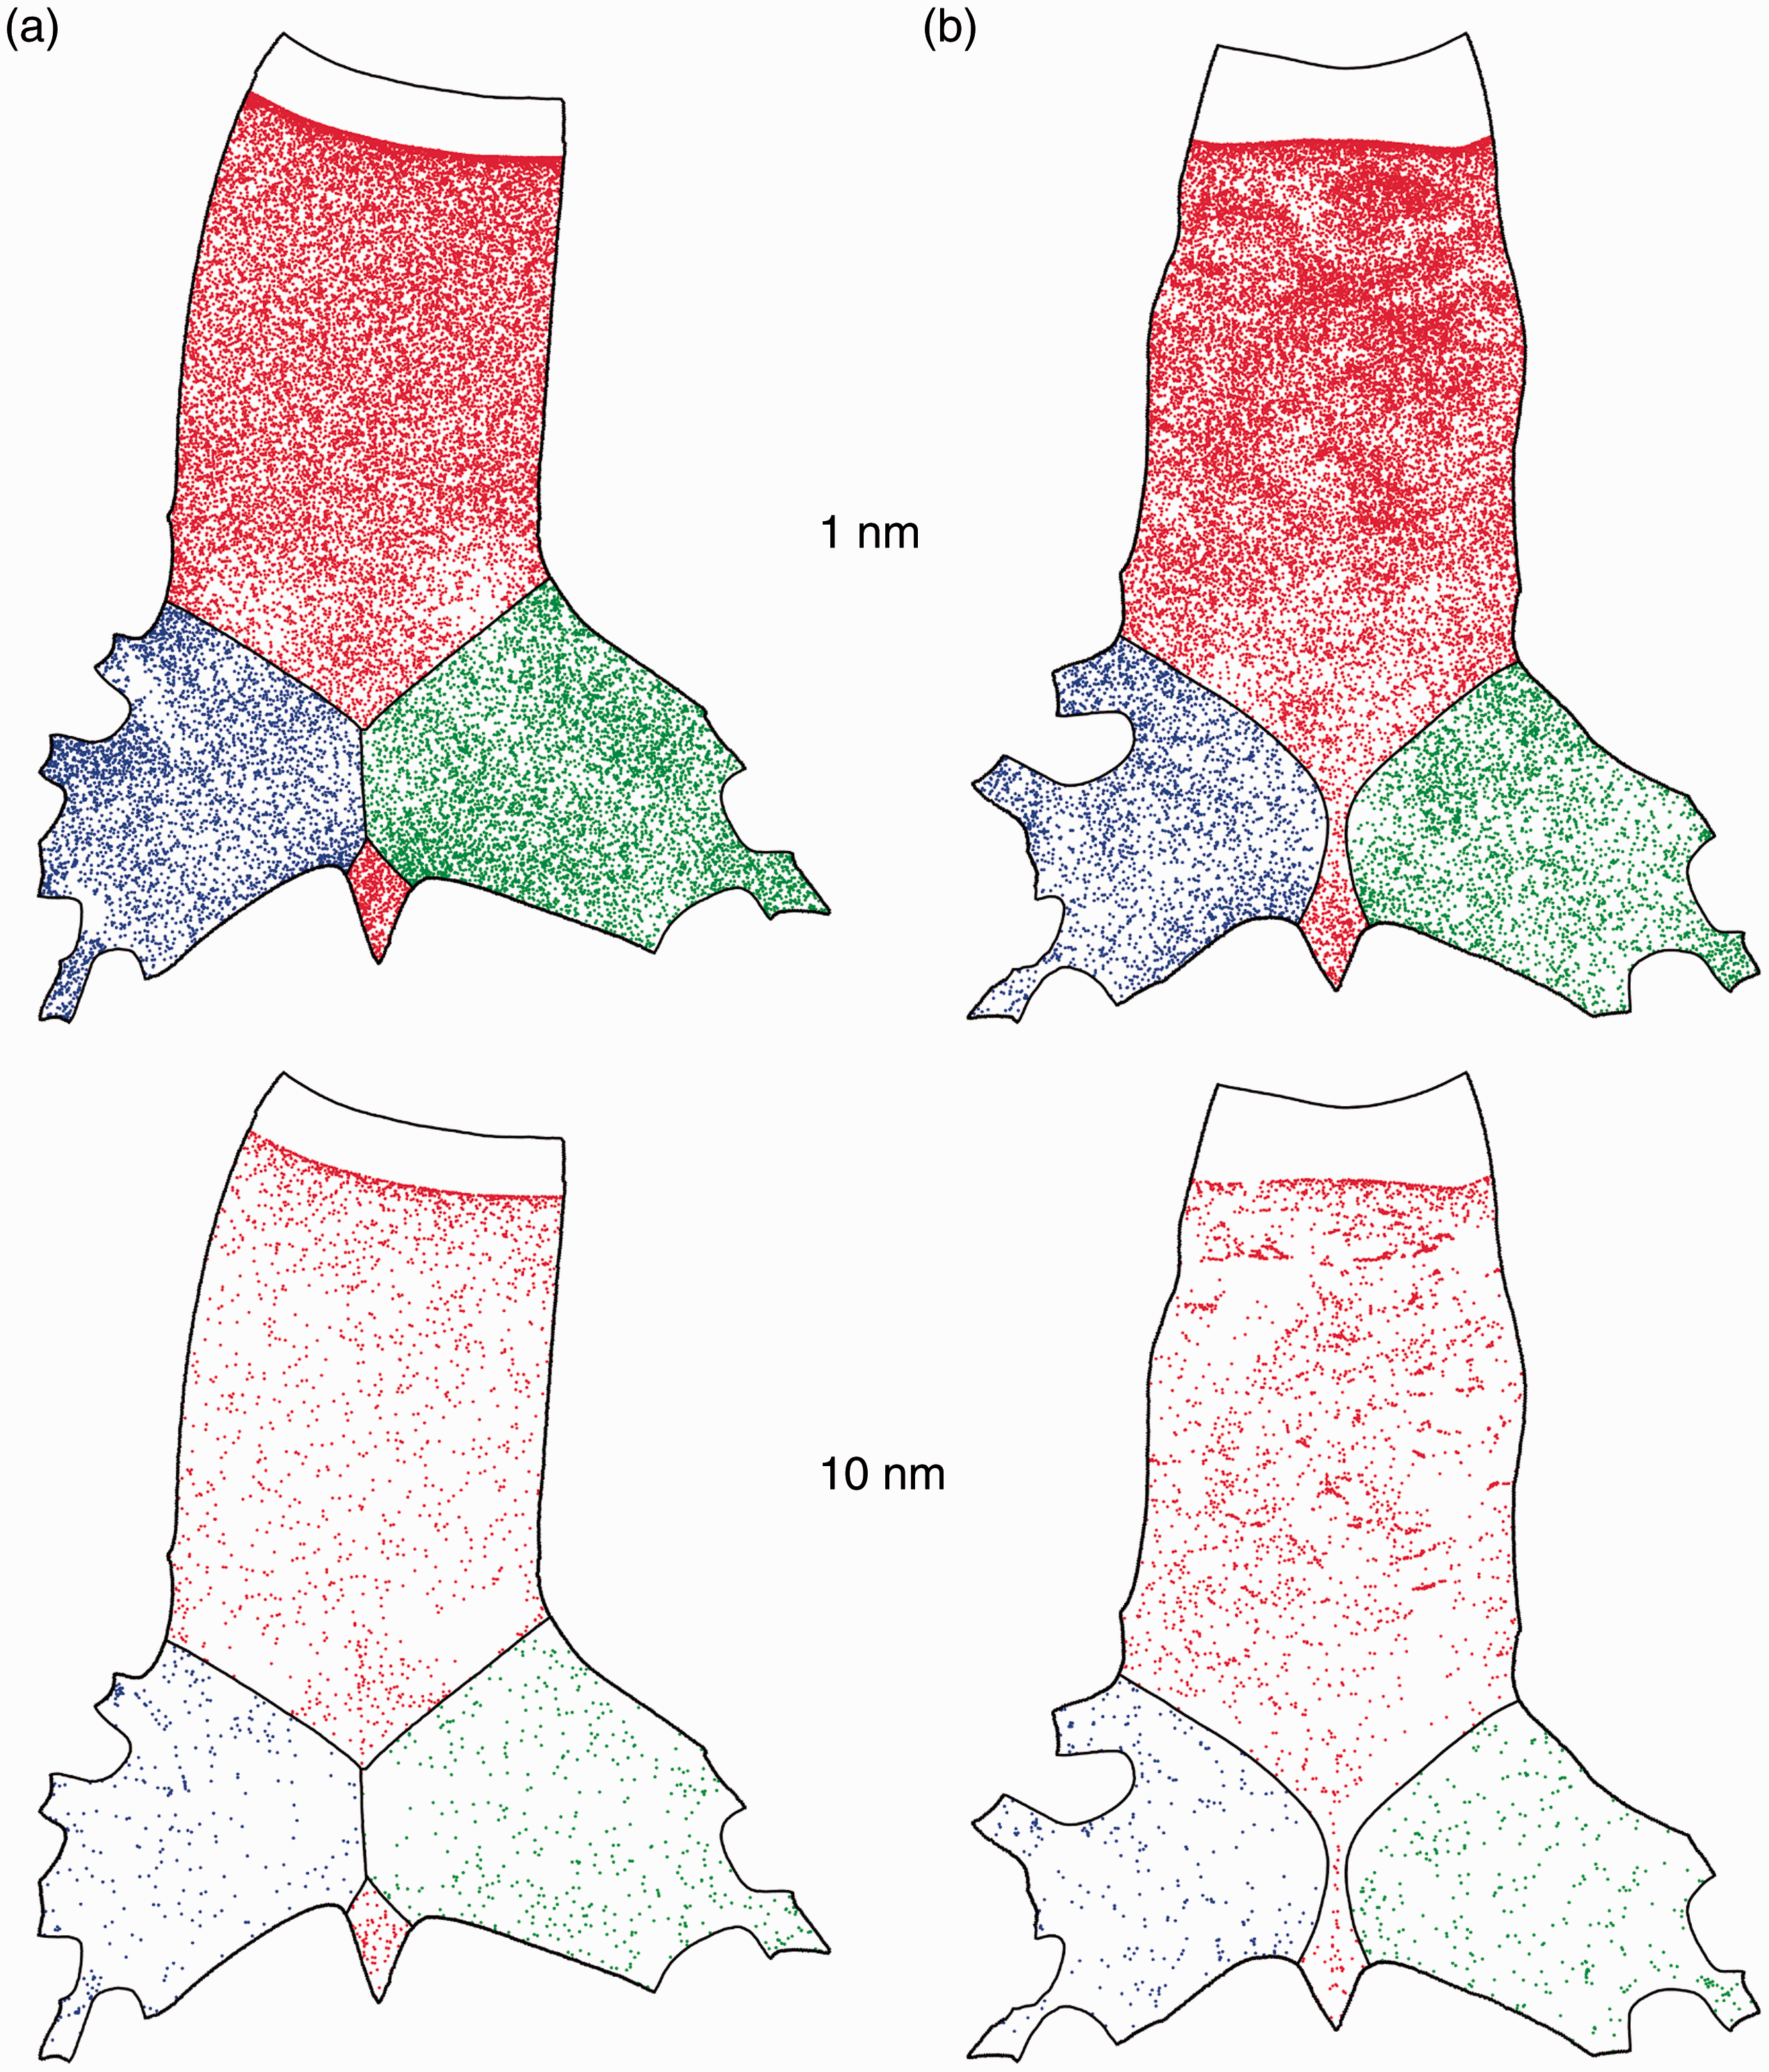
Particle deposition pattern in the 2D unwrapped surface: (a) an idealized model and (b) an anatomical model.
Particle deposition pattern in the anatomical and idealized models showed high correlation, however with subtle differences. Deposition pattern in the idealized model appeared to be more uniformly distributed, while disturbance to particle concentration was observed in the anatomical model in the region where tracheal contraction occurred. This was observed for both 1 nm and 10 nm sized particles. Slightly higher deposition was perceived for 1 nm particles in the left and right bronchi of the idealized geometry than that in the anatomical model. This enhancement of deposition in the secondary bronchi was less obvious for the 10 nm sized particles. In connection to Figures 6 and 8, correlations between particle deposition pattern, wall shear distribution and turbulent activity were clearly exhibited; however, the sensitivity was not extremely high.
Particle deposition efficiency
Figure 10(a) displays the total deposition efficiency of the released particles in truncated tracheobronchial airway models. Experimental measurement on nanoparticle deposition in human tracheobronchial airway casts by Cohen et al. 40 and Smith et al. 41 were plotted for comparison. In the respective experiments, mono dispersed particles of ferric oxide and 212Pb at breathing rates of 18, 34, 20, and 40 L/min were considered. It was shown in Figure 10 that, for the range of particles studied, deposition efficiency decreases with the increase of particle size; therefore, diffusion is the dominant transport mechanism. While general trends agree, anatomical model captured considerable more particles than that of the simplified representation (33% to 78%, Figure 10(b)). The experimental measurement40,41 was in reasonable agreement with simulation, and appeared to match more of the prediction by using the mathematically simplified model. Figure 10(b) displays the percentage difference of the simulated deposition efficiency between anatomical and idealized models and variation in the range of 33% to 78% was exhibited. It was interesting that while large variation in magnitude was observed with smaller sized particles, the percentage difference was monotonically increasing between the two models as the particle size grows. This implied a higher morphology dependency of larger sized nanoparticles in the transport process.
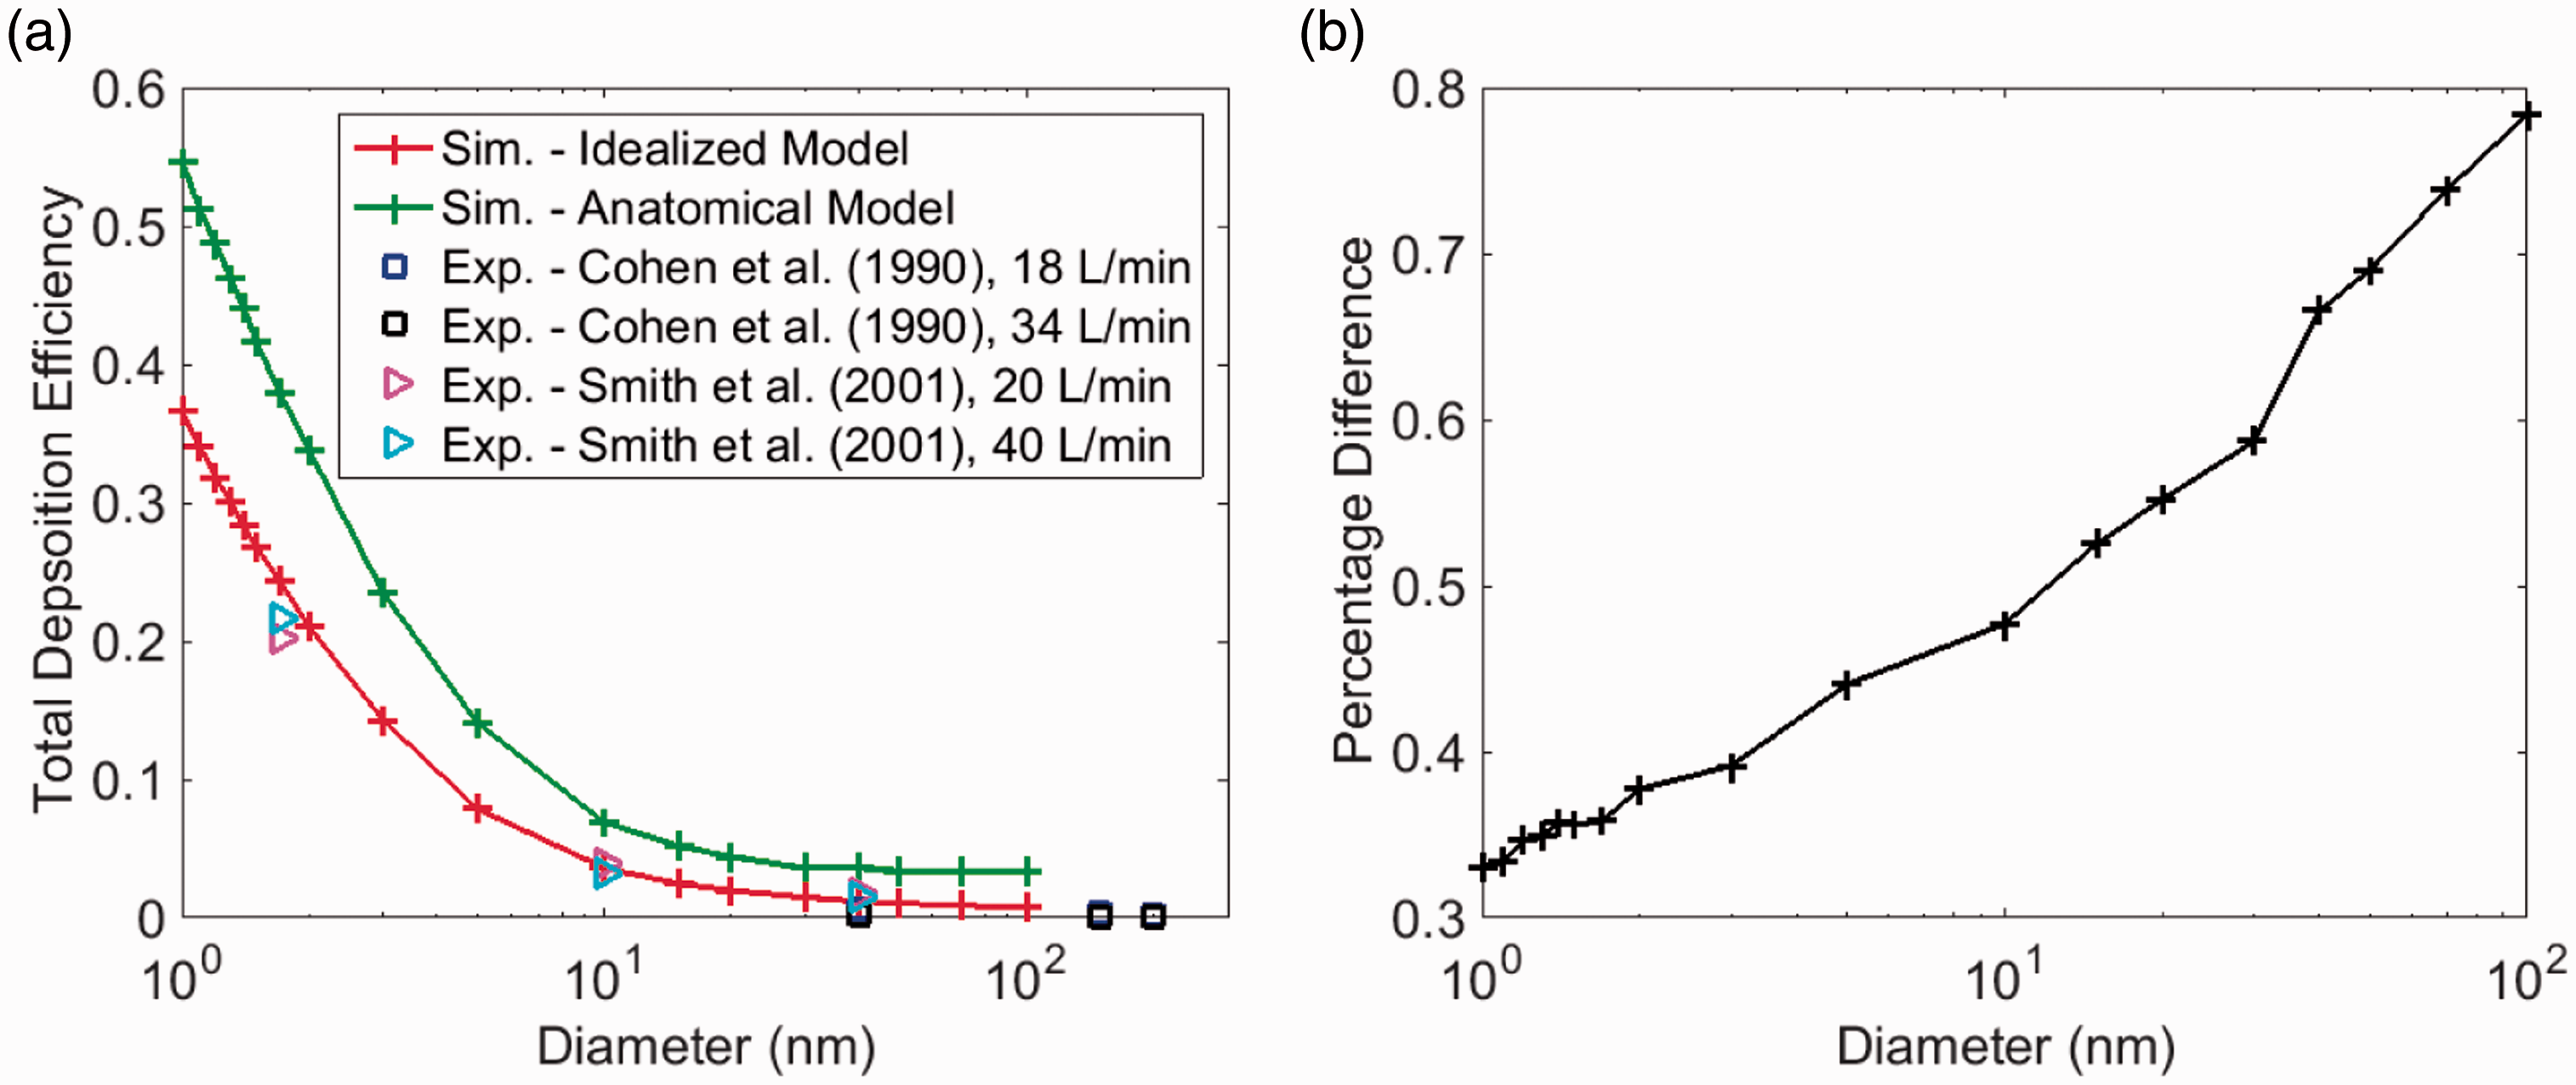
Total deposition efficiency in the airway models: (a) comparison with experiments and (b) percentage difference between anatomical realistic and idealized models.
Figure 11 compares the regional deposition efficiencies in trachea, left and right bronchi in the anatomical and idealized models. Remarkable similar level of depositions were observed in the secondary branches (Figure 11(b) and (c)), while deposition efficiency in the trachea was considerably different. Anatomical model collected considerably more particles in the trachea than that in the idealized model. In connection with Figure 10, it was clear that the variation in the total deposition efficiency between the two geometric models was mainly contributed by trachea deposition. High shear, high turbulent activities and larger magnitude of secondary flow in the anatomical model (Table 1, Figures 5, 6, and 8) all contributed to the enhanced deposition. On the other hand, variation in the wall shear stress (Figure 8) and the secondary flow (Figure 5) patterns, following flow partition, appeared to have limited effect towards particle deposition in the bronchi in the two geometric models.
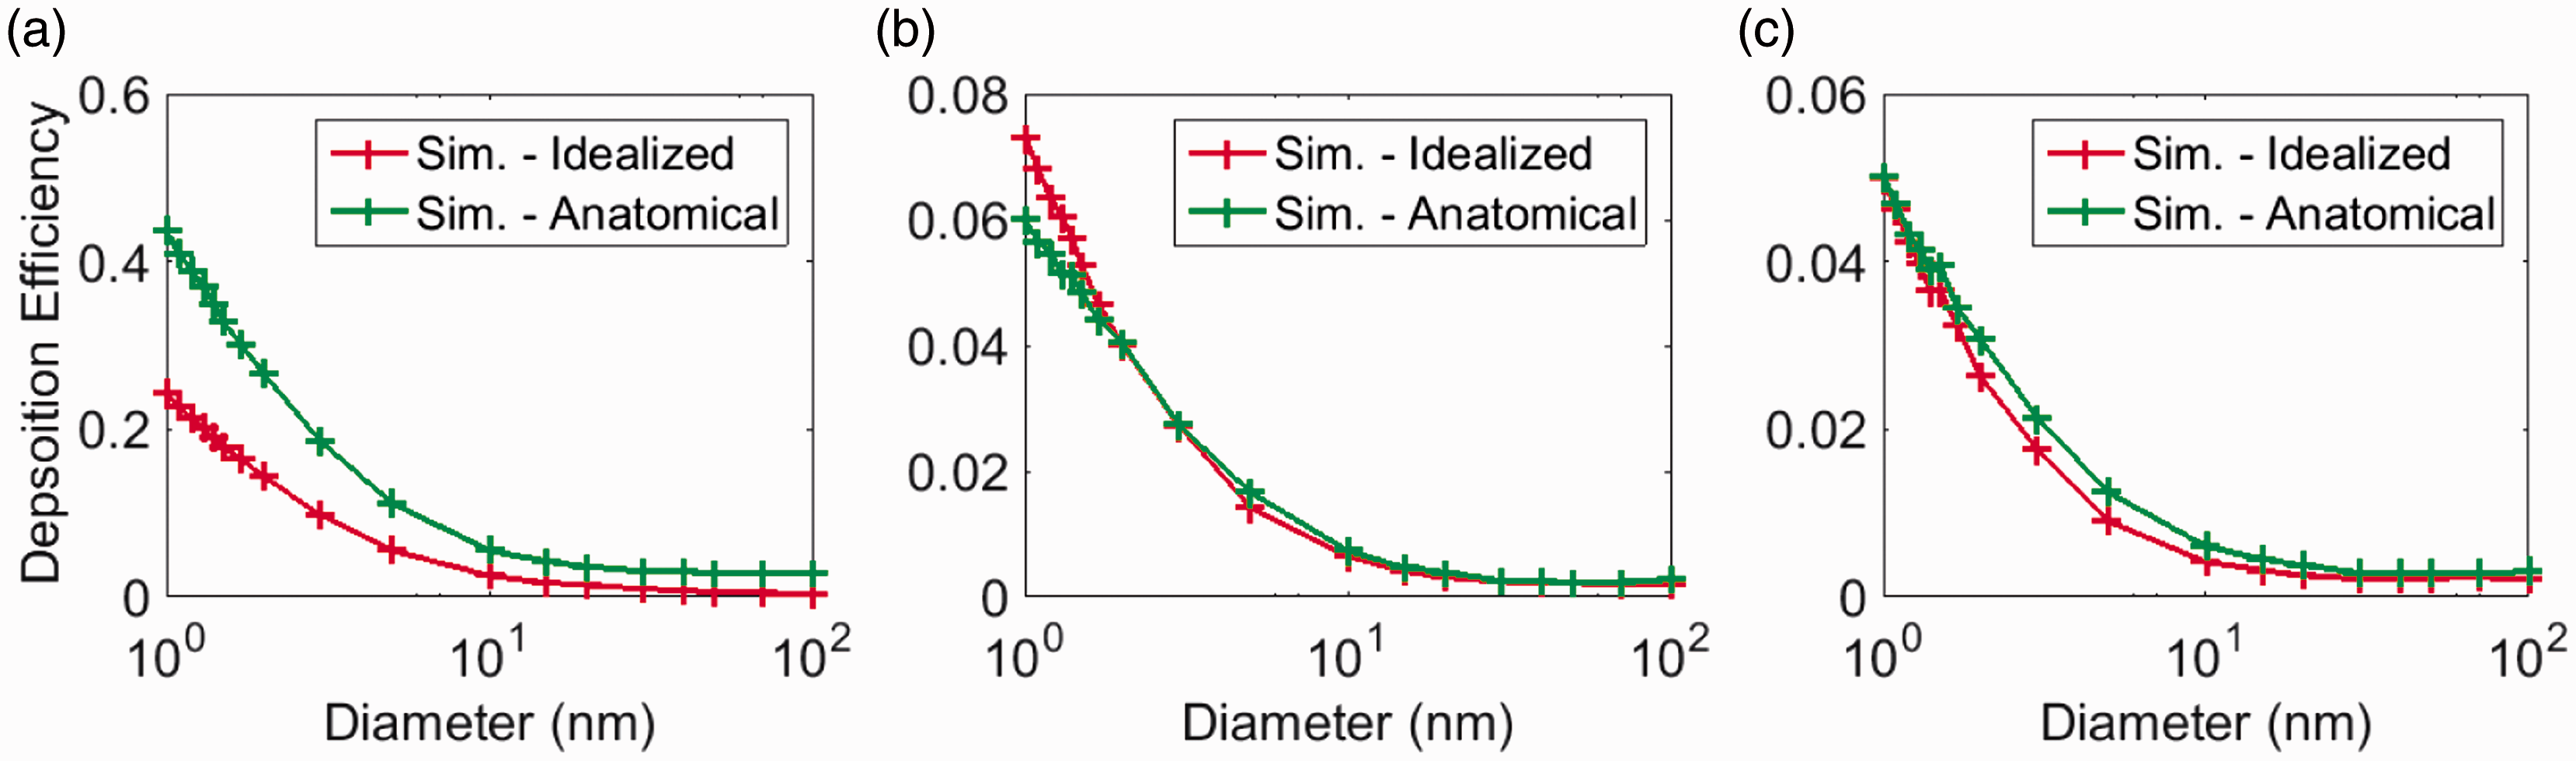
Regional deposition efficiency in the airway models: (a) trachea, (b) left bronchi, and (c) right bronchi.
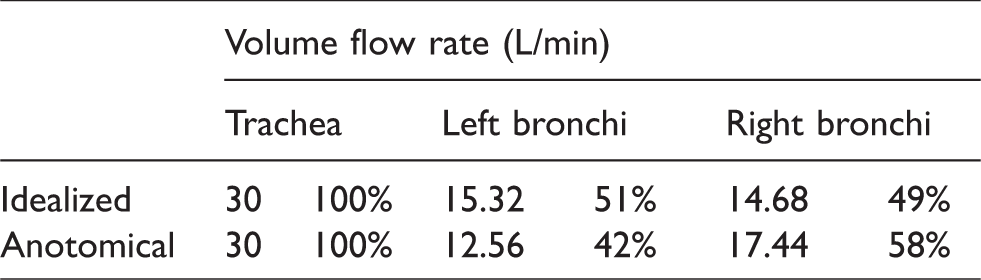
Figure 12 displays the partition (percentage) of the particles that succeeded to enter the next level airway branch through the left and right bronchi. It was seen from the figure that partition of the particles penetrated to the next level was about 45% to 55% between the left and right bronchi for both the anatomical and idealized models. However, consistently more percentage of the penetrated particles went through the left bronchi in idealized geometry than that in the anatomical one. A remarkable correlation between the flow and particle partitions (Table 2, Figure 12) was identified for the 1 nm particles where about 51% went through the left bronchi and 49% to the right in the idealized model. For the anatomical model, about 42% went through the left bronchi and 58% to the right. This observation implied that, for the smallest particles, particle partition in airways followed that of the flow. As the particle size increased, correlation weakened and the left and right proportion approached to each other for the anatomical model, while they departed further away in the idealized model. One explanation would be higher sensitivity to the airway morphology for larger sized nanoparticles, where the shear and secondary flow enhanced the mixing as particles traveled downstream.
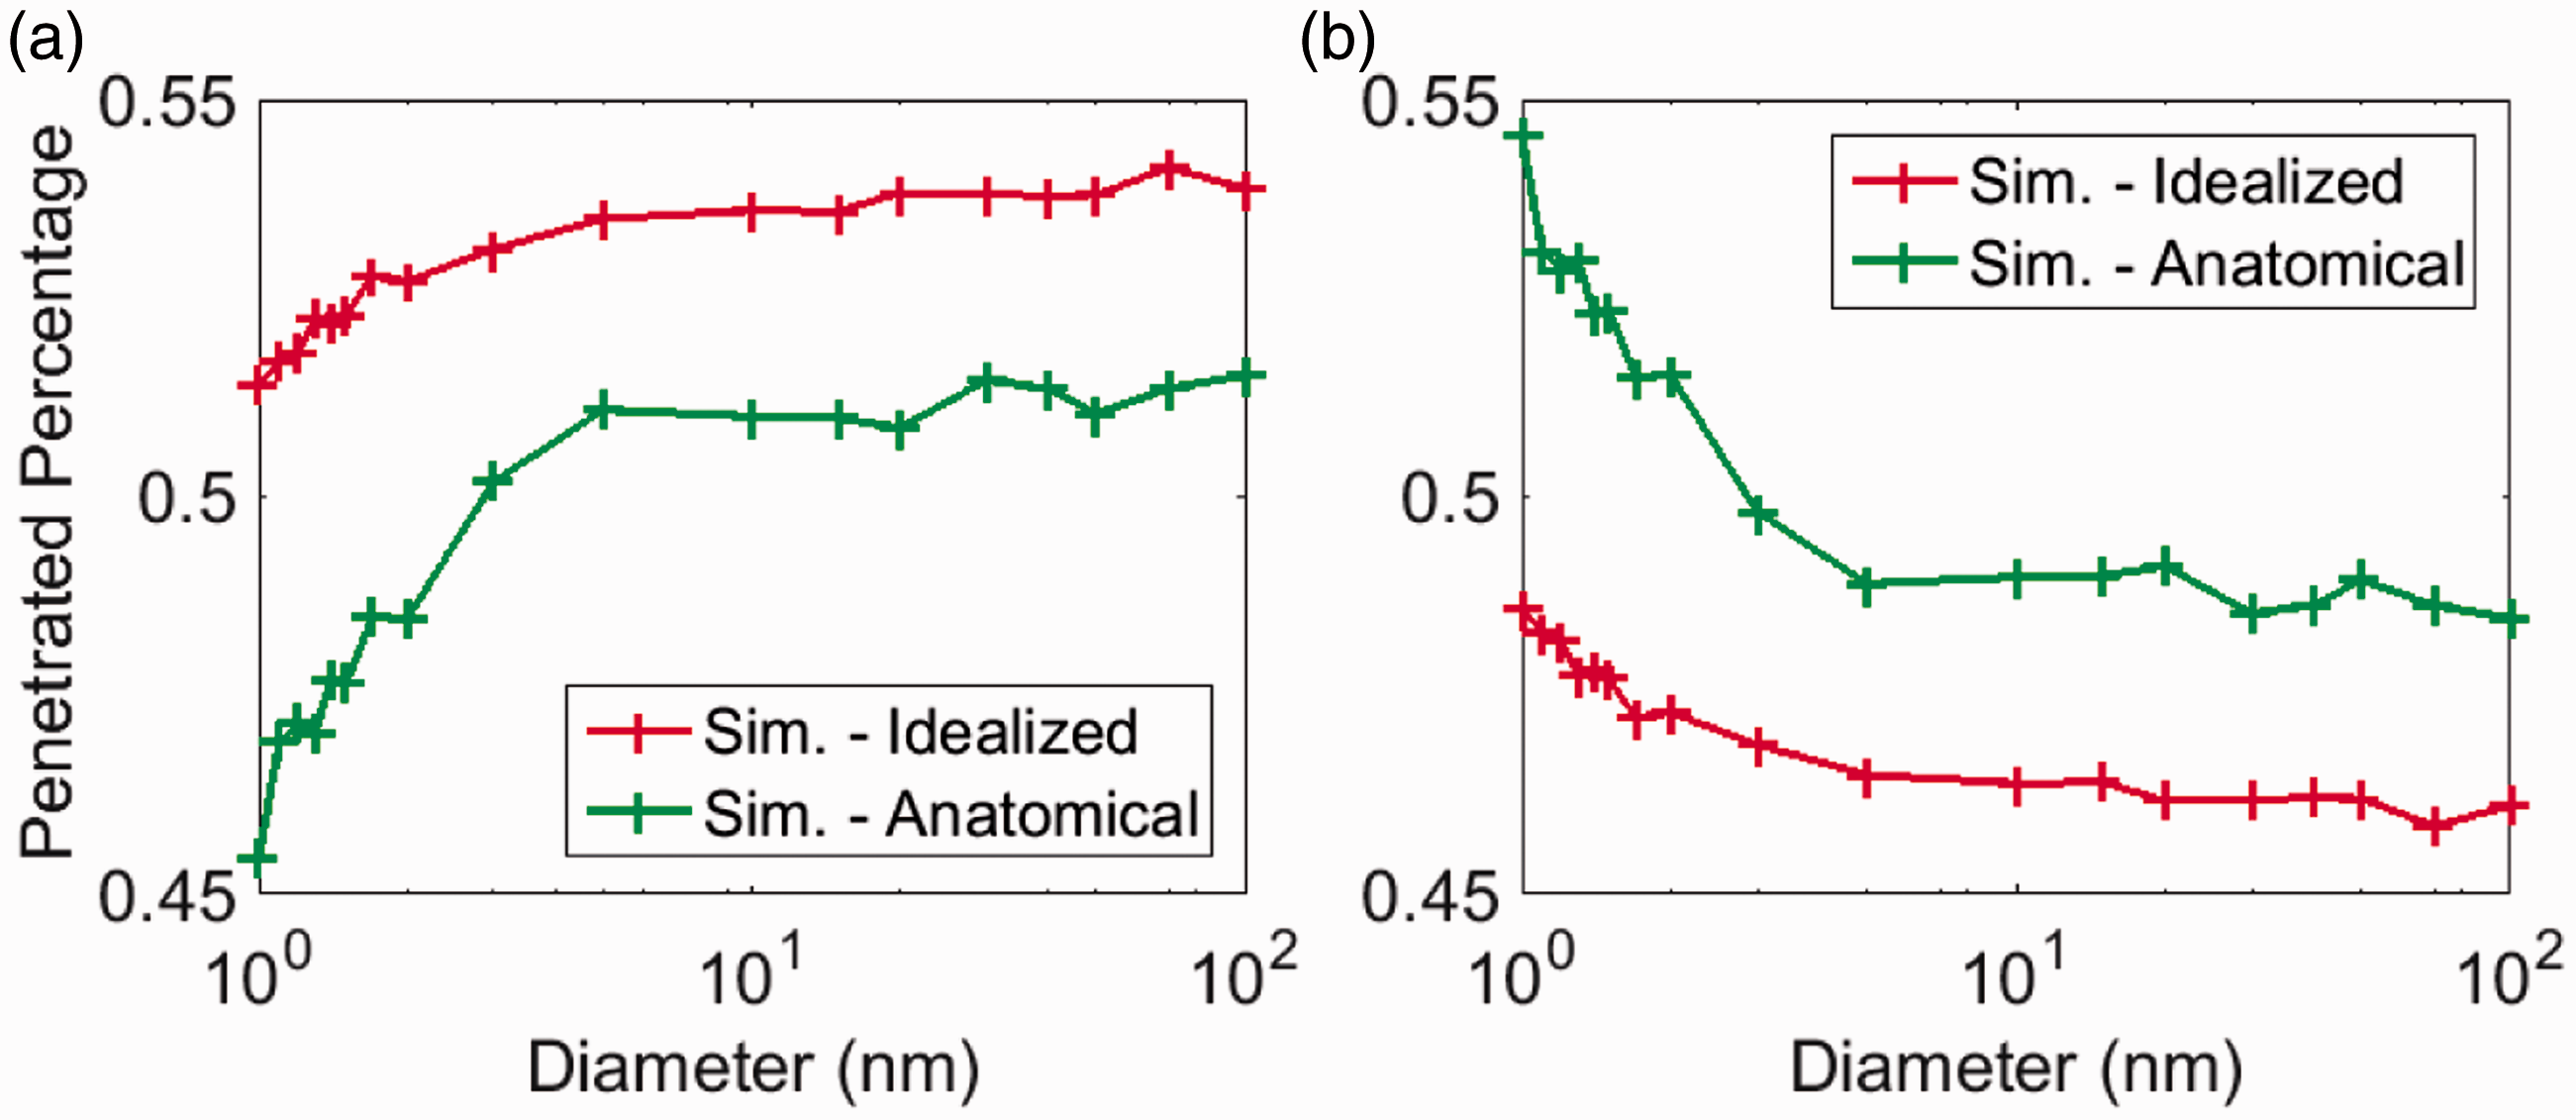
Percentage of the particles penetrated to the next level tracheobronchial tree through: (a) left bronchi and (b) right bronchi.
Flow partition in the airway models.
Conclusions
The current study performed a numerical comparison of nanoparticle transport and deposition in human upper tracheobronchial airways by using an anatomical realistic reconstruction and a mathematically simplified airway model. The study was focused on the variation in breathing airflow pattern, and the effect towards fate of the inhaled nanoparticles in human upper tracheobronchial airways. Based on the study, following conclusions were drawn:
Major irregularity at the trachea and head airway connection induced significant disturbances to the airflow, turbulence, wall shear, and secondary flow distributions, which subsequently affected nanoparticle transport and deposition in upper tracheobronchial airways. Particle transport in the secondary bronchi was less sensitive to morphology-induced disturbance; deposition was more closely related to wall shear while penetration was more affected by turbulence and secondary flow mixing. Smaller nanoparticles tend to conform to the flow partition into the secondary bronchi, and the correlation is weakened as particle size grows. Nanoparticle deposition in the anatomical model was considerably higher than that in the simplified model mainly due to enhanced deposition in the trachea; nanoparticle deposition in bronchi of the anatomical and idealized models were comparable. Effect of morphology on nanoparticle transport and deposition in human tracheobronchial airways is stronger for larger sizes than the smaller ones. While the global characteristics of flow and particle dynamics in the anatomical and idealized models are similar, caution should be taken when interpreting data associated with airway fine details. Further investigation is needed to study the sensitivity of morphology in the human airway particle transport modeling.
Footnotes
Declaration of conflicting interests
The author(s) declared no potential conflicts of interest with respect to the research, authorship, and/or publication of this article.
Funding
The author(s) disclosed receipt of the following financial support for the research, authorship, and/or publication of this article: The financial supports provided by the National Natural Science Foundation of China (grant no. 91643102) and the Australian Research Council (grant no. DP160101953 and DE180101138) are gratefully acknowledged.