
Abstract
Ground effect (GE) behavior occurs when a hover-capable multirotor aerial vehicle, such as a quadcopter, flies within close proximity to the ground and the vehicle experiences an increase in thrust despite constant power being applied to the propellers. Current GE models assume that the ground plane is flat and smooth. This paper investigates the influence of aerodynamically-rough surfaces on GE behavior for standard two-blade propellers under quasi-steady hover conditions. First, a nondimensional model is proposed that incorporates the aerodynamic roughness and zero-plane displacement height of a rough surface with GE parameters previously found in the literature. Second, a GE model that accounts for surface roughness is described. Third, physical experiments are conducted to quantify the aerodynamic properties of controlled rough surfaces and the GE strength through observations of in-ground effect (IGE) and out-of-ground effect (OGE) thrusts produced by commercially available propellers. The results show that aerodynamically rougher surfaces corresponded to higher IGE thrust. Fourth, statistical analysis of the results supported the accuracy of the proposed model, where the average root-mean-squared error is 0.90% with an average maximum error of 2.39% over all test scenarios. Finally, nondimensional analysis confirmed that when similarity conditions are met, the proposed model follows theoretical projections. These findings can be exploited for vehicle motion control, navigation, and design.
Introduction
Hover-capable aerial vehicles that use propellers to generate lift are versatile and ubiquitous. For example, the Boeing H-47 Chinook rotorcraft is often used for transportation of military personnel and equipment, while smaller personal quadcopter uncrewed aerial vehicles (UAVs) are being used for photography, disaster management, agriculture, and remote sensing.1–4 More recently, rotorcraft UAVs have been developed for autonomous environmental monitoring applications including chemical-leak identification, mapping, and localization.5–10
One of the main benefits of the rotorcraft design is its ability to hover, loiter, and slowly fly near the ground. However, as the propellers come close to the ground, increased thrust is observed, despite constant power being applied.11–13 Stated another way, because of the increase in thrust, less power is required to maintain constant height while operating within the in-groud effect (IGE) zone. The natural phenomenon that occurs when the propellers are within “close” proximity to the ground is commonly known as ground effect (GE). The GE occurs due to the rotors’ wake interacting with the disturbing entity.14–17 Understanding GE behavior can be leveraged to improve rotorcraft design and motion control.18,19 For example, previous ground effect modeling and experiments have been used to design control systems that compensate for IGE, substantially enhancing the vehicle’s take-off, landing, and near-ground flight performance.18,20–23
There are three main considerations when studying ground effect for a rotorcraft: (1) the rotor-blade geometry, (2) the nature of the fluid, and (3) the characteristics of the ground. This paper focuses on the latter, studying the impact of different ground surfaces, specifically their aerodynamic properties on GE. Currently, studies13,16 that describe the impact of surface conditions on the ground effect on rotorcraft UAVs are limited. The main contribution herein is to bridge the existing knowledge gap.
Figure 1 shows examples of a quadcopter UAV hovering over different terrain within the IGE region. In Figure 1(a), the UAV hovering over a solid bed of rocks will experience GE at a different strength compared to hovering over grass (Figure 1(b)) or loose dirt (Figure 1(c)). Furthermore, hovering over dense grass will result in GE different from hovering over a bush (Figure 1(d)). Both are relatively elastic compared to rocks or soil. Previous works13,16 have observed that different surfaces incur GE at different magnitudes, but no systematic study of the effect of surface roughness was performed. Therefore, the current understanding and application are confined to IGE on solid flat surfaces. Existing models are also unable to capture the impact of rough surfaces. Herein, the main contribution is to bridge the knowledge gap by performing experiments and developing a model that relates the IGE thrust ratio to surface roughness.

Quadcopter UAVs hovering in-ground effect over different terrain: (a) bed of rocks, (b) field of grass, (c) patch of dirt, and (d) plant with branches and leaves.
Although it has been mentioned in the literature,13,16,24–27 the impact of different surfaces on the performance of a propeller IGE is not well understood. Some studies have briefly touched on this topic,24,26,27 while others study the effects of partial ground and ceiling surfaces on propeller performance, showing how finite-size obstacles influence the thrust and power characteristics. 28 It has been suggested in He 24 that influences from a surface are due to the surface stiffness and aerodynamic roughness. In more general terms, the ground effect is determined by surface material properties and aerodynamic interactions with surface geometry. The focus of this work is the latter of the two, and the former is left as future work.
This work considers the two configurations shown in Figure 2, where the propellers are positioned above a surface on which GE is observed. Figure 2(a) shows two scenarios: a propeller hovering over a flat smooth surface (1) out-of-ground effect (OGE) and (2) IGE. Figure 2(b) shows the same situation, but the surface has roughness elements conceptualized as simple repeating blocks.

UAV propeller above a surface where ground effect is observed: (a) hovering IGE at height
The main contributions of this work are: (1) an experimental characterization of the ground effect over surfaces with different roughness values, (2) an empirical IGE model that incorporates surface roughness based on non-dimensional analysis, and (3) the validation of the model through physical experiments.
Nomenclature
The following nomenclature is used in this paper:
Ground effect and aerodynamic roughness
Quasi-steady ground effect for two-blade propeller over flat smooth surfaces
The most fundamental study on ground effect focuses on a two-blade rotor in hover over a solid flat surface. In this quasi-steady state, ground effect is more evident than in other flight modes, such as forward flight.11,29–31 In 1955, Cheeseman and Bennett
11
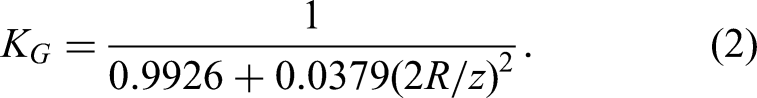
proposed a model to estimate the ground effect ratio, which has been used extensively to compensate for ground effect.20–23,32 The model is derived analytically from the method of images and is confirmed to be reasonably accurate using empirical helicopter thrust data. Using thrust data, the ground effect ratio was calculated based on the height of the vehicle above the ground,

Another widely popular GE model was proposed by Leishman,
12
Eberhart,
16
Bernard et al.,
32
Hayden,
33
Pulla,
34
and Light,
35
In an attempt to characterize a more universal expression, an exponential model was developed by He et al.,
18
He,
36
and He and Leang,
37
given by

In equation (3), coefficients


Aerodynamic surface roughness
The aerodynamic surface roughness is the height at which wind speed over a surface theoretically becomes zero due to the shear stress or drag force over said surface. Often, it is accompanied by a zero-plane displacement height, which is manifested due to the density of roughness elements (RE) causing a skimming effect in the airflow.38,39 Aerodynamic roughness is widely used in the meteorological community to describe the aerodynamics of complex geometries and terrain features in a succinct way.40–47 In statically-neutral conditions, the relationship between wind speed and the ground’s aerodynamic properties is given by

Although the aerodynamic roughness can be quickly calculated using wind speed measurements, there have been many attempts to characterize the length in terms of more easily observable geometric parameters, however, currently, all expressions for roughness and displacement height are purely empirical and rely heavily on RE of roughly the same size and shape.40,41,44,45,48,49
While equation (6) is mainly used for wind speed profiles over large terrain, the same velocity profile has been observed on smaller scales. Nikuradse,
50
and later Gul and Ganapathisubramani,
51
observed similar logarithmic velocity profiles in fluid pipe flow experiments. Roughness was artificially created by gluing sand grains to the inside of the pipes. Perry et al.
52
expanded the understanding of velocity profiles over rough surfaces by introducing the concepts of

Example of (a)
In both types of roughness, extrapolation of the logarithmic flow profile shows a theoretical zero velocity above the ground plane correlating to an aerodynamic roughness and zero-plane displacement height. However, in
Nondimensional model
The Buckingham
Key variables used in nondimensional analysis for a two-blade propeller in IGE hover over a rough surface.

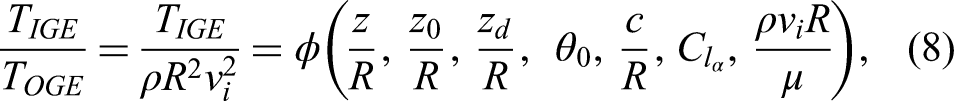
The IGE thrust,
The OGE thrust value can be rewritten as a function of the rotor radius, induced velocity, and fluid density using momentum theory,
12

Ground effect model for surface roughness
Aerodynamic roughness, 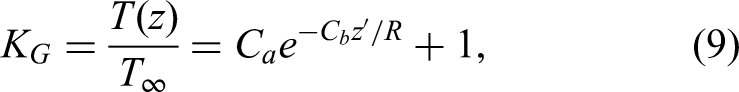

Comparing the model, equations (9) and (10), to the nondimensional model in equation (8), the 
Experimental apparatuses
Two main experimental apparatuses were developed and used to observe and quantify GE of a two-blade propeller in quasi-steady hover over artificially-generated rough surfaces. First, the aerodynamic parameters of rough surfaces were measured in a wind tunnel. Second, the GE thrust produced by propellers of varying size over rough surfaces were measured.
Rough-surface elements
Rough surfaces were generated by mating RE composed of LEGOTM bricks, arrayed in a grid pattern, to a LEGO base plate. Individual blocks, representing the RE, had dimensions of roughly 32-mm length by 32-mm width by 38.4-mm height, excluding the height of the studs. The spacing,
Wind tunnel test facility and conditions
Surface roughness experiments were performed in an open circuit tunnel, as shown in Figure 4. A fan in the rear draws air into the inlet, then moves the air through the honeycomb straighteners and settling chamber for flow conditioning before flowing over the test setup. A pitot tube was used to capture the logarithmic wind-speed profile over each test surface by taking wind-speed measurements at varying heights above the RE.
To properly create the logarithmic wind-speed profile required to calculate the aerodynamic roughness of each surface, a fully developed turbulent flow that simulates an atmospheric boundary layer (ABL) is required.53,59 The method Counihan
60
established was shown to create flow conditions similar to the ABL inside a wind tunnel with no major spanwise variation and his method was employed here. Figure 5 is a view of the interior setup; showing vortex generators and a barrier wall used to create artificial ABL conditions over the fetch of RE. Static conditions in the wind tunnel were neutral (i.e., no buoyancy) and the lowest height probed was no less than 1.5 to 2 times the average height of the RE as stipulated by Macdonald et al.
41
and Wiernga.
47
A combination of a barrier and vortex generators (VG) were used to “trip” the airflow (see Figure 5). The vortex generators (VGs) take the shape of a quarter-elliptical wedge with an angle between 5 and 6 degrees. The height of the VGs can vary, but determines the approximate height of the modeled ABL.60,61 Vortex generators were spaced 0.5 to 0.6 times the height of the generators from each other. The barrier wall was

Exterior view of the open-circuit wind tunnel setup.

Experimental setup from inside the wind tunnel facing the inlet.
Details of test propellers
Six commercial-off-the-shelf (COTS) two-blade carbon fiber propellers of varying sizes were tested. The specifications for each propeller are found in Table 2, where each propeller has an associated reference number indicated by “ID No.”. Size indicates the manufacturer’s designated propeller size where the number preceding the “x” is the propeller diameter, the number after is the propeller pitch, both in units of
Specifications for six propellers used during ground effect measurement experiments.

Ground effect measurement Process
The GE phenomenon can be observed by comparing IGE and near-OGE (NOGE) thrust values. To measure propeller thrust values, a custom ground effect test stand, shown in Figure 6, was designed and built which automatically raises and lowers an attached propeller to specified heights before activating the propeller, taking measurements, and remotely reporting subsequent average thrust values to a nearby computer for post-processing and analysis. Propeller thrust values were measured using a lever-type mechanism where the propeller is on one end and a load cell resides on the other as shown in Figure 6.

Experimental setup for ground effect measurement along the
Similar to Figure 2(b), a propeller actuated over a test surface made up of a block array, is taken from heights within the GE region to NOGE heights. A relatively smooth and flat concrete surface below the propeller, was used as a control surface (see Figure 2(a)). To capture the GE profile, thrust values from a propeller under test were measured at incremental heights over each test surface. The ground effect test stand was set to bring a propeller to specified heights depending on the radius of the propeller under test to ensure both IGE and NOGE thrust values were measured. Previous studies have shown that for propellers of radius
Following conclusions drawn from He and Leang, 15 and Bernard et al., 62 the angular velocity rather than applied power was kept constant. This was accomplished by specifying pulse-width modulation signals to the motor electronic speed controller. It is of note, that while traditional ground effect experiments either focus on maintaining constant thrust or power, it has been shown experimentally, that for small rotorcraft such as small UAVs, applying constant angular velocity, rather than power, can result in accurate IGE thrust ratio measurements.15,24,62
Results, analysis, and discussion
Wind tunnel results
The results acquired in the wind tunnel include the wind-speed measurements, aerodynamic roughness, and displacement height. The wind speed measurements at various heights over each test surface were fitted to equation (6) to estimate the aerodynamic roughness and displacement height values. An example using the measurements from the surface with RE spaced 128 mm apart is plotted in Figure 7. The full summary of values calculated for each test surface is given in Table 3, as well as the estimated values using empirical models found in Grimmond and Oke,
40
Lettau
44
and Kutzbach.
49
While estimating
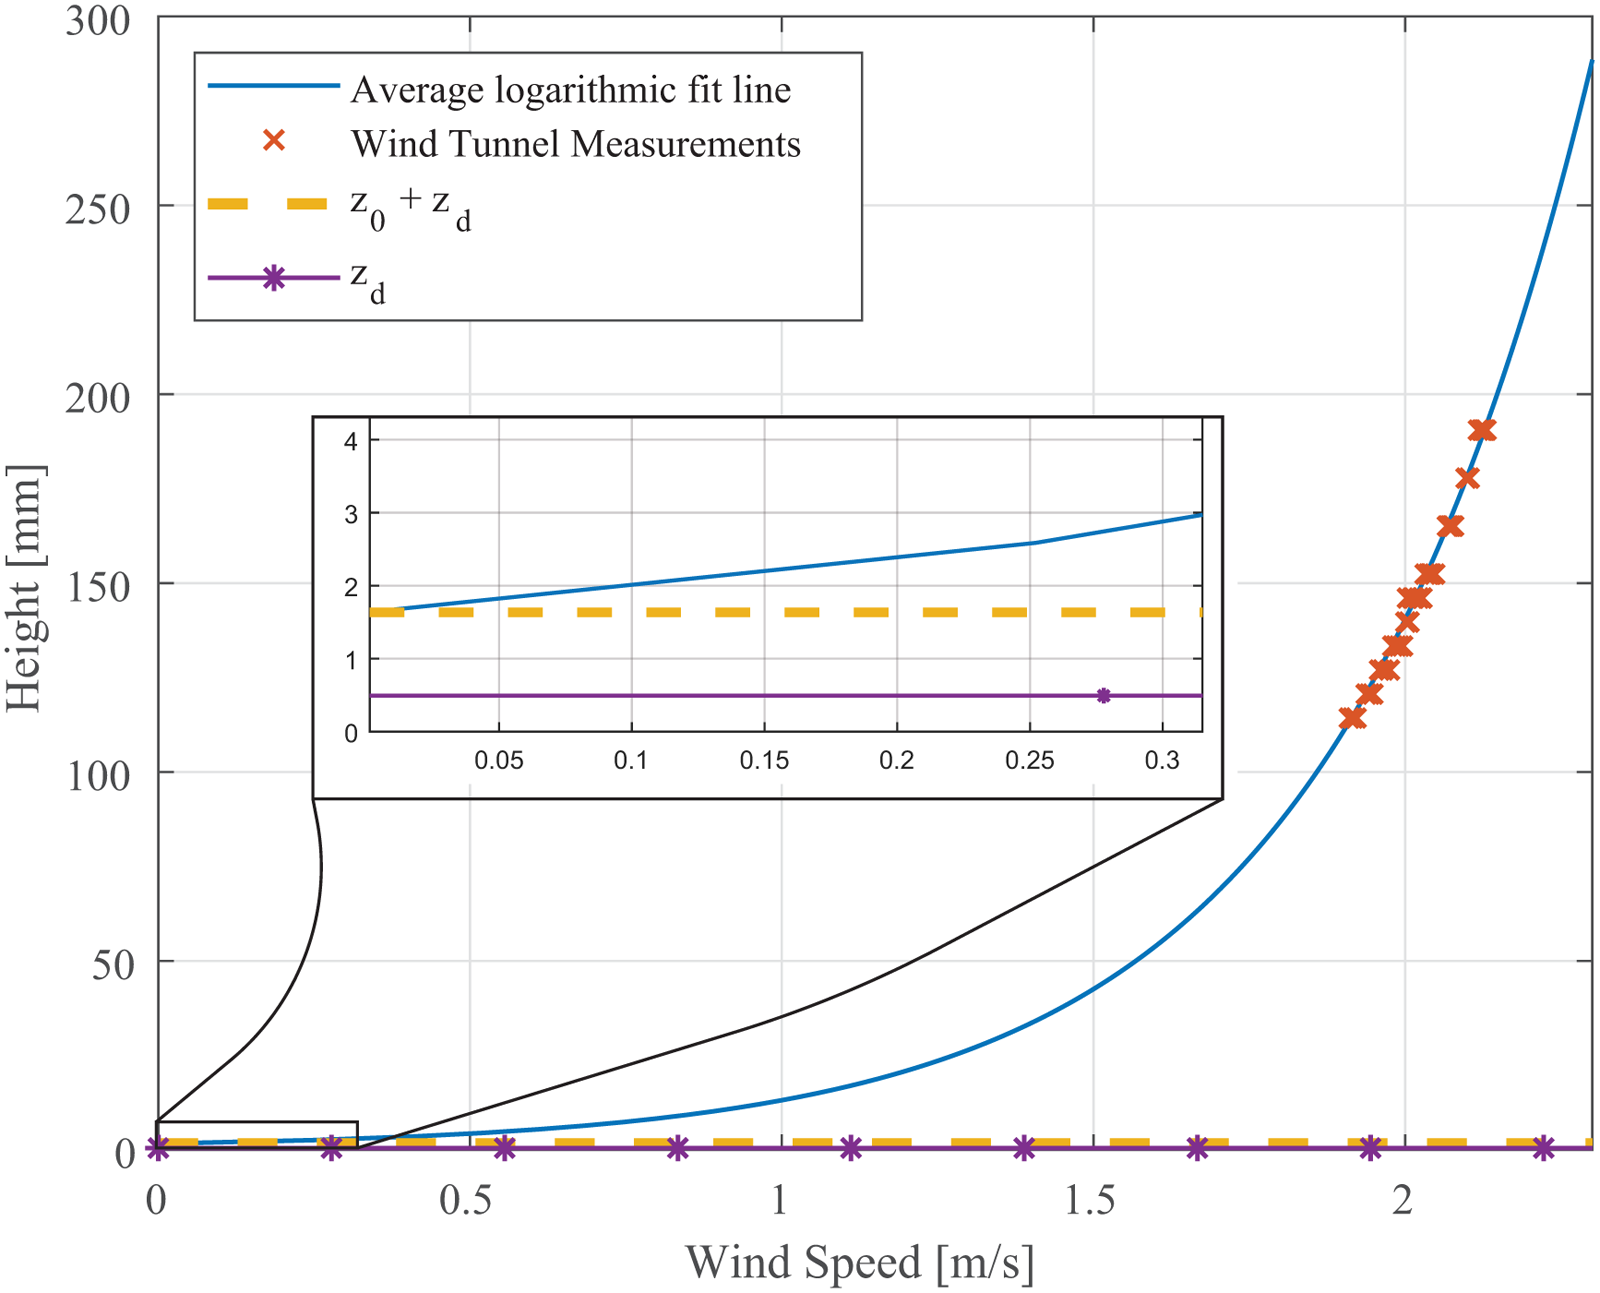
An example of wind tunnel measurements fitted to equation (6) for the surface with RE spaced 128-mm apart.

Estimates using methods from Grimmond and Oke, 40 Lettau 44 and Kutzbach. 49 are based on either the plan area index, the ratio of RE plan area to the total area covered, or the frontal area index, the ratio of RE facial area normal to the direction of airflow to the total area covered. As shown by Grimmond and Oke, 40 there exists a sizeable margin of reasonable roughness parameters for any given plan area or frontal area index. Comparing the measured roughness parameters to the calculated estimates, it can be seen that they are within the order of magnitude from one another. Given that the scale is in millimeters and combining it with, 40 the values measured from experiments are fair.
It is worth noting that the use of LEGO blocks creates a rather homogeneous surface pattern resulting in a uniform roughness. Real world surface roughness will have localized variations depending on their surface composition. This study seeks to limit such factors so that the effect of surface roughness can be studied in a more direct manner.
Ground effect results
The ground-effect profile can be easily visualized as rotor thrust ratios at different heights. Figure 8 shows the results of the measured GE thrust ratio at the sampled heights over the surfaces with RE spaced 32 and 96 mm apart compared to the surfaces without roughness elements and without the studded plates for propeller 16. It illustrates a common theme: generally, as the roughness (

Measured IGE thrust ratios across the array of sampled heights over surfaces of varying roughness for propeller 16. Surfaces selected for display were limited for clarity.
The measured ground effect thrust ratios, across all surfaces, decrease exponentially as the height of the propeller from the surface increases. In fact, the underlying characteristic relationship between the thrust ratio and propeller height is exponential of the same form as the model in equation (3). Motivated by this observation, the following form is used to quantify the effect of surface roughness on the GE thrust ratio:
In model equation (3), the coefficients

The calculated GE

The calculated GE
Comparing the standard deviations of the GE coefficients between the different propellers, it is first concluded that propellers 9 and 11 have significant outliers not ideal for further analysis. This may be due to the lack of sensitivity of the instruments used in observing ground effect at the smaller scale. The analysis to validate the proposed model will focus on the results obtained from the larger propellers, namely propellers 13 to 16.
Statistical analysis and discussion
From Figures 9(a)-(d), it can be seen that surfaces with increased roughness generally correlate with higher maximum increases in ground effect, and as mentioned, the smaller the propeller, the less the trend is visible, as illustrated in Figures 9(e) and (f). This is especially apparent when data from each propeller is plotted on the same graph, as in Figure 11. Statistical analysis was performed between the datasets for each propeller to determine whether or not this observation is supported. Student’s t-tests were used to compare the means of each dataset. Student’s t-tests are an established method to determine whether the means of the test datasets were significantly different from the control or not.
63
A p-value is the probability of obtaining results equal to or more extreme than the observed data.
64
The calculated p-values between each test dataset and the control are presented in Table 4. Using a typical alpha-value of 0.05, it can be seen that there were significantly different means for datasets from rougher surfaces, and the results in Figures 9(a)-(d) confirm that the difference between the control and a rough surface is negative. Additionally, Table 4 shows that

Combined measured GE
The

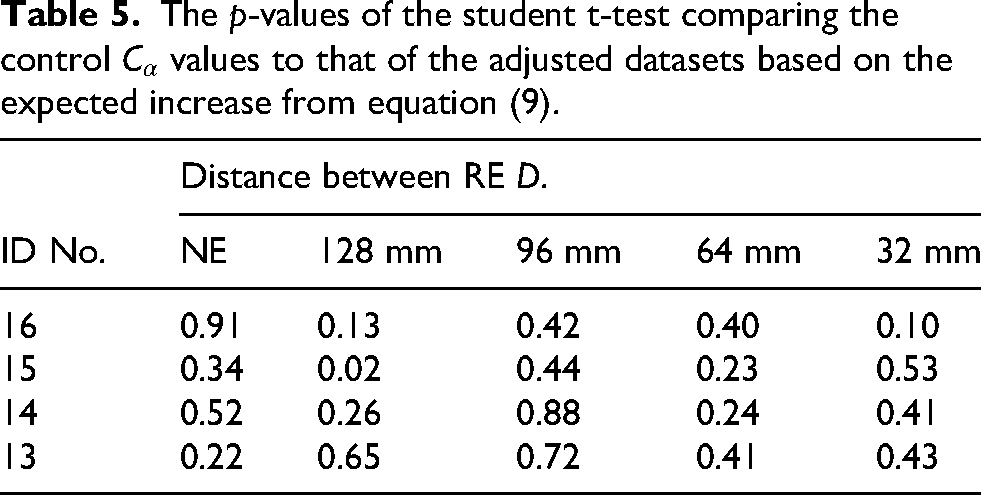
The next question to answer is whether the proposed model can accurately predict the increase. Using the proposed model, equation (9), and the model for IGE thrust over a solid flat surface, equation (3), an expected increase in
T-tests were used to confirm whether or not the difference between the control and adjusted values are significant (Table 5). Rough surfaces with means previously shown to be significantly different than the control no longer support the same conclusion. Additionally, the
The proposed model’s predicted 
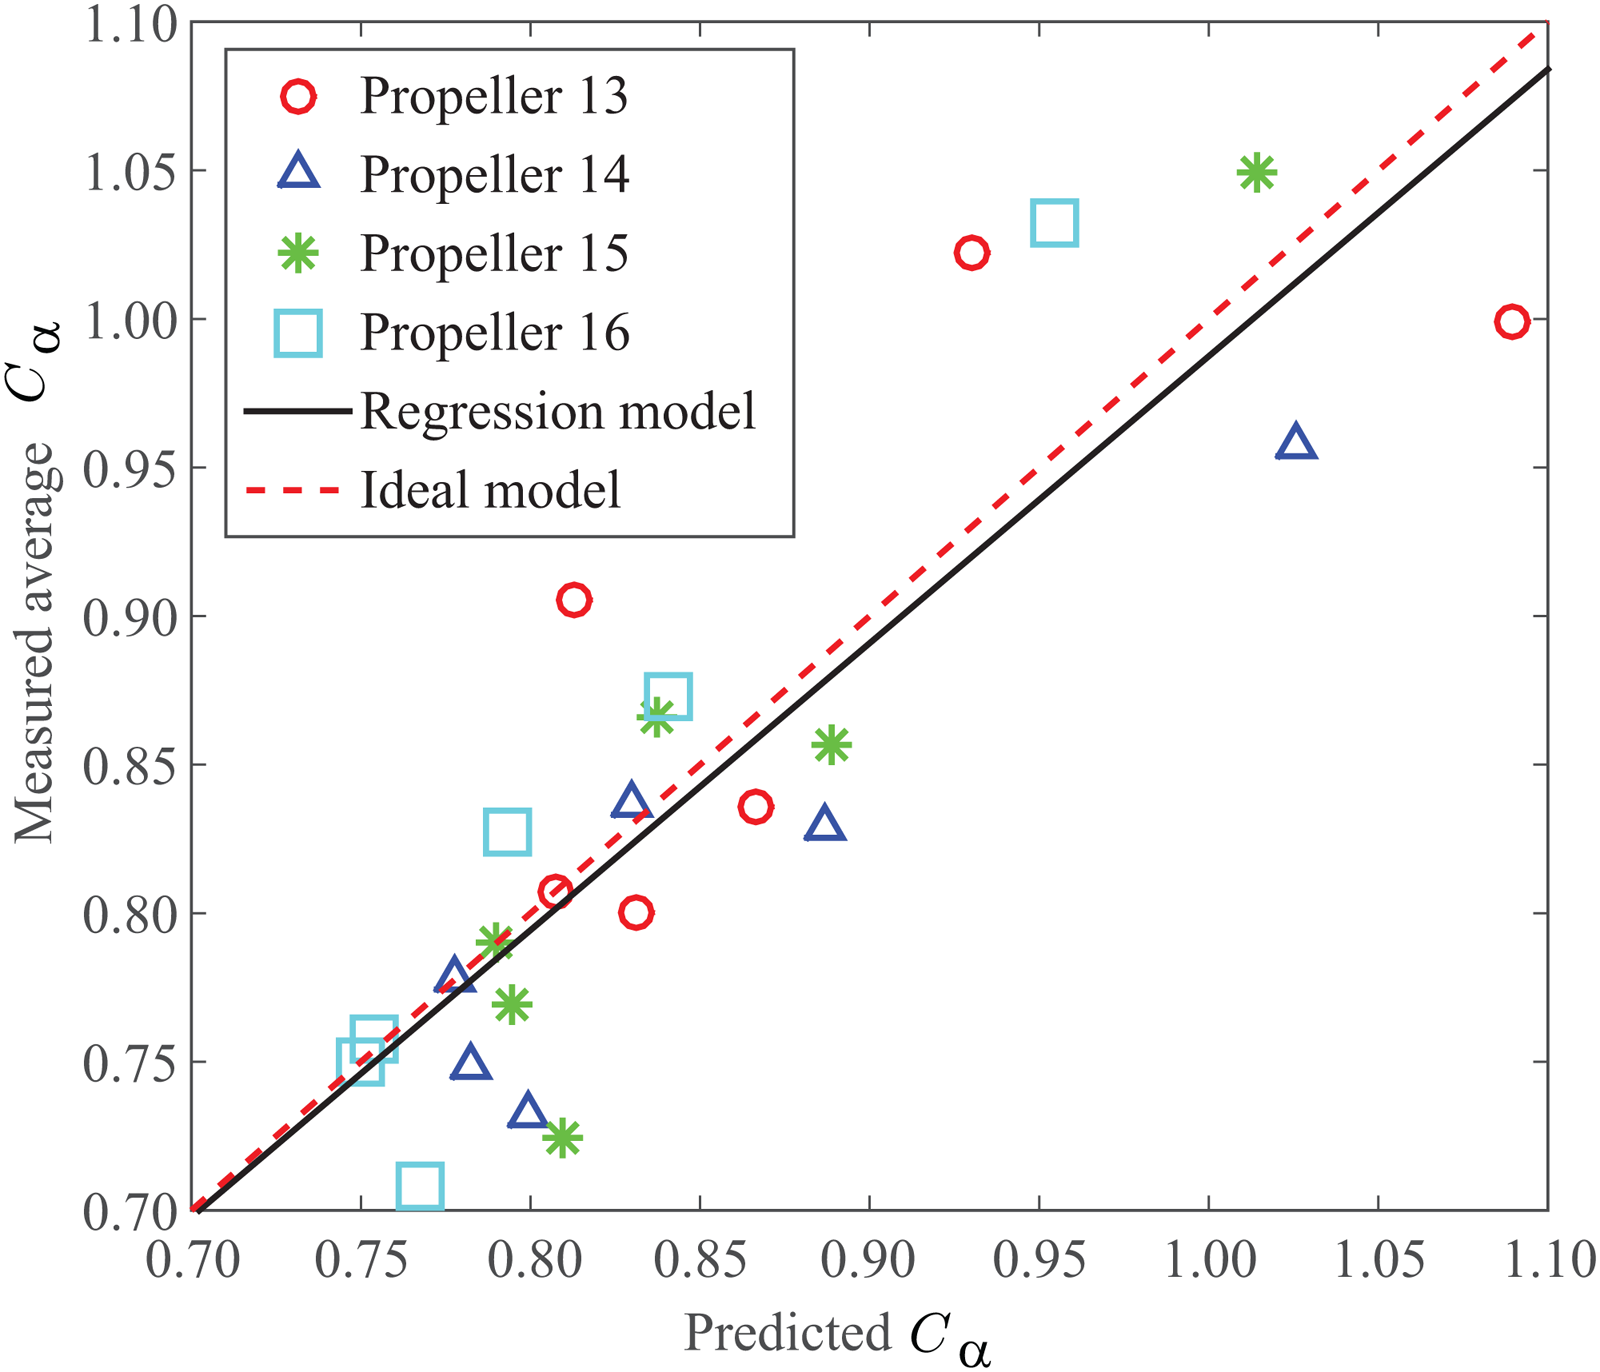
Regression analysis comparing the proposed model’s predicted maximum increase in ground effect
The
According to the proposed model, the distribution of ground effect strength over height, encapsulated in coefficient
The

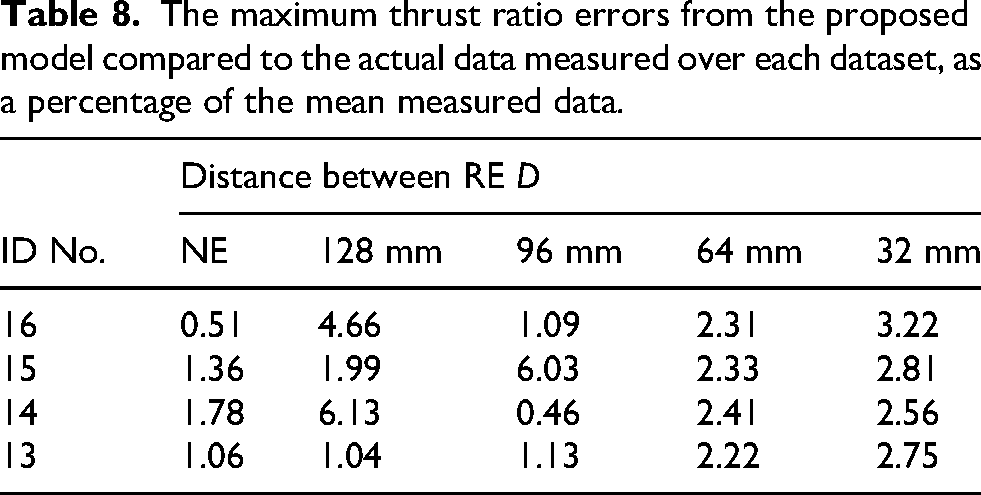
Predicted GE thrust ratios can be compared with the recorded data. The root-mean-squared error (RMSE) and maximum error can be calculated and used as a metric to evaluate the accuracy of the proposed model as a whole. The RMS and maximum errors for each propeller over each test surface are shown in Tables 7 and 8, respectively, and reported as a percentage of the mean measured data. The RMSE averaged over all figures is
The root-mean-squared error (RMSE) of thrust ratios calculated from the proposed model compared with the actual data measured over each dataset, as a percentage of the mean measured data.

The maximum thrust ratio errors from the proposed model compared to the actual data measured over each dataset, as a percentage of the mean measured data.
Nondimensional analysis and discussion
The theory of models can be applied to further validate the proposed GE model. Let the physical model be propeller 16 in quasi-steady IGE hover over the surface with blocks spaced 32-mm apart and let the physical systems to be predicted be the propellers 13, 14, and 15, also in quasi-steady IGE hover over the same block array. The nondimensional relationship governing both model and physical systems is captured in equation (8). Attempts to match the 
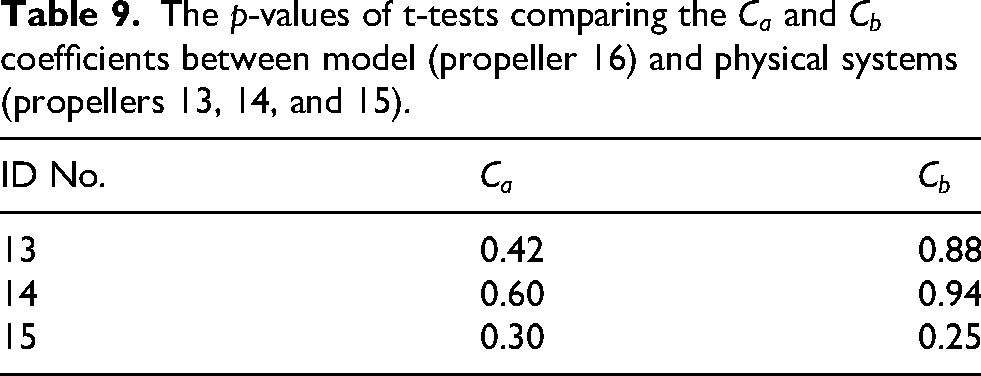
To meet similarity conditions, the same range of dimensionless heights, per the distorted model, were used while conducting analysis for each of the models and system propellers. T-tests between measured model coefficients
The
The GE thrust ratios over a meaningful range of dimensionless heights were calculated using the proposed model, equation (9), for the model and physical systems under observation (Figure 13). Initial consideration of the datasets suggest model and physical system closely mirror each other as expected from the application of the theory of models. More thorough analysis using T-tests, with an alpha value of 0.05, to compare the datasets at each dimensionless height between model and the physical systems indicates no significant differences. The only exception being the results encapsulated in the box shown in Figure 13 (a), which correlates to propeller 15. This may be ascribed to its

Application of the theory of models comparing propeller 16, as the model, against propellers 15, 14, and 13, as the physical systems, hovering IGE over the surface with adjacent blocks spaced 32-mm apart. (a) Comparison between propellers 16 and 15. Datasets within the orange box indicates the null hypothesis was rejected. (b) Comparison between propellers 16 and 14. (c) Comparison between propellers 16 and 13.
Since commercially available propellers with fixed dimensions were used, the similarity conditions were more difficult to meet; however, the nondimensional analysis conducted provides justifiable results that support the proposed model.
Connection to partial ground effect
As previously mentioned, the surfaces used in this study have a homogeneous layout. Consider the following, since previous studies have shown that partial ground effect (PGE) is, intuitively, the percentage of the total IGE that interacts with the rotor’s wake.24,27 The principles of PGE for the surfaces in this study may be applied such that at height 
Conclusions
This paper first investigated the effects of surface roughness on IGE. Next, a nondimensional IGE model that incorporates the aerodynamic roughness length and zero-plane displacement height was described. Experiments were performed to validate the proposed model’s accuracy, where the aerodynamic parameters for artificially-rough surfaces were gathered and the strength of the ground effect over each test surface was measured using multiple COTS propellers of varying sizes. Ground effect test results showed that aerodynamically rougher surfaces corresponded to higher IGE thrust. Statistical analysis of the results confirm the accuracy of the proposed model. The average RMSE found for all experiments was 0.90% and the averaged maximum error was 2.39%, both within the natural noise of the observed GE. Finally, nondimensional analysis confirmed that where similarity conditions are met, the proposed model follows theoretical projections. The work done here has greater implications for more accurate GE compensation over rough surfaces and improvements in UAV motion control, navigation, and design.
Footnotes
Acknowledgments
Authors thank Dr. Xiang He for his time in technical discussions related to the project.
Funding
The author(s) received no financial support for the research, authorship, and/or publication of this article.
Declaration of conflicting interests
The author(s) declared no potential conflicts of interest with respect to the research, authorship, and/or publication of this article.