
Abstract
The accumulation of ice on airfoil surface can degrade its aerodynamic profile and affect the behavior of flow over the airfoil surface. Variation in surface characteristics can amend the aerodynamic behavior of an airfoil by triggering transition from laminar to turbulent flow. Ice accretion on manned aircraft flying at high values of Reynolds numbers were researched pervasively in the literature, but it is not simple to apply these findings to Unmanned Aerial Vehicle (UAV)s operating at low Reynolds numbers. Variation in Reynolds number of even one order of magnitude can have a substantial effect on the mechanics of ice accretion. Existing numerical ice accretion codes are validated for ice accretion at high Reynolds numbers but not at low Reynolds numbers. Consequently, an effort is made to perform ice accretion studies on UAV airfoil RG-15 at low Reynolds number on the order of 105 using ANSYS-FENSAP ICE. The numerical results are compared with icing tunnel experiments-based ice shapes available in the literature, and the associated aerodynamic penalties are studied numerically. Existing numerical algorithms can fairly predict the ice accumulation at low Reynolds number especially for rime ice cases. But the accuracy of prediction is compromised with increase in complexity of the problem associated with mixed and glaze ice, particularly in prediction the ice structure like roughness elements. For the cases considered in this study ice accretion has reduced the range and endurance of the UAV by 60%. The most significant numerical simulation issues associated with the use of Computational Fluid Dynamics (CFD) for ice accretion are also discussed.
Introduction
“Unmanned Aerial Vehicle (UAV)” or “Drones” refers to an aircraft that do not have a on board pilot. The operation of the UAVs was limited to military and defense purposes in the past. Later UAVs have revealed their potential application in a variety of civil and commercial applications. 1 The military uses UAVs extensively for intelligence, targeting and battle damage assessment, surveillance and reconnaissance, data relay and communications assistance, Suppression (or Saturation) of Enemy Air Defenses, etc. Mapping, surveying, and photography are further civil applications. UAVs have also recently revealed their commercial applications, such as package delivery, air metros, and air taxis. 2 In 2021, a marketing consulting firm in Germany reported 237 UAV applications. 3 Due to its potential applications in a variety of industries, UAVs are attracting increasing global interest. All-weather operation is required for UAVs to perform effectively, reliably, and cost-effectively in all these applications.
In ice prone locations like Arctic, atmospheric/in-cloud icing might be regarded a dangerous threat for UAVs. It can degrade the aerodynamic performance and structural features of UAVs, leading to their destruction. On impact with a surface, supercooled water droplets freeze into ice, resulting in atmospheric icing. In-cloud icing on structures is typically characterized as rime, glaze, or mixed ice. Glaze ice is accreted at temperature values close to the freezing point (high values of liquid water content) where the heat transfer mechanism is insufficient in eliminating all the latent heat of fusion liberated during solidification of droplets impacting the surface. Thus, only some percentage of the impinging droplets would freeze-up while the remainder can return to the surface. It has a high density (900 kg/m3), very good surface adhesion, and a clear and smooth look. Rime ice is created at very low temperatures (LWC is minimal) when the heat transfer mechanism is sufficient to eliminate majority of the latent heat of fusion for droplets impacting the surface and it freezes instantly. It has a low density (200–700 kg/m3), is white, opaque, and has a rough look. Mixed ice is created in the intermediate negative temperatures, and it possesses the properties of both glaze and rime ice. Glaze ice can produce intricate ice formations such as horns, huge feathers, and “lobster-tail-like structures”. 4
The accumulation of ice on structures is contingent on a variety of climatic and geometric variables. The growth rate and nature of the accreted ice are determined by the interaction of the following variables: free stream velocity (
Ice accumulation can degrade an aircraft's aerodynamic performance, structural integrity, and stability. Numerous research studies on the performance of airplanes in icing environment can be found in the literature. 9 Similar studies on UAVs were conducted in the last couple of decades, as reviewed by Muhammed and Virk. 5 The accumulation of ice on an airfoil's surface can degrade the airfoil's aerodynamic form and affect surface properties such as roughness characteristics, airfoil camber, and effective airfoil chord. Alteration in these parameters can impact the aerodynamic performance of an airfoil by causing laminar to turbulent flow transition, separation of boundary layers, and alternation in the distribution of pressure and shear forces on the airfoil's surface. Ice accretion on fixed wing UAVs can results in severe aerodynamic penalties, including reduction in lift, increase in drag, and early loss of control (stalling). While the ice accretion on propellers can result in remarkable increase of torque along with decline in thrust and performance efficiency. Ice accumulation is a dynamic process that results in an unequal distribution of mass across the surface of the structure. This mass imbalance can compromise the structural integrity of aircraft by causing excessive vibrations, an increase in fatigue loads, and severe aeroelastic responses such as flutter. Ice accumulation on an aircraft can also affect its weight, which in turn alters the aircraft's center of gravity, degrading its performance and stability. 10 Therefore, effective ice mitigation strategies must be adopted to prevent performance losses caused by the ice accumulation.
Ice accretion on structures can be investigated using different methods: 1) analytical methods, 2) flight tests, 3) numerical simulation, and 4) icing tunnel tests. In 1986, Finstad
11
developed the first analytical statement for analyzing ice accumulation on structures. It is based on her research work about ice accumulation on circular cylinders, hence it cannot be immediately applied to UAV icing. Szilder et al.
12
developed in 2011 an analytical model for ice accumulation on airfoil. This model connects the
Icing studies using numerical simulation has four major modules: 1) solver for determining the air flow, 2) a droplet impingement solver to determine the water droplet trajectories 3) an ice growth solver based on thermodynamic model and 4) an automatic mesh displacing/regenerating algorithm. A thorough description of modelling of these processes is available in. 13 The solver requires atmospheric parameters such as operating velocity, operating temperature, LWC, MVD and time of the ice accretion as inputs. LEWICE icing code of NASA Glenn Research Center, IMPIN3D developed by CIRA Italy, ONERA 2D/3D of ONERA in France, and the 2nd generation 3D icing simulation system FENSAP-ICE developed by Newmerical Technologies International in Canada, are examples of typical ice accretion numerical codes. 14 LEWICE is a popular ice accretion tool of the first generation based on the 2D panel method. 15 While LEWICE has only been validated for high Reynolds numbers (Re > 2.3 × 10E6), it can still be used for lower Reynolds values. Due to the fact that the panel method approach catches numerous physical processes through analytical correlations, the results for ice growth must be compromised. ONERA 2D/3D based on Eulerian equations can only solve an inviscid flow. FENSAP-ICE can simulate 3D ice accretion for a wide range of applications. 16 The results of FENSAP-ICE are more accurate than other solvers because it employs higher order models for solving the physics of ice accretion. 17
Atmospheric icing on aircrafts, wind turbines and other structures are widely studied in the literature.
10
The major difference between studies on aircraft icing and that of UAV is the operating Reynolds number
Computational framework
Governing equations
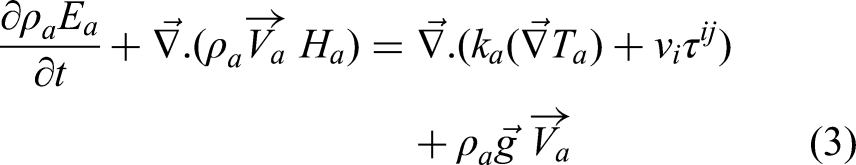
Numerical ice accretion simulations were performed using the ANSYS-FENSAP-ICE software. This numerical solver consists of different modules: the air flow computations are done with a Reynolds-Averaged Navier-Stokes (RANS) based solver called ‘FENSAP’; droplet impingement on airfoil surfaces is simulated with an Eulerian based DROP3D solver; and ice accretion is modelled by partial differential equations (PDEs) for thermodynamics using ICE3D solver. Further, FENSAP-ICE contains a re-meshing module that acclimate the grid to the geometry of ice. For the simulation of ice accretion, these solvers are executed in a series of steps. FENSAP uses the finite element-based discretization of the Navier-Stokes equation for air flow simulation. Air flow behaviour is modelled by the equations for conservation of mass, momentum and energy.
24


Where
The Eulerian solver DROP3D considers the particle phase as a continuum. It then constructs its conservation equations on a control volume basis and in a form that is comparable to that of the equations for the fluid phase. The Navier-Stokes equations are used as the basis for the generic Eulerian two-phase model for viscous flow, and these equations are supplemented with the droplet continuity and momentum equations.
24


Where
A system of two partial differential equation is solved by ICE3D on all solid walls. The mass and energy conservation equations are used to determine the thermodynamic process and ice accretion rate. The model includes heat fluxes due to convective and evaporative cooling, heat of fusion, viscous and kinetic heating as its parameters.


Where
The displaced grid after the completion of ice accretion was made in FENSAP-ICE, using the Arbitrary Lagrangian-Eulerian (ALE) method. In order to take consideration of the mesh velocity, this strategy involves adding the grid speed terms to the Navier-Stokes equations.
Geometry and computational methodology
The low Reynolds number RG-15 aerofoil used for the Kahu UAV with a chord length of 0.45 m and 0.21 m are used in this study.
25
Multi block structured 2D C-grid was generated using ICEM-CFD software. The numerical domain was extended to tenfold the chord length in all directions. The aerofoil surface is refined across the leading edge to capture the ice accretion with good resolution as shown in Figure 1. Grid dependency study was done for the clean airfoil to ensure the independence of results from grid resolution. Three different grids were generated by increasing the number of grid points on both the pressure and suction side of aerofoil surface. The coarse, medium, and fine grids have 187 (

Structured grid over rg-15 airfoil.

Ice shape predicted by the coarse, medium, and fine grid.

Aerodynamic coefficients predicted by coarse, medium, and fine grid.
Parameters for ice accretion simulations.

Results and discussion
Ice shape validation
Ice shapes obtained from the icing tunnel experiments are utilized to validate the ice shapes from the FENSAP-ICE simulations. The CM and IM ice shapes generated by Williams et al. in 2017 22 during his studies on RG-15 airfoil at the NRC Altitude Icing Wind Tunnel (AIWT), Canada, are represented as Mixed_NRC and Rime_NRC respectively in this manuscript. The experimental ice shapes of Hann et al. 23 on RG-15 airfoil from Cranfield university icing wind tunnel glaze and rime icing conditions are represented as Glaze_Cranfield and Rime_Cranfield in this manuscript. The numerical icing simulations were run using multi-shot approach and the number of shots used for each case is given in Table 1. Two experimental ice shapes are available from the studies done at Cranfield icing tunnel for both the cases. Experiment ice shape1 and experiment ice shape 2 are the shapes obtained by tracing the ice from the center and left side of the wing respectively.
Figure 4 shows the comparison of experimental and numerical ice accretion shapes on the studies done at icing conditions for the NRC icing tunnel tests. In this paper, ice thickness refers to the thickness of ice measured perpendicular to the stagnation region at leading edge and the icing limits refers to the downstream extend of ice on the airfoil surface. The numerical model was quite capable of predicting the ice thickness accurately for both the mixed and rime ice cases. The numerical ice shape of rime ice matches very closely with that of experiments except the fact that the upper and lower icing limits are slightly over predicted in numerical simulations. The numerical ice shape seems more symmetrical, but the experimental shape has little thickness more on the lower half. From the experimental ice accretion shape, it can be assumed that there can be a small negative value of angle of attack during the studies due to experimental uncertainties. Further studies may be needed to properly validate the ice shapes. The numerical solver was also successful in predicting accurate ice thickness for mixed ice conditions also. But the experimental ice shapes are smoother compared to the ragged numerical ice shape. On careful observation, it can be found that the experimental ice shape also showed small bumps perpendicular to the leading-edge shoulders, but these are very much prominent in numerical ice shapes. Further as observed in case of rime ice the icing extends are slightly over predicted by numerical solver on the suction side and is underpredicted on the pressure side. The ice shapes are obtained in the experimental studies by cutting a chunk of ice from the middle of the airfoil and the shape is traced on a paper. Therefore, there could be possibility to lose information about thin ice regions at the limits of icing extend on the suction and pressure sides. Thus, considering the uncertainty in experimental data, the comparison of experimental and numerical ice shapes is made based on the regions with prominent ice thickness.

Comparison of the ice shapes predicted by experimental and numerical icing studies on rg-15 airfoil with C = 0.21 m.
Figure 5 shows the comparison of experimental and numerical ice accretion shapes on the studies done at icing conditions for the Cranfield icing tunnel tests. The numerical prediction of the ice thickness was matching for both the rime and glaze ice cases. In contrast with the observations made on NRC rime ice case, the icing extends are underpredicted by the numerical solver for the Cranfield rime ice. On comparing with the NRC rime ice, the Cranfield rime is rough with feathers along the leading-edge shoulders. Numerical prediction of ice thickness perpendicular to shoulders are also matching reasonably with the experiments. For glaze ice, the nature of prominent roughness elements is different in experiments and numerical icing simulations. The experimental ice shape predicts prominent ice horns downstream of the lower shoulder, which are absent in numerical predictions. But two sharp horns were predicted along the leading edge by FENSAP-ICE and are absent in experimental studies. Further the ice thickness perpendicular to the leading-edge shoulder is underpredicted by numerical solver.

Comparison of the ice shapes predicted by experimental and numerical icing studies on rg-15 airfoil with C = 0.45 m.
These studies showed that the environmental conditions and geometric parameters have a significant influence on the nature of ice accretion. The nature of the ice formed is dependent on the complex interplay of various parameters like
Aerodynamic performance
FENSAP simulations were run on the clean and the iced RG-15 airfoil to study the aerodynamic performance of the iced airfoils. For the iced airfoils, aerodynamic simulations were done only for the experimental ice shape. As observed in the previous section, the experimental and numerical ice shapes are very different, especially for the glaze ice. The experimental ice shape must be considered as more realistic than the numerical ones. Therefore, the aerodynamic simulations of experimental ice shapes are performed in this study to understand the performance losses due to ice accretion. The ice shape obtained from the central part is used for the aerodynamic performance studies of Cranfield ice. The numerical prediction of the coefficient of lift (

Comparison of numerical
The coefficient of lift (

Aerodynamic performance of clean and iced rg-15 airfoil (C = 0.21) at mixed ice conditions.

Aerodynamic performance of clean and iced rg-15 airfoil (C = 0.21) at rime ice conditions.
For rime_NRC ice, it can be observed that ice causes a decrease in lift and increase in drag for all angle of attacks considered. Further ice accretion causes premature stalling at 8o for both the mixed and rime ice cases considered. The stalling angle for clean airfoil was 10o. The lift decrease and the drag increase percentage is calculated at the stall point for all the cases considered in this study. The lift decreases by 3% for the experimental mixed ice compared to clean airfoil lift. The corresponding increase of drag due to ice accretion is 54%. For rime ice the decrease in lift was 11% for the experimental ice shape and the corresponding drag increase is 120%.
The

Aerodynamic performance of clean and iced rg-15 airfoil (C = 0.45) at glaze ice conditions.
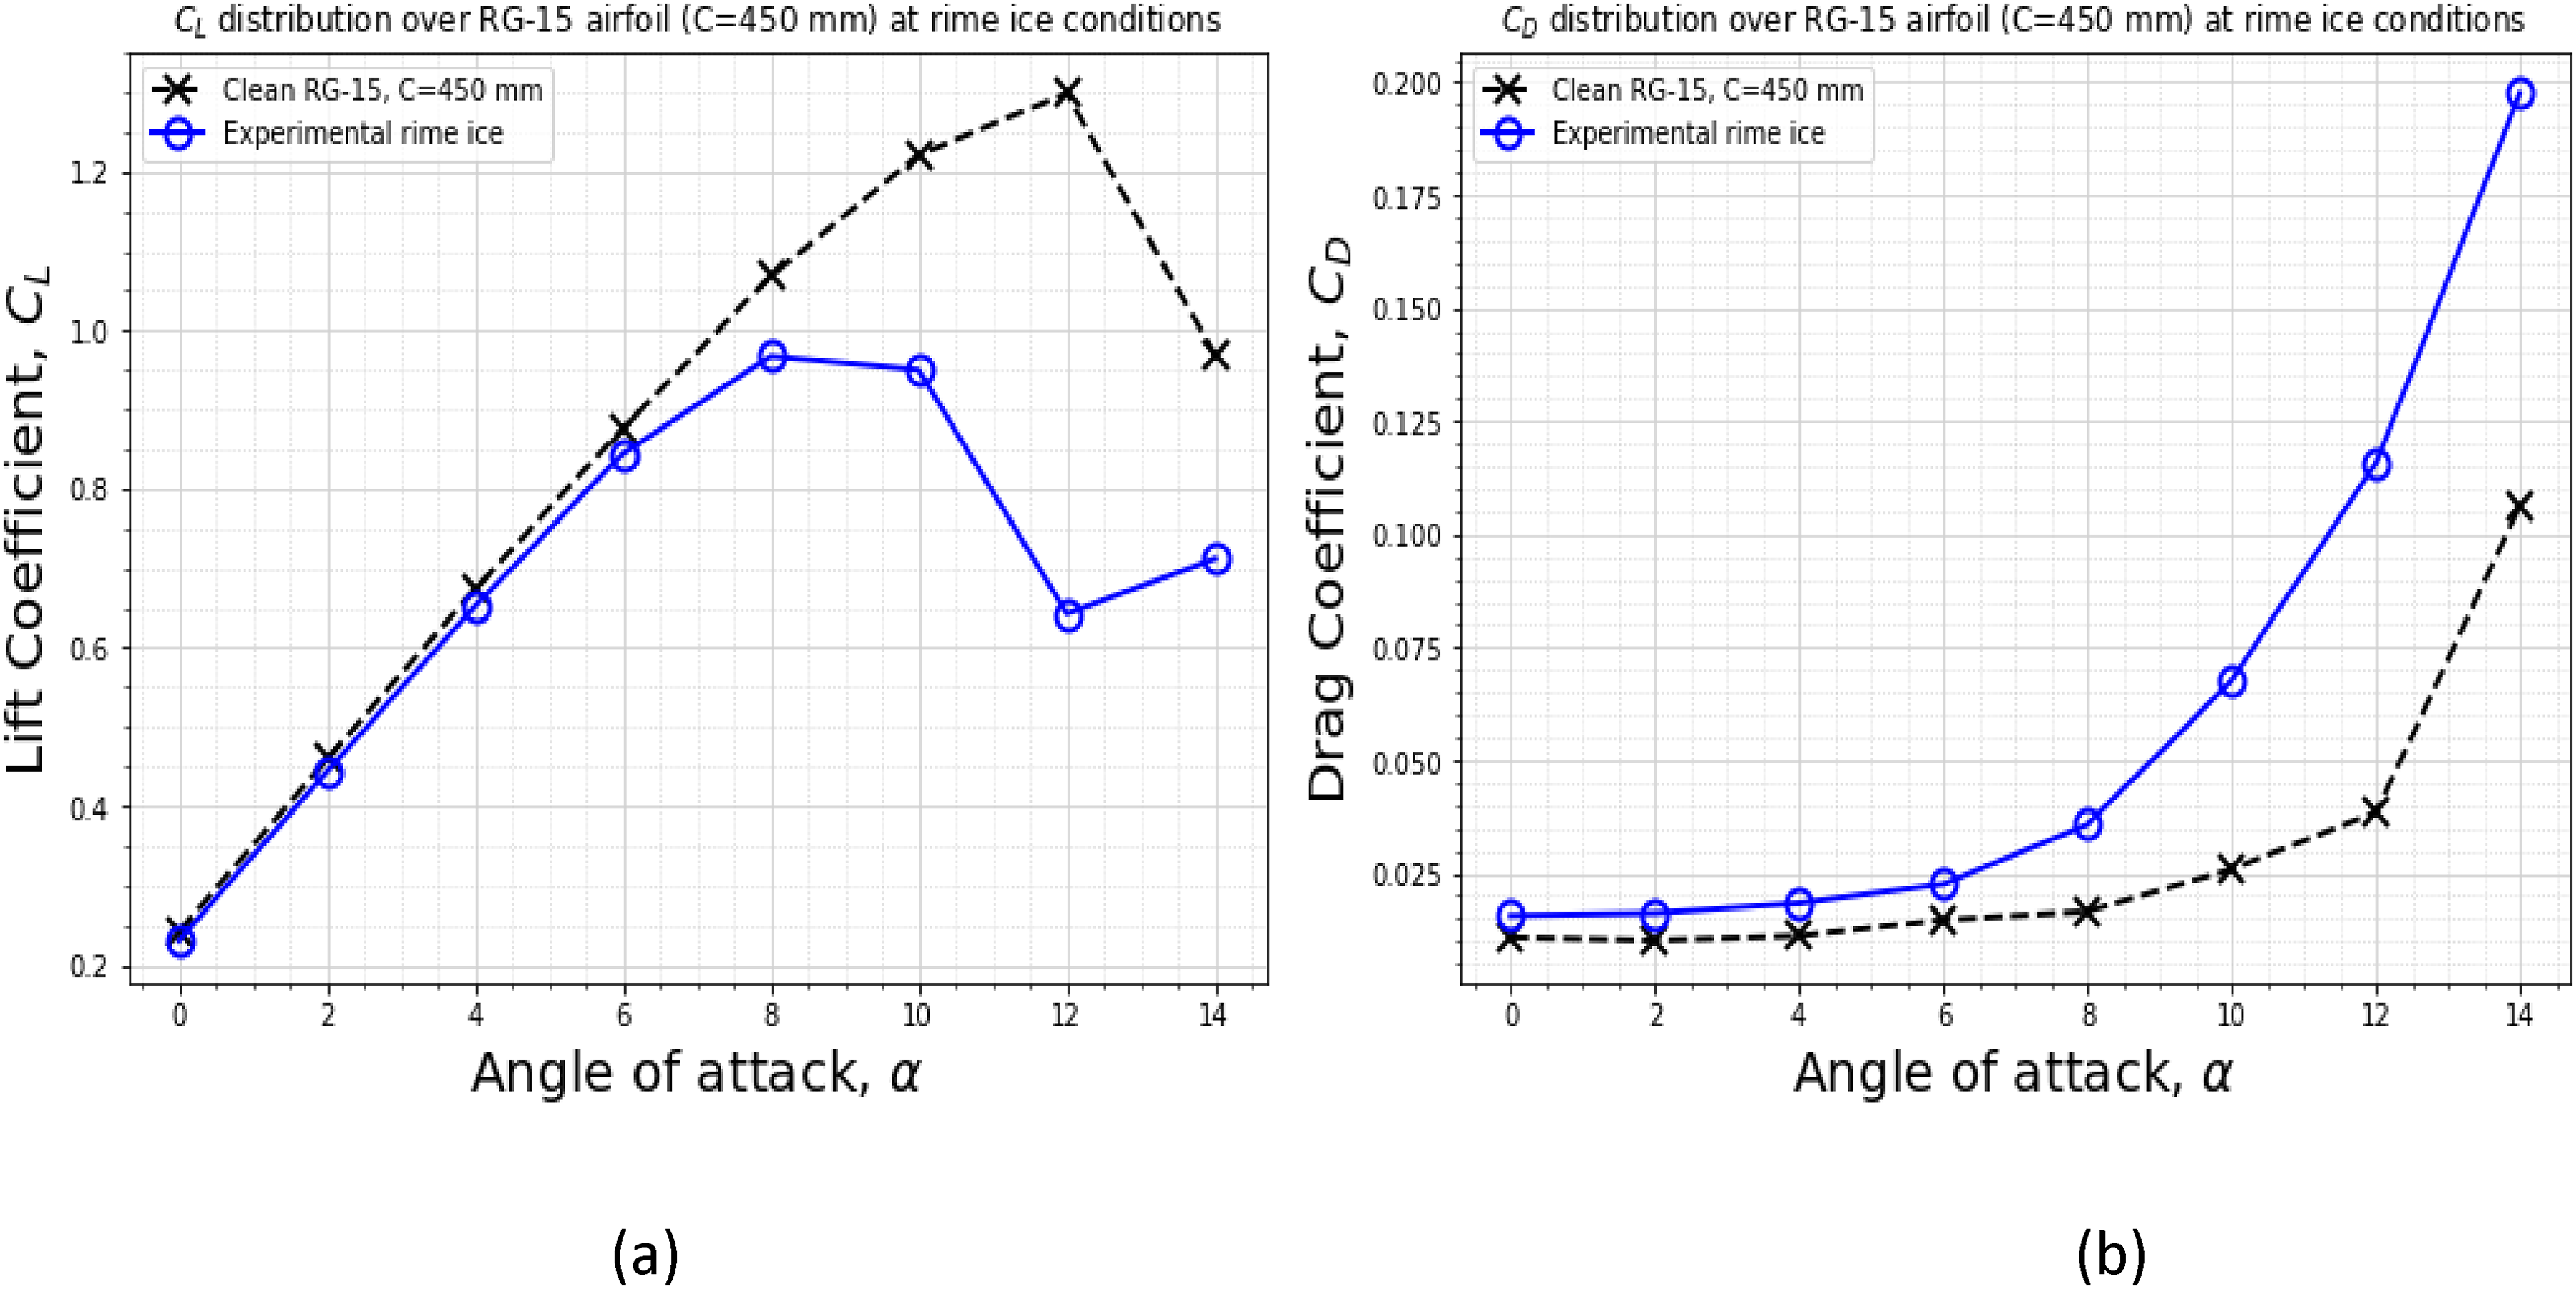
Aerodynamic performance of clean and iced rg-15 airfoil (C = 0.45) at rime ice conditions.

Formation of separation bubble on rg-15 airfoil (C = 0.45) at glaze ice conditions with ice shape predicted by icing tunnel experiments.
Overall Ice accretion has degraded the aerodynamic performance of Rg-15 airfoil considerably by decreasing the lift, increasing the drag and premature stalling. The extend of performance degradation depend on the shape of ice accreted and amount of the roughness elements. Severe performance degradation is observed for more ragged ice features of the Cranfield ice shapes compared to smooth NRC ice shapes. Therefore, it is important to predict the ice shapes accurately otherwise the aerodynamic performance during iced conditions cannot be understood accurately using numerical studies.
According to Brequet's equation, the maximum range and maximum endurance of a propeller driven aircraft is proportional to


Computational challenges of UAV ice accretion studies
The validation investigations demonstrate that existing numerical icing codes are capable of predicting ice morphologies under various meteorological situations. Overall, the programs can accurately predict rime ice accretions, but glaze ice cannot be accurately predicted due to the intricate heat transfer mechanics involved. Compared to numerical ice shapes, the experimental ice exhibited a smooth appearance. The discrepancy between the predicted and observed ice shape can be attributed to the limits of the computational model and the experimental uncertainties. Primarily, experimental limits consist of the limitations of existing procedures and the potential for errors. Ice accretion is a transient process in which the shape of the ice accreted changes over time; hence, the shape of the ice retrieved through manual tracing corresponds to the ice shape at a specific time instant. To acquire the ice shape at various time instants, therefore, sophisticated ice shape acquiring techniques must be created. To achieve more realistic experimental settings, it is essential to calibrate LWC and MVD with correct droplet distribution. It was observed the shape of the ice obtained in icing tunnel tests varies when we repeat the same test another time and also it varies among test facilities even though the operating conditions are kept same.
19
For the validation of current numerical models and the creation of new models, accurate experimental results are required. Insufficient experimental data on ice accretion process at low values of Reynolds numbers remains as a deficiency in this field. The major challenges of numerical ice accretion studies are listed below:
Most ice accretion solvers are developed for high Reynolds number (> 106) applications and are not validated for the low Reynolds number applications. Experimental ice accretion data at low Reynolds number for a wide range of operating conditions and airfoils are required to perform the validation studies. The experimental data should include information regarding ice shape, surface roughness, information related to water transport during ice accretion, droplet collection efficiency, heat transfer informations and associated aerodynamic force variations.
The prominence of laminar flow and the possibility of laminar to turbulent flow transition makes the flow behavior complex and are difficult to predict with existing CFD models.
34
Laminar flow is more dominant in low Reynolds number flow regime, conventional RANS turbulence models are not capable of predicting laminar flow features like Laminar Separation Bubbles (LSB).
35
The shear stress, heat flux distribution and droplet collision efficiencies can be influenced by the formation of LSBs, which can remarkably affect the ice accretion phenomenon. The LSB can be modelled with the help of transition turbulence models, but the prediction of LSB is sensitive to the turbulence model used.
36
Thus, efficient models are required to accurately model the low Reynolds number flow field.
Similar to LSB, separation bubbles are formed due to the ice geometry and are called ISB. The formation of the ISB can also modify the flow field around the airfoil geometry resulting change of shear stress, heat flux and droplet collision efficiency. Ice accretion is a transient process that the ice shapes keep on changing with time. The change in the geometry can induce changes in the flow field. Thus, the numerical airflow solvers must be capable to predict the ISB and associated flow field changes accurately which is currently limited as observed from the literature.
36
Water droplet impact, coalescence, splashing, and runback are complex phenomena that are challenging to model accurately. Existing models often assume simplified droplet impingement, ignoring detailed surface interactions. The physics governing these interactions are highly complex and require detailed modeling to achieve accurate predictions.
In rime ice conditions, all droplets that impacts the surface freeze quickly, eliminating the necessity for heat transfer calculations. The quantity of droplets impacting the surface is explicitly determined or specified through the collection efficiency, contingent upon whether a Lagrangian or Eulerian model is employed for droplet motion. The predominant method for modelling glaze ice involves solving one-dimensional heat transfer problems derived from Stefan's problem, initially formulated for aviation purposes by Messinger
37
in 1953 and further refined by Myers
38
in 2001. In addition to heat transfer, the development of the water film on the blade surface will be included in future models.
39
Consequently, modelling glaze ice accretion necessitates consideration of all associated physical phenomena, such as wall film development, its progression along the surface, and heat transport, which presents significant challenges.
Surface roughness also affects the flow transition and heat transfer process, which in turn affects the ice accretion.
40
Also, in most solvers surface-roughness height is estimated by empirical correlation in terms of freezing fraction. The phenomena of ice accretion is a special case of a rough surface, characterized by a very unpredictable, irregular, and challenging-to-measure roughness pattern. Ice accretion simulation algorithms must incorporate ice roughness. Numerous correlations specific to icing connect roughness parameters with diverse atmospheric conditions and localized ice characteristics on surfaces. The most intricate relationships endeavor to forecast the variability of roughness across spatial and temporal dimensions. Research indicates that these roughness correlations may inadequately predict accurate ice configurations in numerous instances.
41
Also, The empirical ice roughness models are based on the experiments done at Re of
As aforementioned, ice accretion is a transient process and therefore the mesh must evolve in according to the changes in ice shape. Most ice accretion solvers currently adopt a multi shot approach (quasi transient approach), which demands updating the computational mesh at the end of each shot. Icing exhibits various geometric features which are challenging to mesh, including conic shapes, jagged ridges, narrow deep valleys, and concave regions. The spanwise variation of these features in three dimensions introduces additional complexities.
44
Robust, automated mesh generation for ice accretion modelling, remains a challenging problem. Mesh free algorithms for ice accretion modelling are currently under development.
45
Conclusion
Numerical Ice accretion studies and aerodynamic simulation of clean and iced profiles of RG-15 airfoil at different meteorological conditions had performed. The capability of FENSAP-ICE solver in predicting the ice accretion at different icing conditions are validated. FENSAP-ICE was quite successful in predicting the ice shapes for the rime ice conditions. The prediction of glaze ice needs to be improved. Icing causes drastic aerodynamic penalties for all the cases considered in this study. For the cases considered in this study, ice accretion can reduce the range and endurance of UAV by 60%. The computational challenges associated with numerical modelling of ice accretion is also discussed. For the validation of current numerical models and the creation of new models, accurate and detailed experimental results are required. Advanced models for improving the flow field prediction at low Reynolds number, improved surface roughness models, accurate ice accretion models and better mesh deformation algorithms are required. Further experimental aerodynamic performance studies of iced airfoils need to be performed and use it for the validation of numerical solver capabilities.
Footnotes
Acknowledgement
The work presented in the current paper is supported by the UiT- The Arctic University of Norway (Project no- 7400-72104) & nICE project of UiT & Research Council of Norway (Project no- 324156).
Author contributions
Conceptualization, M.M. and M.V.; methodology, M.M.; investigation, M.M.; data curation, M.M.; writing—original draft preparation, M.M.; writing—review and editing, M.M.; supervision, M.V. All authors have read and agreed to the published version of the manuscript.
Funding
The authors disclosed receipt of the following financial support for the research, authorship, and/or publication of this article: This work was supported by the UiT- The Arctic University of Norway, Norges Forskningsråd, (grant number 7400-72104, 324156).
Declaration of conflicting interests
The authors declared no potential conflicts of interest with respect to the research, authorship, and/or publication of this article.
Data availability statement
The data presented in this study are available on request from the corresponding author.