
Abstract
The low Reynolds number aerodynamics is important to investigate for micro air vehicle applications. The current paper covers numerical simulations to present the downstream development of the wake patterns and detailed analysis of the vortices generated at the downstream of NACA 0012 airfoil around the critical angle of attack where the instantaneous vortex patterns are oscillatory and differ from the mean vortex pattern for low Reynolds numbers ranging from 1000 to 4000. The instantaneous and mean aerodynamic forces, pressure and skin friction coefficients, and vorticity values are compared in addition to the path of the vortex centers, their longitudinal and lateral spacings, Kármán spacing ratios, and distortion ratios at the wake of the airfoil in regard to the different Reynolds numbers investigated. The streamwise and crosswise velocities of the vortex cores and relative velocities at different transverse locations are also discussed and presented in detail. The correlations between different non-dimensional numbers (St, Re, Ro) are obtained at these low Reynolds numbers investigated.
Introduction
The vortex formation and eddies behind bluff bodies have been impressively observed and drawn by Leonardo da Vinci (1452–1519). 1 The vortical patterns behind cylinders in a freestream are observed as alternating vortices rotating in opposite directions which are known as “von Kármán vortex street.”2,3 Von Kármán was the first who discovered that the symmetric arrangement of vortices created an unsctable arrangement, however, the asymmetric ones could create stable arrangements for a certain ratio of longitudinal and lateral spacings of the vortices at the wake.2,4
The wakes behind the airfoils are also widely investigated by the researchers at high Reynolds numbers. However, the low Reynolds number regime has been taken interest in the last few decades due to its applications to micro air vehicles. As a result, fewer works on the wake patterns of the airfoils at the low Reynolds numbers on the order of 103 exist in the literature.
Freymuth et al. 5 presented Reynolds number dependence of vortical patterns experimentally using smoke visualization technique in accelerating flow behind airfoils at angles of attack of 20° and 60°. At Re = 1000, Freymuth et al. 5 observed that there is a vortex formation at the trailing edge at α = 20° for NACA 0015 airfoil and the vortex formation moves further closer to the leading edge as Reynolds number increases. For Re = 1000 and larger, in addition to the primary leading-edge vortex, a secondary vortex is formed. By investigating the Reynolds number range of 44 to 52,400, they showed experimentally that increasing Re has considerably increased the flow complexity and the onset of turbulence occurs early and generates large-scale turbulent vortex patterns.
Huang et al. 6 used experimental methods to visualize the vortex evolution of the NACA 0012 wing in a towing water tank. They identified five vortex evolution regimes in terms of angle of attack and Reynolds number, namely attached flow, trailing-edge vortex, separation vortex, leading-edge vortex, and bluff-body effect.
Kurtulus7,8 previously investigated the flow past NACA 0012 and NACA 0002 airfoils at Re = 1000 for steady uniform flow at different incidence angles. She has classified the wake structures into five different modes (Kurtulus modes9,10) according to their patterns obtained from instantaneous and mean vorticity fields by also taking into account the amplitude spectrum of the lift coefficient, the instantaneous and mean aerodynamic force coefficients, velocity fields, and the longitudinal and lateral vortex spacings. The steady airfoil results are also compared with a small amplitude pitching NACA 0012 airfoil and the effect of pitching frequencies are investigated on the wake patterns and aerodynamics coefficients.11,12 Rossi et al. 9 and Durante et al. 10 show that the classification of the wake structures is similarly visualized for Reynolds numbers ranging from 100 to 3000.
Kunz and Kroo 13 analyzed the aerodynamic force coefficients of different NACA profiles at low angles of attack and ultra-low Reynolds numbers below 104 where they have also shown the effect of the thickness, camber, and the shape of leading and trailing edges. The aim of their study was to analyze a centimeter-scaled controlled powered flight for a rotorcraft. 14 Their analysis also rise the design of a miniaturized autonomous rotorcraft whose larger versions are intended to fly on Mars. In the last few years, the application of the low Reynolds number flows has once again drawn the attention of researchers due to the unmanned air vehicle missions on Mars. The Mars Helicopter flies on the NASA Mars 2020 rover mission. Bhandari and Anderson 15 denoted that the Martian atmosphere is ∼95% carbon dioxide. The ambient pressure is ∼1040 Pa. Both the atmospheric density and temperature are very low, resulting in very low Reynolds numbers. For rotor applications, 16 Reynolds number is Re ∼104. Knudsen number being Kn ∼10−7 reveals that the continuum flow is valid for the Martian atmospheric conditions.
In the literature, there was not a comprehensive detailed analysis of the transition from the steady continuous sheet mode of the vortex street behind the airfoil at low Reynolds numbers to an alternating form where the oscillations in aerodynamic lift and drag coefficients start. The current study is important from this point of view where the flow field and aerodynamic force coefficients are represented in detail in comparison of the effect of Reynolds number in the range of 1000 to 4000 by considering this transition phase.
In the present study, the instantaneous and mean wake patterns behind the NACA 0012 airfoil are numerically simulated at the critical angle of attack where the instantaneous vortex patterns are oscillatory and differ from the mean vortex pattern at Re = 1000, 2000, and 4000. The unsteady wake of the NACA 0012 airfoil at α = 8° was selected since it is a critical angle between the continuous sheet mode, which is completely steady, and the alternating vortex shedding mode where the discrete vortex patterns are observed at the downstream of the NACA 0012 airfoil at Re = 1000. The aerodynamic coefficients, shedding frequencies, the longitudinal, lateral spacings, Kármán spacing ratio, and distortion ratio are investigated in addition to the vortex core streamwise and crosswise velocities. The regression analysis is also performed to relate Roshko number, Reynolds number, and Strouhal number.
Methodology
The simulations are performed with an ANSYS Fluent v.14
17
commercial solver. The governing equations are Navier–Stokes equations for incompressible, laminar, and two-dimensional flow:


Grid domain (NACA 0012, α = 8°)
The methodology used in the current study was described in detail in Kurtulus,7,8 therefore the main points are explained below. Grid and time refinement studies have been carried out for steady NACA 0012 airfoil in a previous study (Kurtulus 7 ) for Re = 1000. The mean aerodynamic force coefficients were also compared in the previous studies with different data available in the literature. 18 Three hundred nodes are selected to be used around the NACA 0012 airfoil, which corresponds to the medium mesh configuration (Figure 1), after performing a grid refinement study, which included 150 nodes for the coarse grid and 500 nodes for the fine grid. 7 The first cell spacing of the boundary layer for the medium mesh was 0.0015c, where c = 0.1 m is the chord length. The total number of elements is of the order 200,000 for the medium mesh. The mesh around the airfoil is composed of two parts, namely the inner region and the outer region. The inner region above the boundary layer is constructed with a semi-circle having a radius of 1.5c centered at the airfoil c/4 location at the upstream and a rectangular region with a width of 1.5c at the downstream of the airfoil. The inner region mesh is an unstructured triangular grid. The outer domain is of a C-type structured mesh. With a preprocessor program developed, the airfoil is rotated for the given α in the inner region by keeping the outer domain and wake region fixed with the same structured grid. The time refinement study 7 carried out with time increments of Δt = 0.0005 s, Δt = 0.005 s, and Δt = 0.001 s reveals that Δt = 0.005 s in comparison with Δt = 0.0005 s give almost same results therefore the current study is performed with time increment of Δt = 0.005 s. The results were simulated until t = 100 s and the mean contours and values were obtained by averaging in the interval of 50 s ≤ t ≤ 100 s.
The comparison of the mean aerodynamic force coefficients with the data available in the literature 20 is given in Figure 2. The mean lift coefficient for NACA 0012 at Re = 1000 gives very similar results with data available in the literature.20,21 The error bars in Figure 2 show the amplitude of oscillations of the instantaneous lift coefficients, which occur for the angles of attack above the critical angle. The results at Re = 4000 are also compared with the experimental data of Sunada et al. 22 and Cleaver et al. 23 Sunada et al. 22 examined experimentally in a water tank the aerodynamic forces of 15 different airfoil shapes one of them being NACA 0012 airfoil at Re = 4000 using a load cell. It should also be noted that the results of Re = 4000 are also compared with a k − ω SST turbulence model with low Reynolds number correction using a low turbulence intensity of 0.1% for angles of attack of 0° to 8° and the aerodynamic force coefficients are found to be same with the laminar simulations for the Reynolds number range and angle of attack range investigated. Sunada et al. 22 also observed that the roughness of the airfoils tested during the experiments does not affect the aerodynamic performance of the airfoils and this could be explained by the fact that this Reynolds number is far below the transition Reynolds number as is emphasized by Schmitz. 24

Mean lift coefficients in comparison with the literature data for Re = 1000 and Re = 4000.
Results
The generation and behavior of vortex patterns and their geometric arrangements are important for the understating of the unsteady aerodynamics of the airfoils. It has been already observed that the geometric arrangements are highly dependent on α and Re in addition to the airfoil thickness.7,9 The current study focuses on a specific angle of attack of α = 8° for NACA 0012 airfoil, which is found to be a critical angle for the passage from steady to unsteady vortex patterns downstream of the airfoil for Re = 1000. The simulations are also performed for Re = 2000 and Re = 4000 cases and a detailed comparison is performed.
Vortex formation
A vortex is defined as fluid elements rotating around a common center, which forms a fluid structure at macroscopic scales. 25 In the wake of an airfoil, at different angles of attack or Reynolds numbers, the vortices move in time toward the downstream so the vortex cores change position instantaneously and form a wake pattern, which is in majority regular in shape except for some cases with chaotic patterns.7,8 As a result, it is better to look at the vortex patterns both instantaneously and also in terms of the mean values. It is seen that the individual vortex shapes are also deformed and rotate toward the downstream due to the flow field and shear generated in the presence of the other vortices.
The instantaneous streamlines at Re = 1000 are shown in Figure 3(a) for α = 8° and in Figure 3(b) for α = 9°. The vortex pair formation at the trailing edge of the airfoil is clearly visible from these time instances. The formation of the clockwise (CW) rotating vortex wrapping from the lower surface to the upper surface near the trailing edge (t = 2 s in Figure 3) and a counter-clockwise (CCW) vortex at the upper surface due to the separated shear layer is visualized (t > 2 s in Figure 3). Above t = 10 s, the downstream shed of the alternating vortex is observed for α = 9° at the downstream of the airfoil, however, it is clearly seen that the vortices generated at α = 8° are not shed at the downstream of the airfoil and are stationary. The comparison of these two cases reveals a transition from the attached mode to the alternating shedding mode of the airfoils at these low Reynolds numbers.
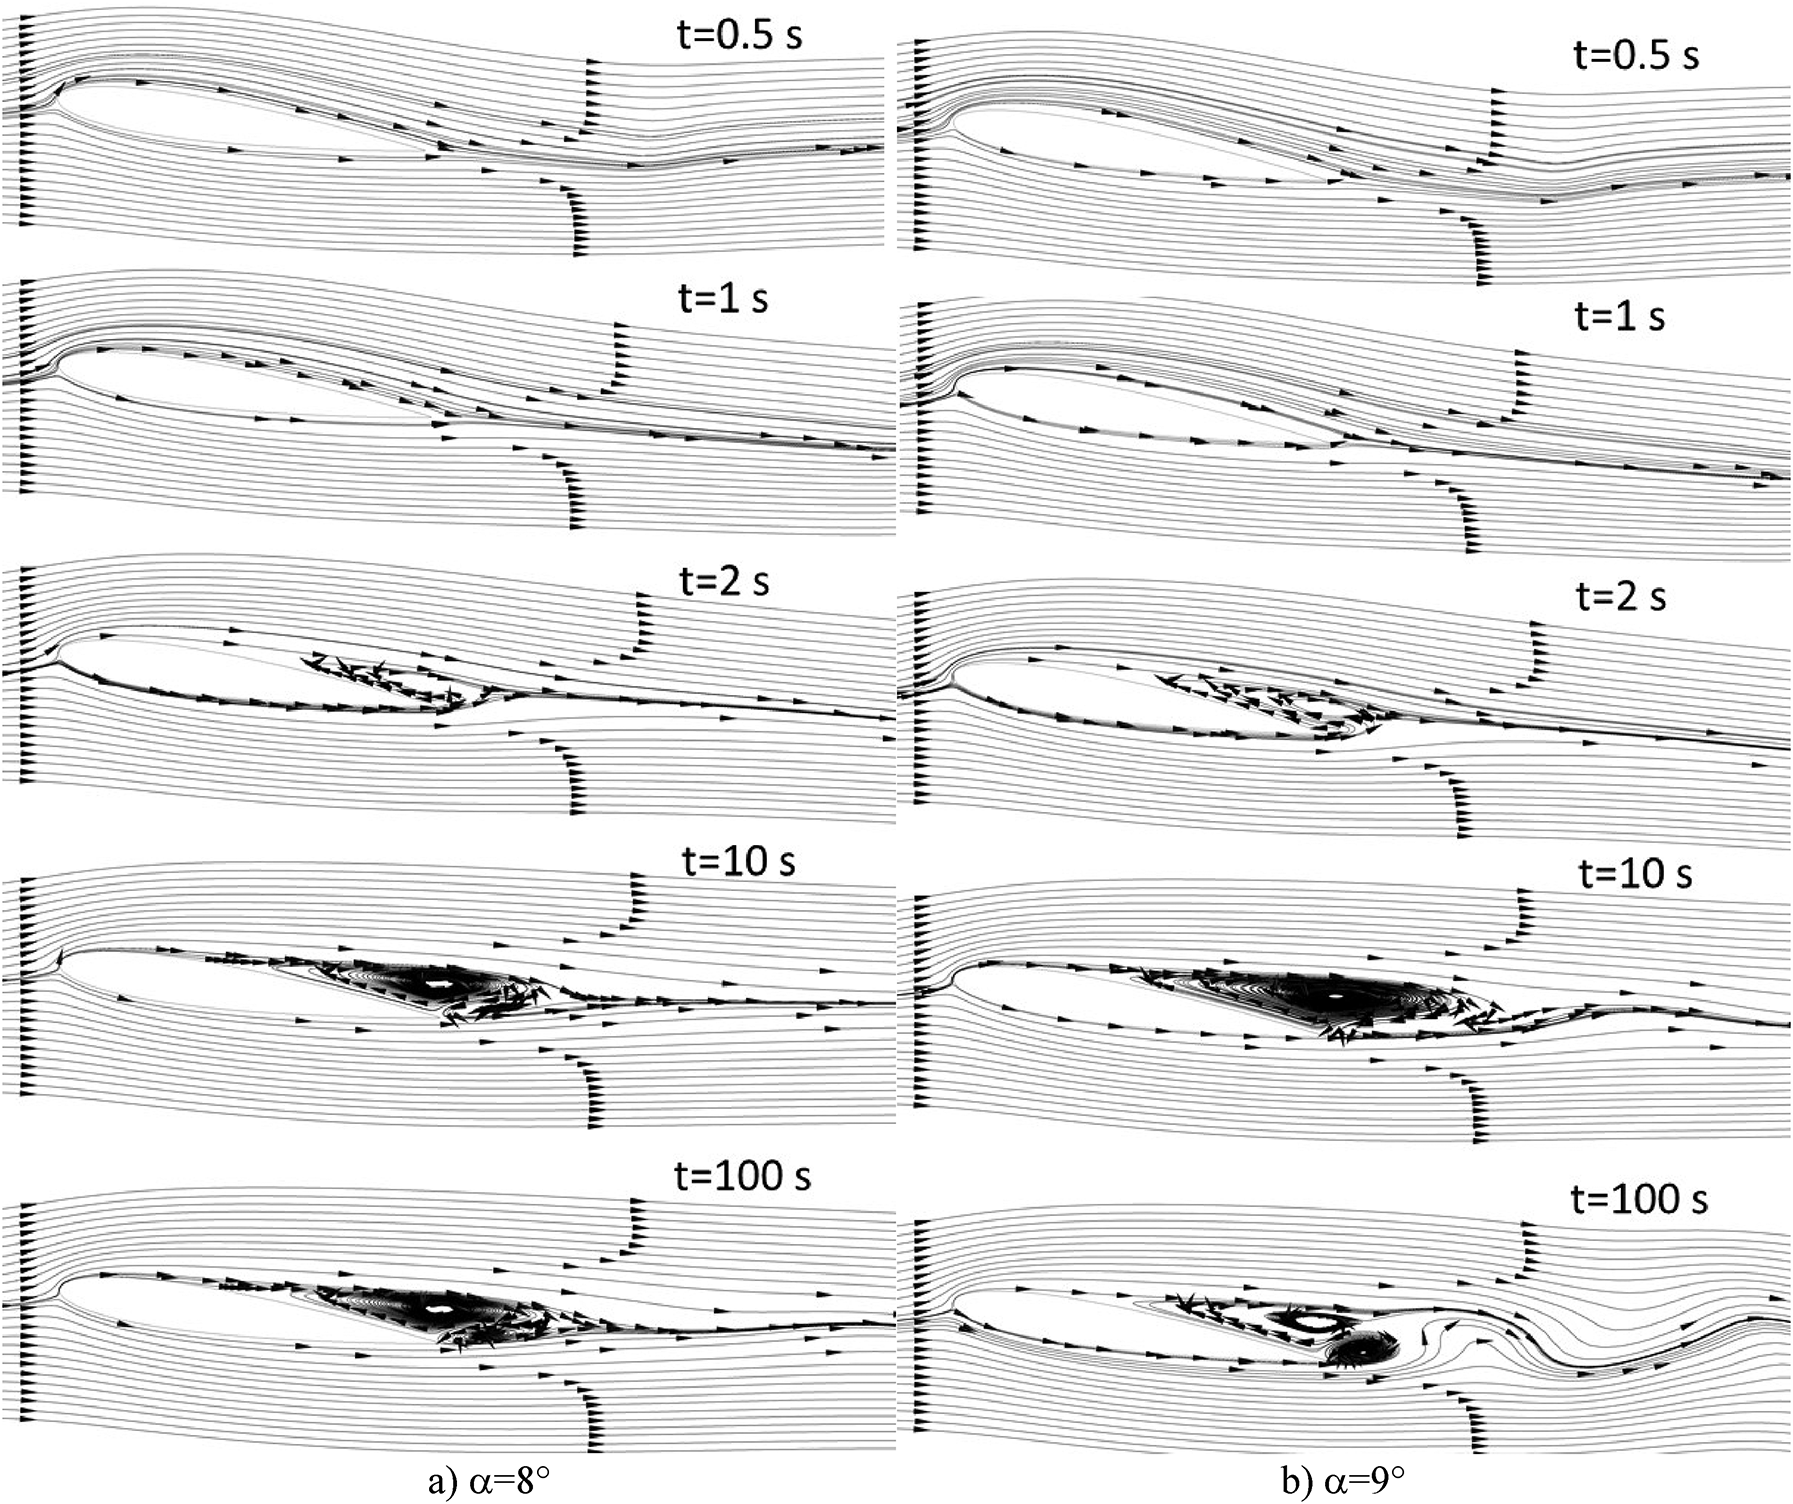
Instantaneous streamlines of NACA 0012 airfoil at α = 8° and α = 9° for Re = 1000.
Figure 4 shows the comparison of the instantaneous and the mean streamlines close to the NACA 0012 at angles of attack of 7°, 8°, and 9°.

Instantaneous and mean streamlines of NACA 0012 airfoil at α = 7°, α = 8° and α = 9° for Re = 1000.
In a previous study of Kurtulus, 8 the vortex shedding patterns are classified into five different vortex shedding modes according to the vortex pattern, amplitude spectrum of Cl, and the longitudinal and lateral spacing of the vortices behind NACA 0002 and NACA 0012 airfoils at Re = 1000 considering different angles of attack. Mode 1 which is denoted as “continuous vortex sheet mode” is obtained at α ≤ 8° for NACA 0002 and α ≤ 7° for NACA 0012. Mode 2 nominated as “alternating vortex shedding mode” is observed at 9° ≤ α ≤ 11°, 14° ≤ α ≤ 20° for NACA 0002 and 8° ≤ α ≤ 22° NACA 0012. Mode 3 is “alternating vortex pair shedding mode” (12° ≤ α ≤ 13°, 21° ≤ α ≤ 26°, 34° ≤ α ≤ 41° for NACA 0002 and 23° ≤ α ≤ 26°, 27° ≤ α ≤ 28°, 31° ≤ α ≤ 41° for NACA 0012). Mode 4 denoted as “alternating single vortex with vortex pair shedding mode” is observed for very few cases at 27° ≤ α ≤ 33° for NACA 0002 and 29° ≤ α ≤ 30°for NACA 0012). At higher angles of attack “bluff body vortex shedding mode” is observed for both airfoils (50° ≤ α ≤ 90°). The critical angles from the steady convergence condition (Mode 1) to unsteady oscillatory behaviors (Mode 2) are obtained at α = 8° for NACA 0012 and 8°<α<9° for NACA 0002 at Re = 1000. The steadiness was obtained at 8° and the unsteadiness is obtained at α = 9° for NACA 0002 airfoil therefore the critical angle will be between 8°<α<9°, which is also in agreement with Kunz and Kroo. 13 The critical angle is found to decrease as the Reynolds number increases so the unsteadiness is reached at lower angles of attack as the Re number increases to Re = 4000. The results are also investigated for Re = 2000 and Re = 4000 and the critical angles are found to be 6° for Re = 2000 case and 4° for Re = 4000 case.
The laminar boundary layer separation occurs on the upper surface of the airfoil and a separation bubble is observed for all the cases investigated in the current study. At α = 7°, the trailing-edge vortices are observed to be stationary resulting also constant instantaneous aerodynamic forces and no oscillatory patterns at the downstream wake (Figure 4). However, as α increases 1° more to 8°, the two trailing-edge vortices sizes reach a limit and result in instability at the wake of the airfoil. As is noted by Tritton, 26 a vortex street can arise without eddies being shed and the reason is the instability of shear flows. This angle is denoted as the critical angle, which is also clearly detected from a single peak at the amplitude spectrum of the lift coefficient (see Figure 5). The asymmetry at the wake after the growth of the two vortices on the upper surface of the airfoil leads to an oscillatory behavior at the wake downstream as can be seen from the streamlines and the wake patterns at α = 8° (Figures 3(a) and 4).

Amplitude spectrum of Cl for α = 8° at different Reynolds numbers.
At the critical angle, the instantaneous vortex pattern is not anymore the same as the mean vortex pattern. When the wake reaches a level of instability, the original vortex is broken up into fragments at the downstream to form alternating vortices. This phenomenon is observed to be at α = 8° for NACA0012 airfoil at Re = 10007. The vortices close to the trailing edge have a stable and persistent character for α ≤ 8°. At α = 9°, the vortices are observed to shed alternatingly from the trailing edge (Figures 3(b) and 4). It is also deduced that the critical angle is smaller than 8° for higher Re numbers. This phenomenon is clear from the completely unsteady wake of the Re = 2000 and Re = 4000 cases at α = 8° (Figure 6).

Instantaneous and mean streamlines of NACA 0012 airfoil at α = 8° for (a) Re = 2000 and (b) Re = 4000.
The instantaneous vortices generated move also in a distinguished average path in time. Therefore, both the unsteady and mean flow fields are presented in Figures 4 and 6 to give a better understanding of the flow. The mean flow fields are time-averaged in the interval of 50 s ≤ t ≤ 100 s in order not to take into account the periodic flow field and to exclude the impulsive start effects of the simulations.
Huang et al. 6 defined five surface flow regimes. One of them was attached flow where the surface flow is attached to the suction surface and no separation or vortical structures are found on the wing. This flow for NACA 0012 airfoil is observed at a very low α of 2° for Re = 1200. They observed a trailing-edge vortex formation at some higher angles of attack. A similar trailing-edge vortex formation is also visualized in the current study.
Development and shedding of a primary trailing-edge vortex in the counterclockwise (CCW) direction are observed for all cases. After the convection of the trailing-edge vortex toward the downstream, the CW vortex on the upper side of the airfoil is also shed downstream. As a result, a pair of vortices is observed to shed on alternating sides of the airfoil. As the mean streamlines are investigated, a secondary vortex nested inside a primary vortex is also observed at Re = 4000 on the upper surface of the airfoil (Figure 6(b)).
At these low angles of attack, the flow separates at the front half of the airfoils’ upper surface and reattaches at the close to the trailing edge and a CW vortex is formed and convected downstream. The flow from the upper surface of the separation bubble rolls up into a CCW vortex at the backside of the CW vortex, which is shed from the trailing edge. An experimental visualization has been made by Gad-el-Hak and Ho 27 for a pitching NACA0012 wing where they distinguished similarly the roll-up of the shear layer to form the trailing-edge vortex.
The instantaneous lift and drag coefficients are shown in Figure 7 for the three Reynolds numbers investigated. The lift coefficient at Re = 1000 has a very low amplitude of oscillation compared to Re = 2000 and Re =4000 cases. The lift coefficient amplitude of oscillation increases abruptly from Re = 1000 to Re = 4000 from an amplitude of 0.002 to 0.266.

Comparison of instantaneous and mean Cl and Cd of NACA 0012 airfoil at α = 8° for Re = 1000, 2000, and 4000.
Figure 7(c) shows the mean, maximum, and minimum Cl and Cd values obtained in the range of 50 s ≤ t ≤ 100s. The mean lift coefficient is found to increase 9.5% as the Reynolds number increases from 1000 to 2000 (Figure 7(c)) and Clmean increases 4.6% as the Reynolds number increases from 2000 to 4000. Therefore, a total of 14.5% increase of lift coefficient is observed when the Reynolds number changes from 1000 to 4000. The lift coefficient change in time is mainly because of the pressure changes at the trailing edge due to the vortices created at this point and the separation of the vortex at the upper surface of the airfoil (Figure 8(a)). The flow is dominated by viscous effects and is laminar in the Reynolds number interval investigated and the flow separation is an important factor even at low angles of attack. As the Reynolds number decreases, the leading edge suction peak decreases (Figure 8(a)). The adverse gradients at the suction side of the airfoil are lower, which results in a delay of the separation at higher angles of attack when the Reynolds number is lower. 13

Instantaneous (at t = 100 s) and mean CP and Cf coefficients of NACA 0012 airfoil at α = 8° for different Reynolds numbers.
The mean drag coefficient decreases sharply 15.9% as Reynolds number increases from 1000 to 2000 (Figure 7(c)) and Cdmean decreases 8.8% as Reynolds number increases from 2000 to 4000. As a result, a total of 23.4% decrease of the drag coefficient value is obtained with an increase of Reynolds number from 1000 to 4000. The mean Cl/Cd ratio is obtained as 2.31, 3, and 3.4 for Re = 1000, 2000, and 4000, respectively. A total of 47.5% increase in the mean Cl/Cd ratio is observed as Re is increased from 1000 to 4000.
It is known that the separation occurs when the shear stress vanishes. The separation point where the skin friction factor Cf vanishes is at x/c = 0.408 for Re = 1000 and the separation point moves toward the leading edge to x/c = 0.292 as the Reynolds number increases to 2000 (Figure 8). The mean and instantaneous pressure and skin friction coefficients are found to be very close to each other for the Re = 1000 case. However, a slight difference is observed at the trailing edge region of the airfoil for Re = 2000 condition when the pressure coefficient contours are visualized. This difference grows as the Re number increases to 4000.
Due to the changes of flow characteristics close to the airfoil at different Reynolds numbers, the wake topology at the downstream also vastly varies. Vorticity contours unlike the streamlines are observer invariant so it does not depend on the change of the inertial frame. 25 To detect all the instantaneous vortex structures form in the flow field, it is preferable to visualize vorticity distribution. For 2D unsteady flow investigated, the local maxima of the vorticity contours are detected to position the vortex cores behind NACA 0012 airfoil. It is also known that two parallel shear layers, which are close enough to each other may interact and form a staggered row of vortices. These shear layers generated downstream of a flat plate parallel to the flow has been shown previously by Roberts and Christiansen. 28
The instantaneous and the mean vorticity distribution of NACA 0012 airfoil at α = 8° for three different Reynolds numbers are shown in Figure 9. CW and CCW vortex rows are visualized at the wake of the airfoil. It is observed that the individual vortex shapes are modified toward the downstream of the airfoil. For Re = 1000, there are mainly two rows of vortices, one CW at the top and one CCW at the bottom. Approximately at x = 4c downstream of the airfoil, the vorticity field split to form discrete vortices, which detach from the continuous wake formation. The droplet-shaped vortices are modified to triangular shape vortices (vortices whose tails are sharp and whose heads are similar to the base of a triangle) which are then modified to more elliptical shapes at the far downstream of the airfoil for Re = 1000 case (Figure 9(a)). For this condition, a clear double row vortex street is observed in a staggered manner where each vortex alternatively has opposite signs. This angle is a critical angle between Mode 1 (“continuous vortex sheet mode”) and Mode 2 (“alternating vortex shedding mode”) for Re = 1000. The wake breakdown shifts close the trailing edge of the airfoil from the downstream toward the upstream at α = 8° for Re = 2000 and 4000 (Figure 9).
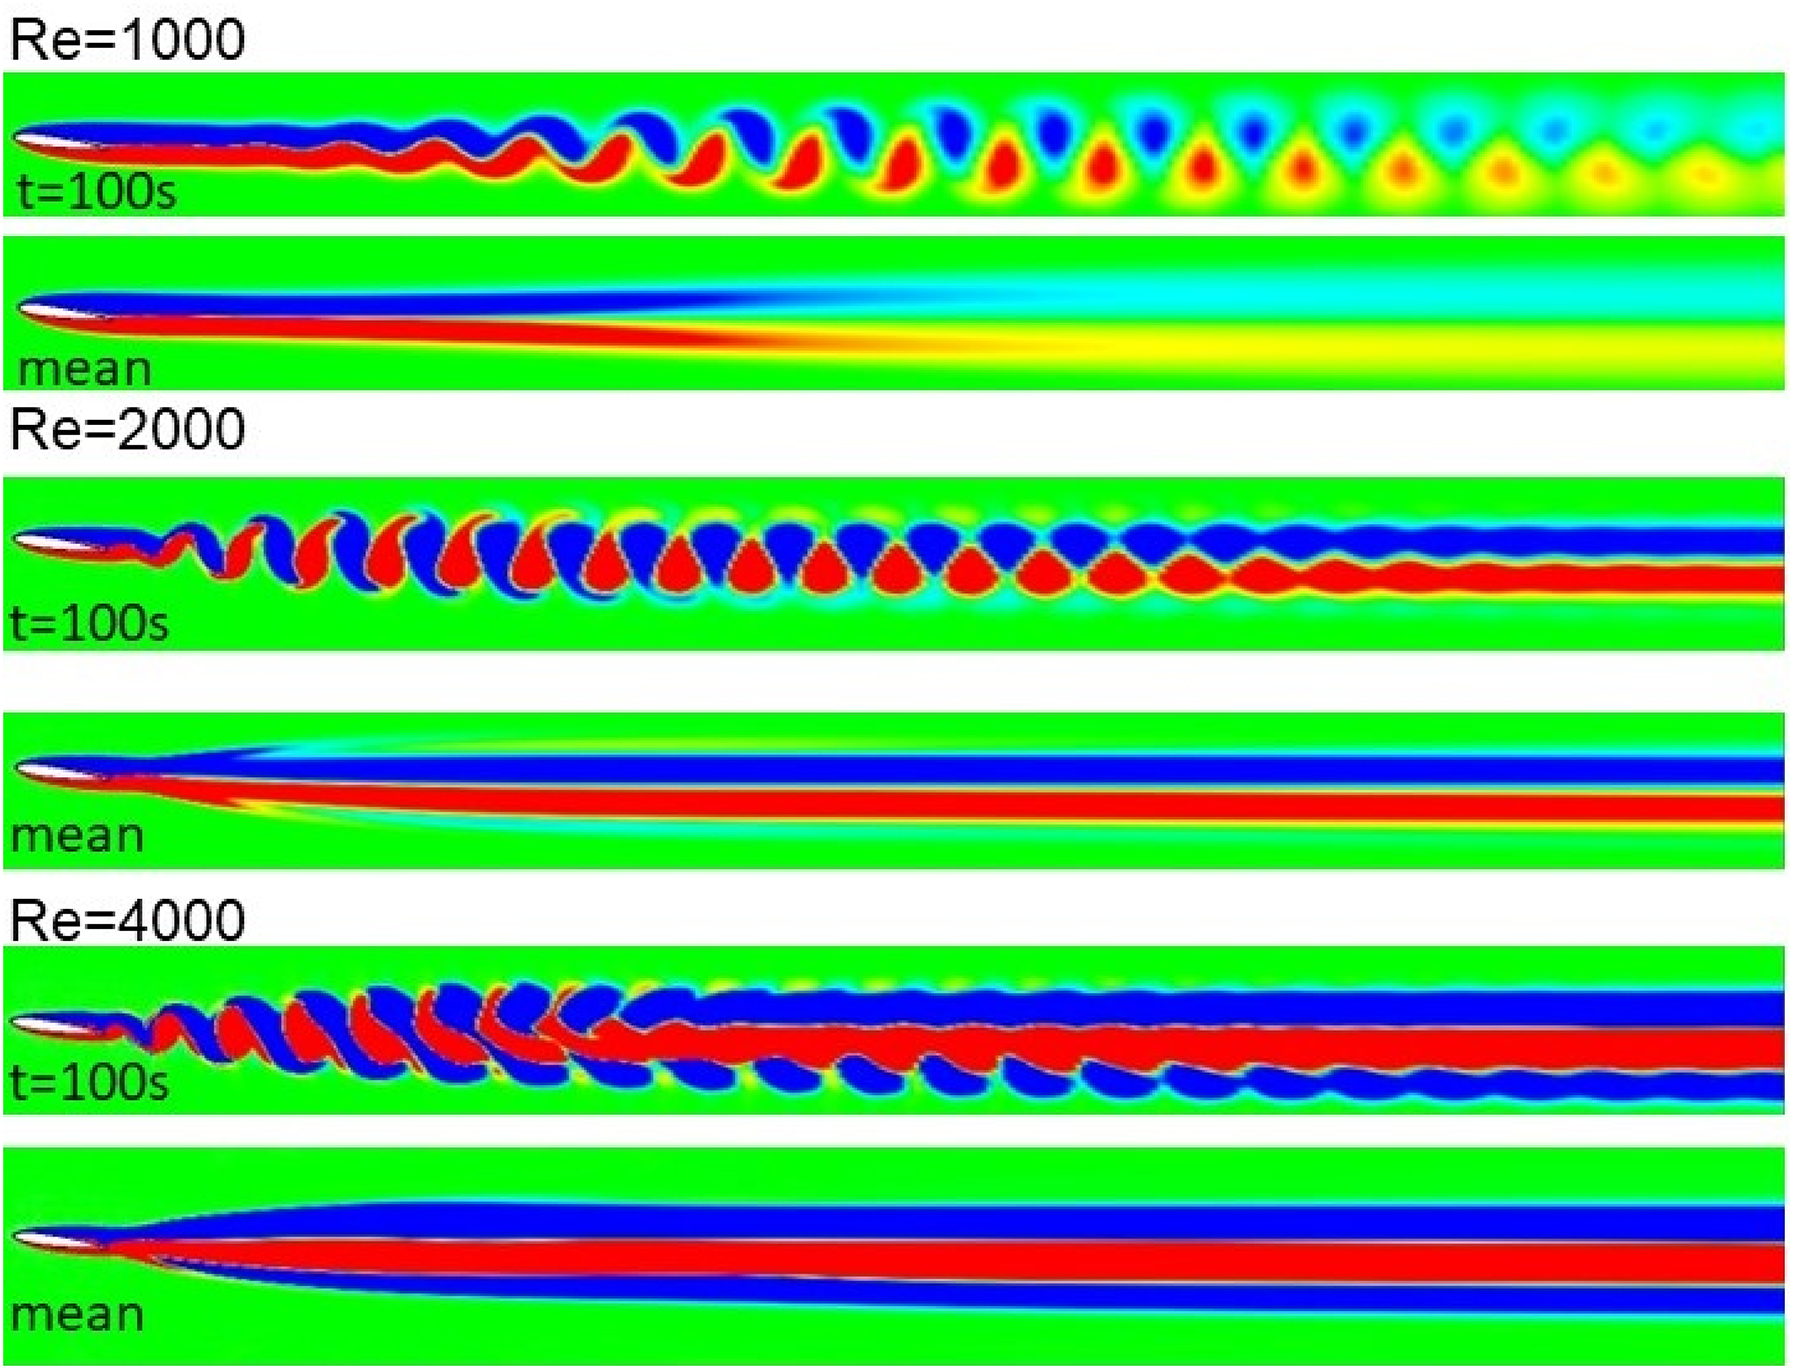
Instantaneous and mean vorticities behind NACA 0012 airfoil at α = 8°.
As Reynolds number increases to 2000, multiple vortex layers are observed. The main vortex pair forms “arms” at the top or at the bottom of the wake, which results in additional rows of the vortices and which deforms the topology of each individual vortex mostly downstream region close to the airfoil. The vortex pattern has also an alternating vortex shedding (Mode 2) form.
As Reynolds number increases to 4000, the third row of vortex structure is observed. At the far downstream of the instantaneous flow field, the same signed vortices at the same row merge to form a straight vortex street similar to the mean vorticity field. Mode 4 is observed at Re = 4000. In Mode 4, a second strong CW vortex row is generated in addition to the primary vortex couples formed from the trace of the first row CW vortex.
The width of the wake is also observed to vary from its initial width close to the airfoil toward the downstream and is seen to stabilize and reach a constant value at the far downstream for Re = 1000 and Re = 2000. For Re = 4000, the upper row CW vortices are observed to stabilize at 9c downstream of the airfoil, however, the lower row is found to grow even at the far downstream (Figure 9).
From the mean vorticity contours, it is observed that there is a formation region of the vortex street where the wake width reaches a minimum then starts to grow up. This phenomenon is also observed in the wake of the circular cylinders. 29 This formation region is clearer when the mean vorticity distribution (Figure 9) is investigated at Re = 2000. For Re = 4000, where there is a multiple vortex row formation, the width of the vortex street increases more toward the downstream. As the Reynolds number increases, the constant width region is pushing upwards from almost 13 chords downstream for Re = 1000 to 10c downstream at Re = 2000.
For Re = 1000, 16 vortex couples are detected in the domain investigated by considering the maximum of the vorticity magnitudes in the flow field at the downstream of NACA 0012 at α = 8° (Figure 9). Twenty-two vortex couples are visualized for Re = 2000. For Re = 4000, the two dominant CWs at the upper row (main) and lower row (secondary) are investigated separately with respect to the centerline CCW (red) vortex row.
Both instantaneous and mean vorticity values are found to decrease in the downstream direction. The gradual dissipation of the vortices is observed due to the viscous action. The instantaneous (circular symbols in Figure 10) and mean (square symbols in Figure 10) non-dimensional vorticity values (ω) at the vortex cores are shown in Figure 10. The vorticity is non-dimensionalized by dividing the vorticity magnitudes by (U0/c).

Non-dimensional vorticity magnitudes at the vortex cores behind NACA 0012 airfoil at α = 8° for different Reynolds numbers (□ mean values, ○ instantaneous values).
For Re = 1000, the vorticity values at the core centers decrease almost 10 times for the instantaneous case and 13 times for the mean condition downstream (Figure 10(a)). Sequential decrease of the vorticity values (ωi/ωi+1), where i denotes the number of individual vortex cores at the row, is shown in Figure 11(a). At the far downstream, the vorticity ratio decrease is obtained as 1.12 for the instantaneous field and 1.02 for the mean field at Re = 1000 (Figure 11(a)).

Vorticity ratios of the successive vortex cores behind NACA 0012 airfoil at α = 8° for different Reynolds numbers (□ mean values, ○ instantaneous values).
The decrease in the vorticity values is 1.05 times that of the following vortex for the instantaneous case and 1.03 times for the mean field at Re = 2000 at the most downstream of the flow domain (Figure 11(b)). The vorticity ratios converge to 1 for Re = 4000 (Figure 11(c) and (d)).
By investigating the amplitude of the vorticity values at the vortex cores, it is found that the vorticity values of CW and CCW vortices are almost the same at Re = 1000 (Figure 10(a)). However, the discrepancy between vorticity values increases with the increase of the Reynolds number (Figure 10(b)–(d)). The deficiency of the vorticity values can be due to the formation of the secondary vortex structures at the top and bottom of the main vortex core rows and also by the increase of the wake width and diffusion of the vortices.
For Re = 4000, the vorticity magnitudes of the first row CW (blue) vortex cores are found to be bigger than that of the second row CW (blue) vortex cores (Figure 1(c) and (d)). Until x/c = 7.4, the summation of the vorticity magnitudes of these two vortex core rows is found to be almost equal to the vorticity magnitude at the core of the CCW vortices. Downstream of this location (x/c > 7.4), the vorticity magnitude of the second CW vortex row (at the bottom) decreases sharply and dissipates quicker than the other two upper rows.
For Re = 1000, the vortices in the top row turn CW (blue) and in the bottom row CCW (red). This arrangement of vortices induces an upstream velocity component, which is characteristic for a drag indicating wake and also a result of the Biot–Savart law. 30 The change in the spacing of the vortices shed into the wake when they interact during their downstream convection modifies the wake structure at the downstream. Momentum and energy are carried out by the vortices in the wake. As much as the translational velocities of the vortex cores are constant in a streamwise direction, the longitudinal spacing will be constant.
The streamwise and the crosswise velocities of vortex cores are presented in the first column and second column of Figure 12, respectively. The cores of the vortices are found to move downstream with a velocity lower than the freestream velocity (U0) for Re = 1000 and Re = 2000 (Figure 12).
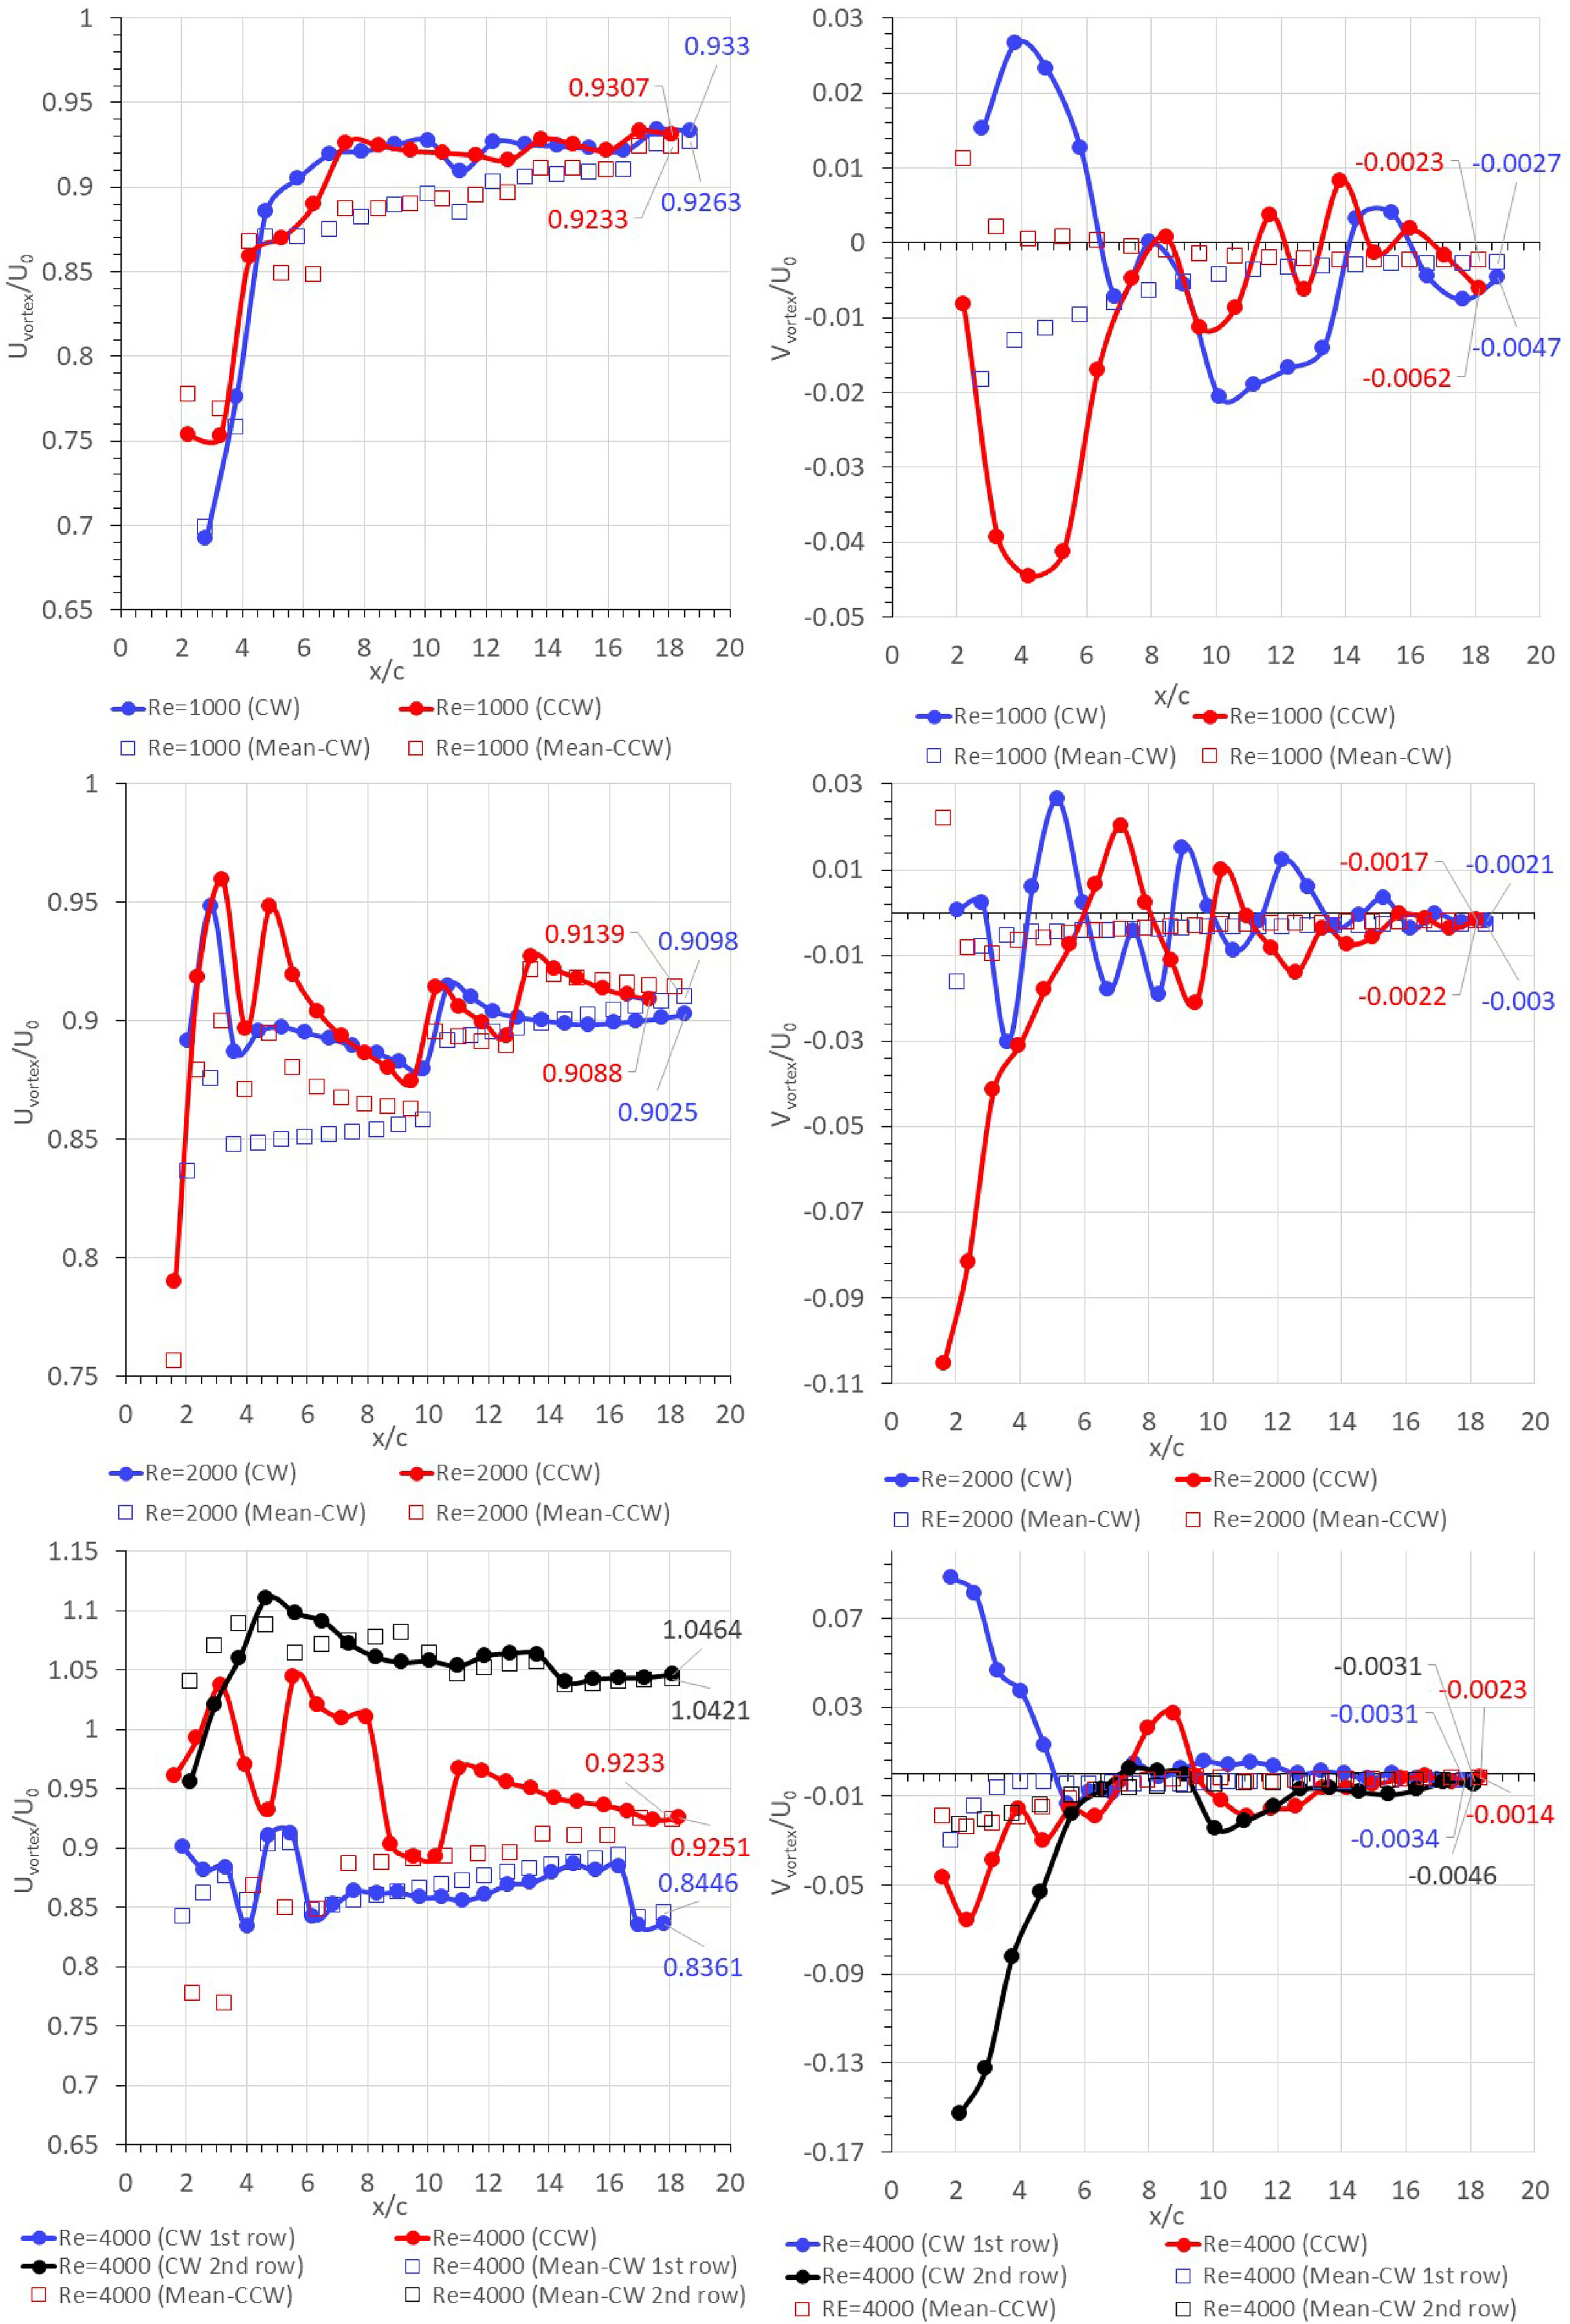
Streamwise (first column) and crosswise (second column) velocities of vortex cores behind NACA 0012 airfoil at α = 8° at different Reynolds numbers.
The main CW vortices at the first row of the domain have streamwise core velocities lower than freestream velocity throughout the domain for Re = 4000. However, the streamwise vortex core velocities of the second row CW vortices exceed the freestream velocity for Re = 4000 after 2c downstream of the airfoil. The CCW vortices’ instantaneous streamwise velocities also exceed the freestream velocity at around 3c downstream and also in the interval of 5.6c–8c. However, the mean velocities at the core vortex regions always remain below the freestream velocity all through the domain for Re = 4000 (Figure 12).
The instantaneous streamwise convective velocity (Uvortex) at the vortex cores reaches a value of 93.3% of the freestream velocity at x/c = 18.7 for CW vortex and 93.07% at x/c = 18.107 for CCW vortex at the far downstream for Re = 1000 (Figure 12).
For Re = 2000, the CW vortex velocity reaches 90.25% of the freestream at x/c = 18.5 and 90.73% at x/c = 18.206. For Re = 4000, the counterclockwise vortex at the middle row reaches Uvortex velocity of 92.5% of the freestream at x/c = 18.305. The main CW vortex at the first row reaches a vortex core velocity of 83.6% at x/c = 17.81 (Figure 12).
Figure 13 shows (U − U0)/U0 relative convective velocities at different transverse directions for Re = 4000. The same graphs for other Re values are provided in Figure 14. The transverse x/c locations are shown with vertical dashed lines in Figures 13 and 14 that pass through the vortex centerlines. The maximum velocities are not observed at the vortex core region but very near the outer edge of the vortex as is also revealed experimentally behind a circular cylinder by Schaefer and Eskinazi. 29 The total velocity vectors at the vortex cores are also presented as an arrow line on the same figure to clearly identify the vortex core locations in the flow domain. Due to the CCW1 vortex, which grows faster for Re = 4000 case, CW1 (blue) vortex at the first row deviates upwards until 5c downstream (Figure 13). The CW vortices at this top row have a positive crosswise velocity, which moves them diagonally upwards (Figures 12 and 13). This upward deflection is continuous until x/c = 5.

Instantaneous relative velocities (U − U0//U0) at various transverse locations passing through the vortex cores (arrows show the absolute velocity vector
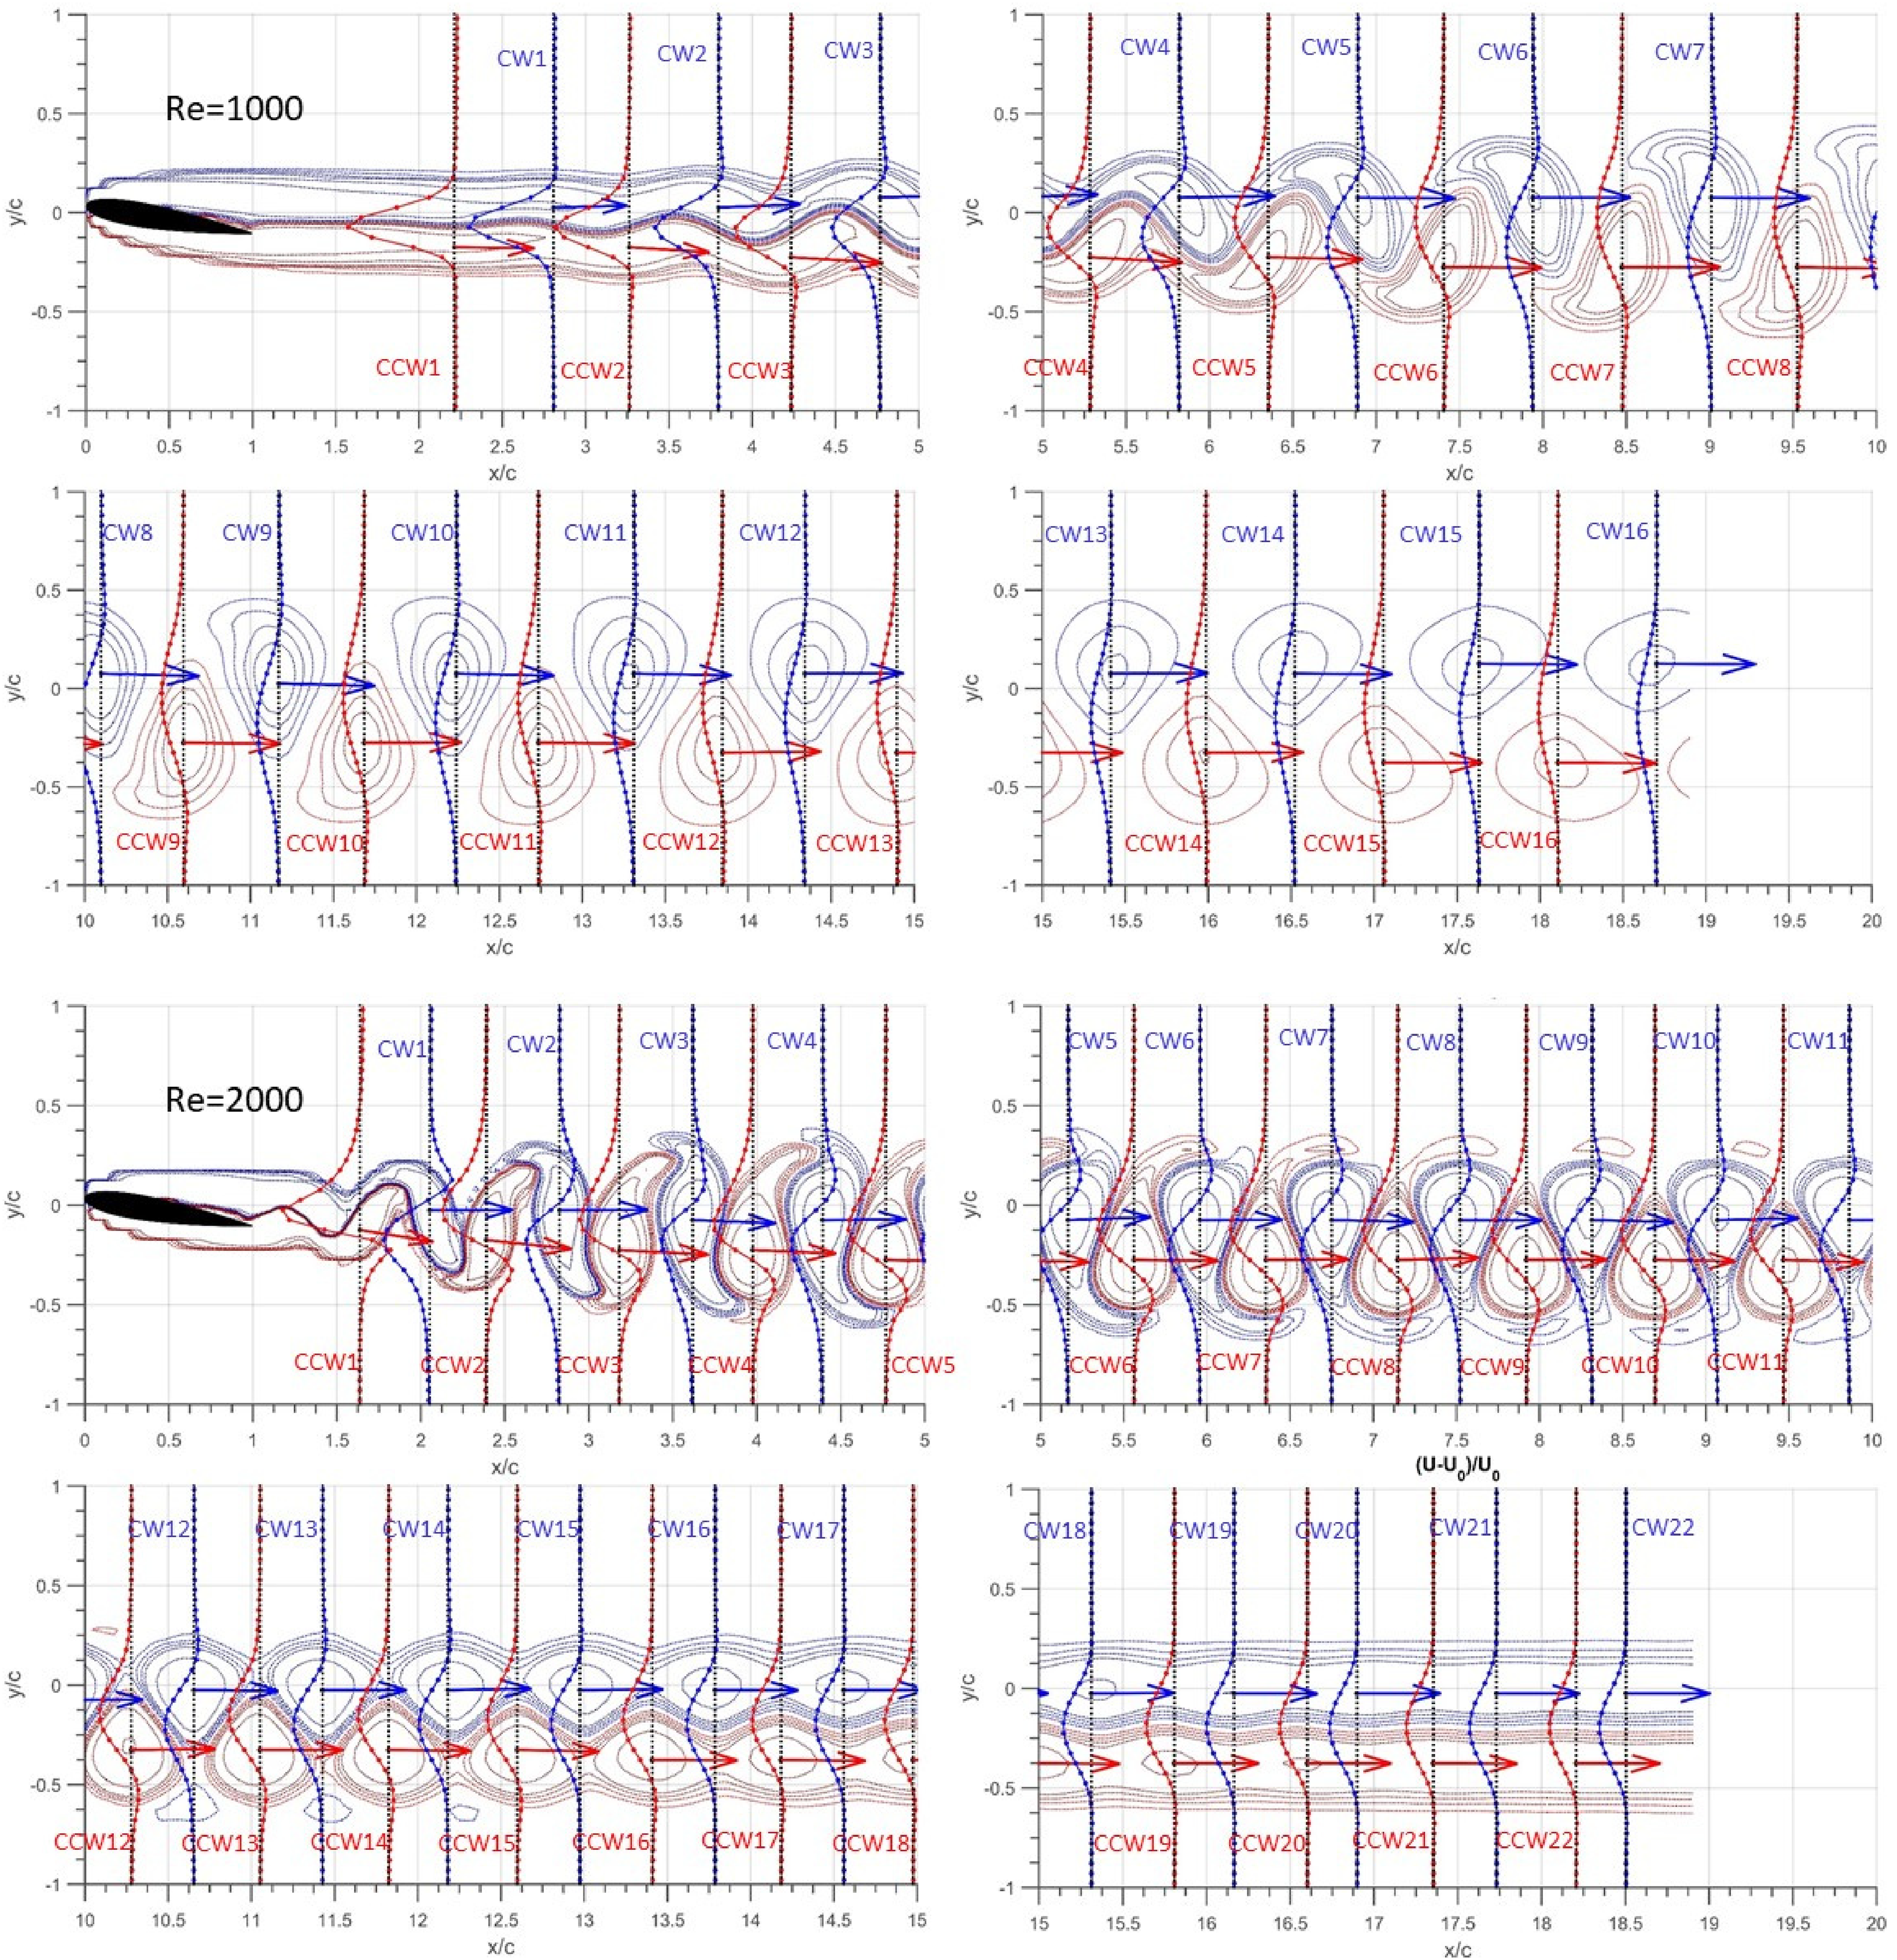
Instantaneous relative velocities (U − U0//U0) at various transverse locations passing through the vortex cores (arrows show the absolute velocity vector
Spacing between vortices at the wake
For a Kármán vortex street behind a circular cylinder, the opposite sign vortices can be arranged in the longitudinal direction symmetrically or in a staggered manner. 2 The spacing between the same signed vortices is denoted with parameter a and the longitudinal spacing between two opposite signed vortices is denoted with f (Figure 15). The ratio f/a is called the dislocation ratio and is used to distinguish whether the vortices of one row are positioned midway between the vortices of the other row or not. The lateral spacing between two vortices with opposite signs is denoted as “b.”
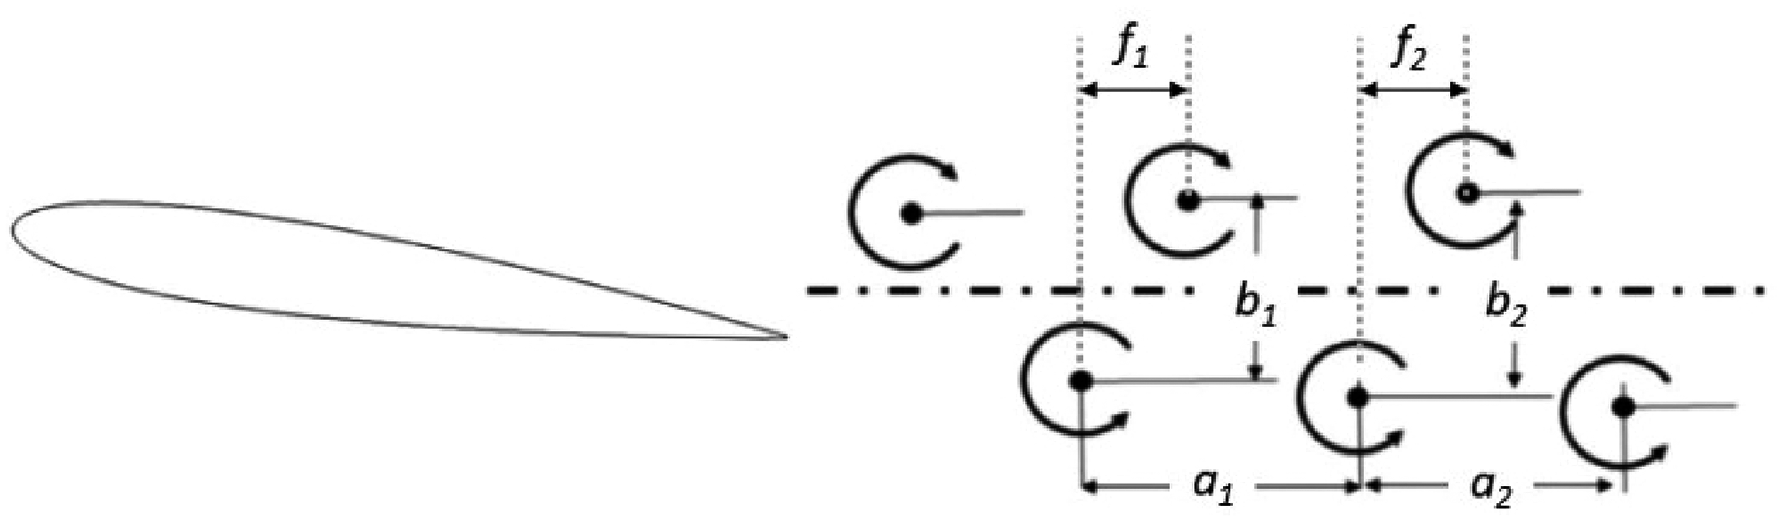
Definitions of the longitudinal distance (a), the lateral distance (b), and the dislocation distance (f).
The distance between vortex pair interactions affects the topology of the vortices. 25 The dislocation ratio f/a is calculated with respect to the distance between two adjacent CCW vortices. The CW and CCW vortices are drawn projected on a single longitudinal line in Figure 16.

Dislocation f/a ratio and longitudinal distribution of staggered vortices at α = 8° for different Reynolds numbers (the vortex positions are projected to the x-axis).
For Re = 1000, at the downstream of NACA 0012 airfoil at α = 8°, the vortex cores of the opposite signs are found to be arranged almost at halfway between the two same signed vortices. A relatively uniform spacing attributed to an almost constant vortex shedding frequency at the downstream of NACA 0012 airfoil for Re = 1000 case at α = 8°. The f/a ratio is found to vary between 0.47 and 0.57 at the wake of NACA 0012 airfoil for Re = 1000 and α = 8°. The dislocation ratio is found to be bigger for the Re = 1000 case close to the airfoil where the CW vortex is positioned at 57% between two consecutive CCW vortices at approximately x = 2c downstream of the airfoil. The CW vortex position almost to the half of the two opposite sign vortices (50%–51%) between 4c and 9c downstream locations. In the locations where the ratio f/a changes, the vortex shapes also change.
The double row vortex street having f/a = 0.5 (vortices at the mid interval of the oppositely signed vortices) has a weak instability even if the Kármán ratio b/a = 0.281 by taking into account the second-order terms of the equation of motion. 4 Wille 4 and Domm 31 proved that if the Maue–Dolaptschieff stability condition (sin π·f/a = sinh π·b/a) is satisfied, the vortex street becomes unstable in the second order otherwise it is unstable in the first order. Investigation of the dislocation ratio in addition to the Kármán ratio is important to understand the instabilities behind the airfoil wake. By investigating the space generated by these two ratios 6 different regions are detected as shown in Figure 17. Region 3 (R3) is the only region where the flow is close to the Kármán ratio and f/a = 0.5. Regions 1 and 2 lie above the Maue–Dolaptschieff stability line and other regions are below the stability line (Figure 17(b)). Most of the Re = 4000 vortex spacings are found to be distributed in Region 7 where the dislocation ratio varies from 0 to 1. Just close to the airfoil, the vortices pass through R2, R5, and R6 regions with very low f/a ratios compared to Re = 1000 and Re = 2000 vortex spacings (Figure 17(a)). Region R1 includes vortices having a b/a ratio of around 0.2 and Region 2 lies between R1 and R3 regions. Region 4 has a spacing ratio between 0.3 and 0.34 and the dislocation ratios in this region are between 0.5 and 0.54. Region 5 has a spacing ratio between 0.36 and 0.4, Region 6 has a spacing ratio between 0.4 and 0.5, and Region 7 has a spacing ratio between 0.5 and 0.6. The streamwise vortex core velocities are relatively low in Region 1, however, their crosswise velocities are high. Region 3 (close to Kármán vortex configuration) is only observed at Re = 1000. Region 2, which is like a transition region, is observed at Re = 2000 and 4000. The streamwise and the crosswise vortex core velocities in this region have an oscillatory behavior.
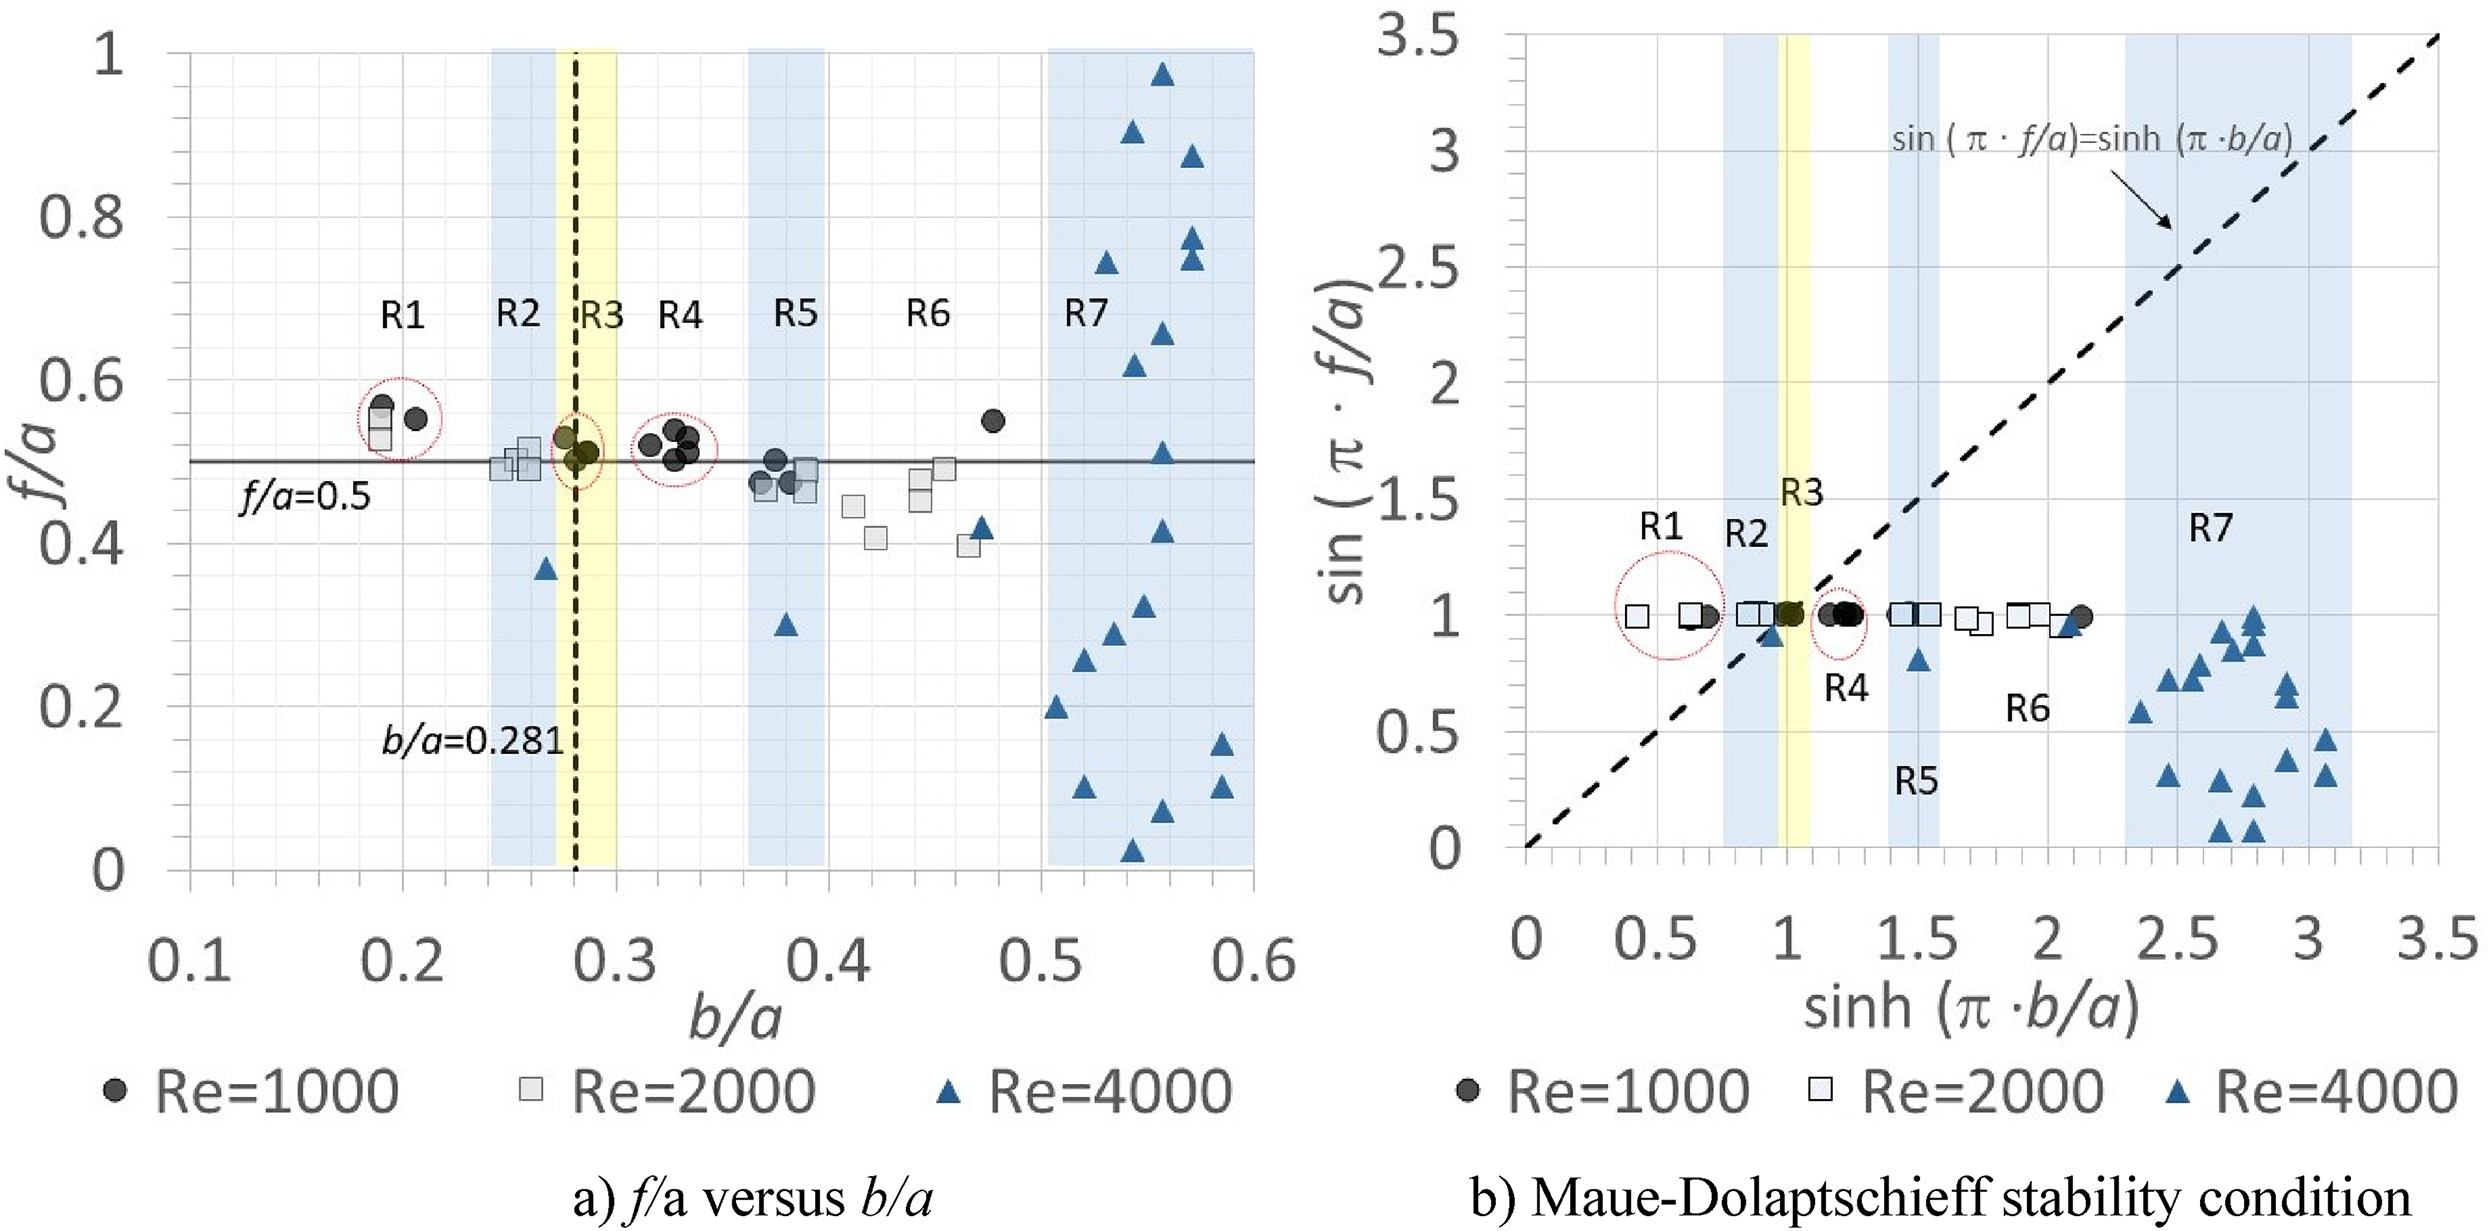
Dislocation f/a ratio versus b/a ratio and Maue–Dolaptschieff stability condition at α = 8° for different Reynolds numbers.
Longitudinal spacings, a, are calculated as the streamwise difference between two consecutive CCW vortices and also as the streamwise difference between two consecutive CW vortices and represented in Figure 18. A local maximum of the longitudinal spacing is reached at each separate region defined in Figure 17.

Longitudinal spacings of the instantaneous vortices behind NACA 0012 airfoil at α = 8° at different Reynolds numbers.
At Re = 4000, the longitudinal spacings of the bottom CW vortex rows are found to be very close to the longitudinal spacings of the CCW vortices near the airfoil and then it increases compared to CCW vortices. However, the top (first row) CW vortices’ longitudinal spacings are found to be lower than the CCW vortices (Figure 18).
For a circular cylinder, the vortex streets are generally unstable except when b/a = 0.281 as found by von Kármán4,25,32 for which all wavenumbers are neutrally stable. Von Kármán has used the wavenumber definition to distinguish the vortex arrangements and their stabilities in terms of the normal modes of the sinusoidal perturbations. 32
Figure 19 shows the Kármán spacing ratios taking into account both the longitudinal spacing of CCW vortices (ratio defined as b/aCCW) vortices and CW vortices (ratio defined as b/aCW) behind NACA 0012 airfoil at α = 8° for the different Reynolds numbers investigated. The b/a ratio is found to have an increasing trend toward the downstream for all Reynolds numbers investigated.

Kármán spacing ratio (b/a) of the instantaneous vortices for NACA 0012 airfoil at α = 8°.
Vortex shedding frequencies
The vortex pattern is periodic so the frequency of the wake shedding phenomena is an important parameter to understand the vortex aerodynamics at low Reynolds numbers. The frequency of the periodic vortex shedding is obtained in the current study by the amplitude spectrum of the lift coefficient (Figure 5). Strouhal number is defined in terms of the shedding frequency (f) as


Strouhal number at different α, airfoil thickness and Reynolds numbers.
The results are also presented in terms of the chord vertical projection d = c·sin α with Roshko, Reynolds, and Strouhal numbers defined in terms of this length. Roshko number is defined as
The regression equation obtained for the Reynolds number between 1000 and 4000 is given in equation (4).


Correlations of Roshko, Strouhal, and Reynolds numbers at low Reynolds numbers.
Conclusion
The coherent structures at the wake of NACA 0012 airfoil at low Reynolds numbers have been studied in a range of Reynolds numbers from 1000 to 4000 and at α = 8°. The laminar boundary layer separation occurs on the upper surface of the airfoil and a separation bubble is observed for all the cases investigated.
The critical angle from the steady convergence condition (Mode 1) to unsteady oscillatory behaviors (Mode 2) is obtained at α = 8° for NACA 0012 at Re = 1000. At the critical angle, the instantaneous vortex patterns are oscillatory and differ from the mean vortex pattern. When the wake reaches a level of instability, the original vortex is broken up into fragments at the downstream of the airfoil to form alternating vortices. The critical angle decreases as the Reynolds number increases in the Reynolds number range investigated. As a result, the separation occurs later at lower Reynolds numbers. The mean lift coefficient increases 14.5%, the mean drag coefficient decreases 23.4%, and the mean lift to drag ratio increases 47.5% as the Reynolds number increases from 1000 to 4000. The separation point is observed to move toward the leading edge as the Reynolds number increases. From the mean vorticity contours, it is observed that there is a formation region of the vortex street where the wake width reaches a minimum then starts to grow up. A multiple vortex row formation is observed clearly at Re = 4000. For Re = 1000, the vortex cores of the opposite signs are found to be arranged almost halfway between the two same signed vortices. In the present study, by investigating the space generated by the Kármán ratio and dislocation ratio, six different regions are detected. A regression equation is found to correlate Roshko number with Reynolds number and both Roshko number and Strouhal number are found to increase with Reynolds number in the interval of 1000 to 4000 for NACA 0012 airfoil. For a future study of the current study, the three-dimensional effects will be investigated to observe its influence on the critical angle and wake mode transitions at the given Reynolds numbers for 8° angle of attack.
Footnotes
Declaration of conflicting interests
The author declared no potential conflicts of interest with respect to the research, authorship, and/or publication of this article.
Funding
The author disclosed receipt of the following financial support for the research, authorship, and/or publication of this article: This work was supported by TUBITAK with project number 116M273.