
Abstract
This paper focuses on the quadrotor drag coefficient model and its estimation from flight tests. Precise assessment of such a model permits the use of a quadrotor as a sensor for wind estimation purposes without the need for additional onboard sensors. Firstly, the drag coefficient has been estimated in a controlled environment via wind generator and motion capture system. Later, the evolution of the coefficient is observed for various mass and fuselage shapes. Finally, an estimation method is proposed, based on the least-squares optimization, that evaluates the drag of the quadrotor directly from outdoor flight data. The latter leads the methodology towards easier adoption in other researchers’ systems without the need for complex and expensive flight testing facilities. The accuracy of the proposed method is presented both in simulation, based on a realistic flight dynamics model, and also for real outdoor flights.
Keywords
Introduction
Wind field measurement is an important aspect of atmospheric science. Especially, boundary-layer meteorology requires wind speed and direction to study the atmospheric processes close to the ground surface. The ideal would be the use of multiple sensor bases capturing the wind information with high spatial and temporal resolution. However, this solution is practically not feasible from the cost and logistics point of view. The use of UAVs has a big impact on this point, and therefore several methods have already been investigated by researchers. A very common way is to use a fixed-wing aircraft and estimate the wind from the flight track 1 or with the help of additional sensors mounted onto the system, such as a multi-hole probe2,3 or even a cheaper solution based on a combination of the simple Pitot tube and wind-vanes. 4 On the other hand, the multi-rotors, known as drones, can offer operational easiness over fixed-wing vehicles as they can take off and land vertically within a confined space and be more compact. However, being an often underactuated system, they have to incline toward the desired direction, which is becoming inappropriate for some of the sensors used in fixed-wing vehicles. Additionally, the flight speed of multi-rotors is typically lower compared to fixed-wing vehicles, lowering the dynamic pressure and making it difficult to use multi-hole probes. Hence, Wolf et al. 5 compared the use of four different anemometers on a quadrotor. The study revealed that a thermal anemometer could be used, at the cost of modifications to the UAV structure to place it far enough from the disturbances induced by propellers.
The compactness of the multi-rotors can be used as an advantage, and instead of using additional sensors, the motion and attitude of the vehicle can reveal information about the wind speed and direction.6–9Gonzalez et al. 7 present different possible models such as static, kinematic, or full dynamic. In addition, a methodology to extract the required parameters is given. They have characterized the propulsion system by using a motor test bench during a wind tunnel experiment, and the drag is extracted from outdoor flights at constant ground speed in steady air. The drag is observed to be proportional to the relative airspeed. Schiano et al. 6 and Marino et al., 10 used experiments with a six-axis force balance, a very precise but fragile and expensive system. Finally, Sikkel et al. 8 presents a nonlinear observer able to accurately predict the wind components, using only low-cost Inertial Measurement Unit (IMU) and ground speed measurements. The drag force is considered proportional to the rotational speed of the motors, which is almost constant during operation, leading to a constant rotor drag coefficient, similar to González-Rocha et al., 7 and Leishman et al. 11 Outdoor flights have been performed in Neumann and Bartholmai, 9 González-Rocha et al., 7 and comparisons between ground reference measurements are made, showing the feasibility of wind measurement from quadrotors based on IMU and GPS measurements. Note that estimating the vertical components of the wind requires accurate modeling of the propulsion system and despite that, has not shown satisfactory results in Meier et al. 12 In the light of these general principles and authors’ previous work, 13 the present article is organized as followed. First, the problem modeling focuses on the equations of motion, the hypothesis, and limitations, as well as the experimental airframe. Then, the parameter identification method and evaluation of the mass and fuselage shape effect are presented. Finally, simulation and outdoor flight experiments are described and their results are analyzed.
Problem formulation
The objective of this study is to estimate the drag coefficient and evaluate the effect of various physical characteristics, such as mass and shape. This section is presenting the dynamic models and the experimental setup that will be used.
Kinematic and aerodynamic model
The kinematic model is the same as a previous work
13
and is very common in the literature
7
: equation (1) represents the wind triangle
The wind speed is supposed to be constant or slowly varying, therefore the derivative of the wind triangle (equation (1)) gives:


The control force vector


Experimental setup
The custom quadrotor frame presented in Hattenberger et al. 13 has been reused for this experiment. It is a simple cross shape made of thin aluminum bars to hold the motors and it is possible to place a spherical 3D-printed central body around the electronic components and the battery. In the previous work, the spherical body was always used. Since the goal of this new work is to study the influence of mass and shape, several experiments are conducted with different configurations. Starting from the base configuration, additional masses can be added to increase the weight without changing the overall shape (thus, not changing noticeably the friction drag) or by adding the spherical body over the central part. Since the maximum additional mass that can be added is almost the same as the frame with the sphere, we consider that it allows comparing the quadrotor with the same mass condition but with a different shape. Figure 1 is presenting the different elements: base frame, extra masses, and spherical body.

Quadrotor with additional masses and custom spherical body.
The general characteristics and components are summarized in Table 1. The autopilot software used is the Paparazzi UAV System. 14 For indoor calibration and experiments, the localization is provided by a motion capture system from Optitrack. For outdoor flights, a GPS receiver is used.
Quadrotor characteristics.

Evaluation of mass and shape
Parameter identification procedure
The drag coefficient identification methodology is the same as Hattenberger et al., 13 which is a previous work with the same facility. The general idea is to hover with the frame to characterize in front of a wind generator or wind tunnel. In this case, the wind comes from a WindShape wind generator and the indoor position is provided by an Optitrack motion capture system. Figure 2 shows the quadrotor during a calibration.
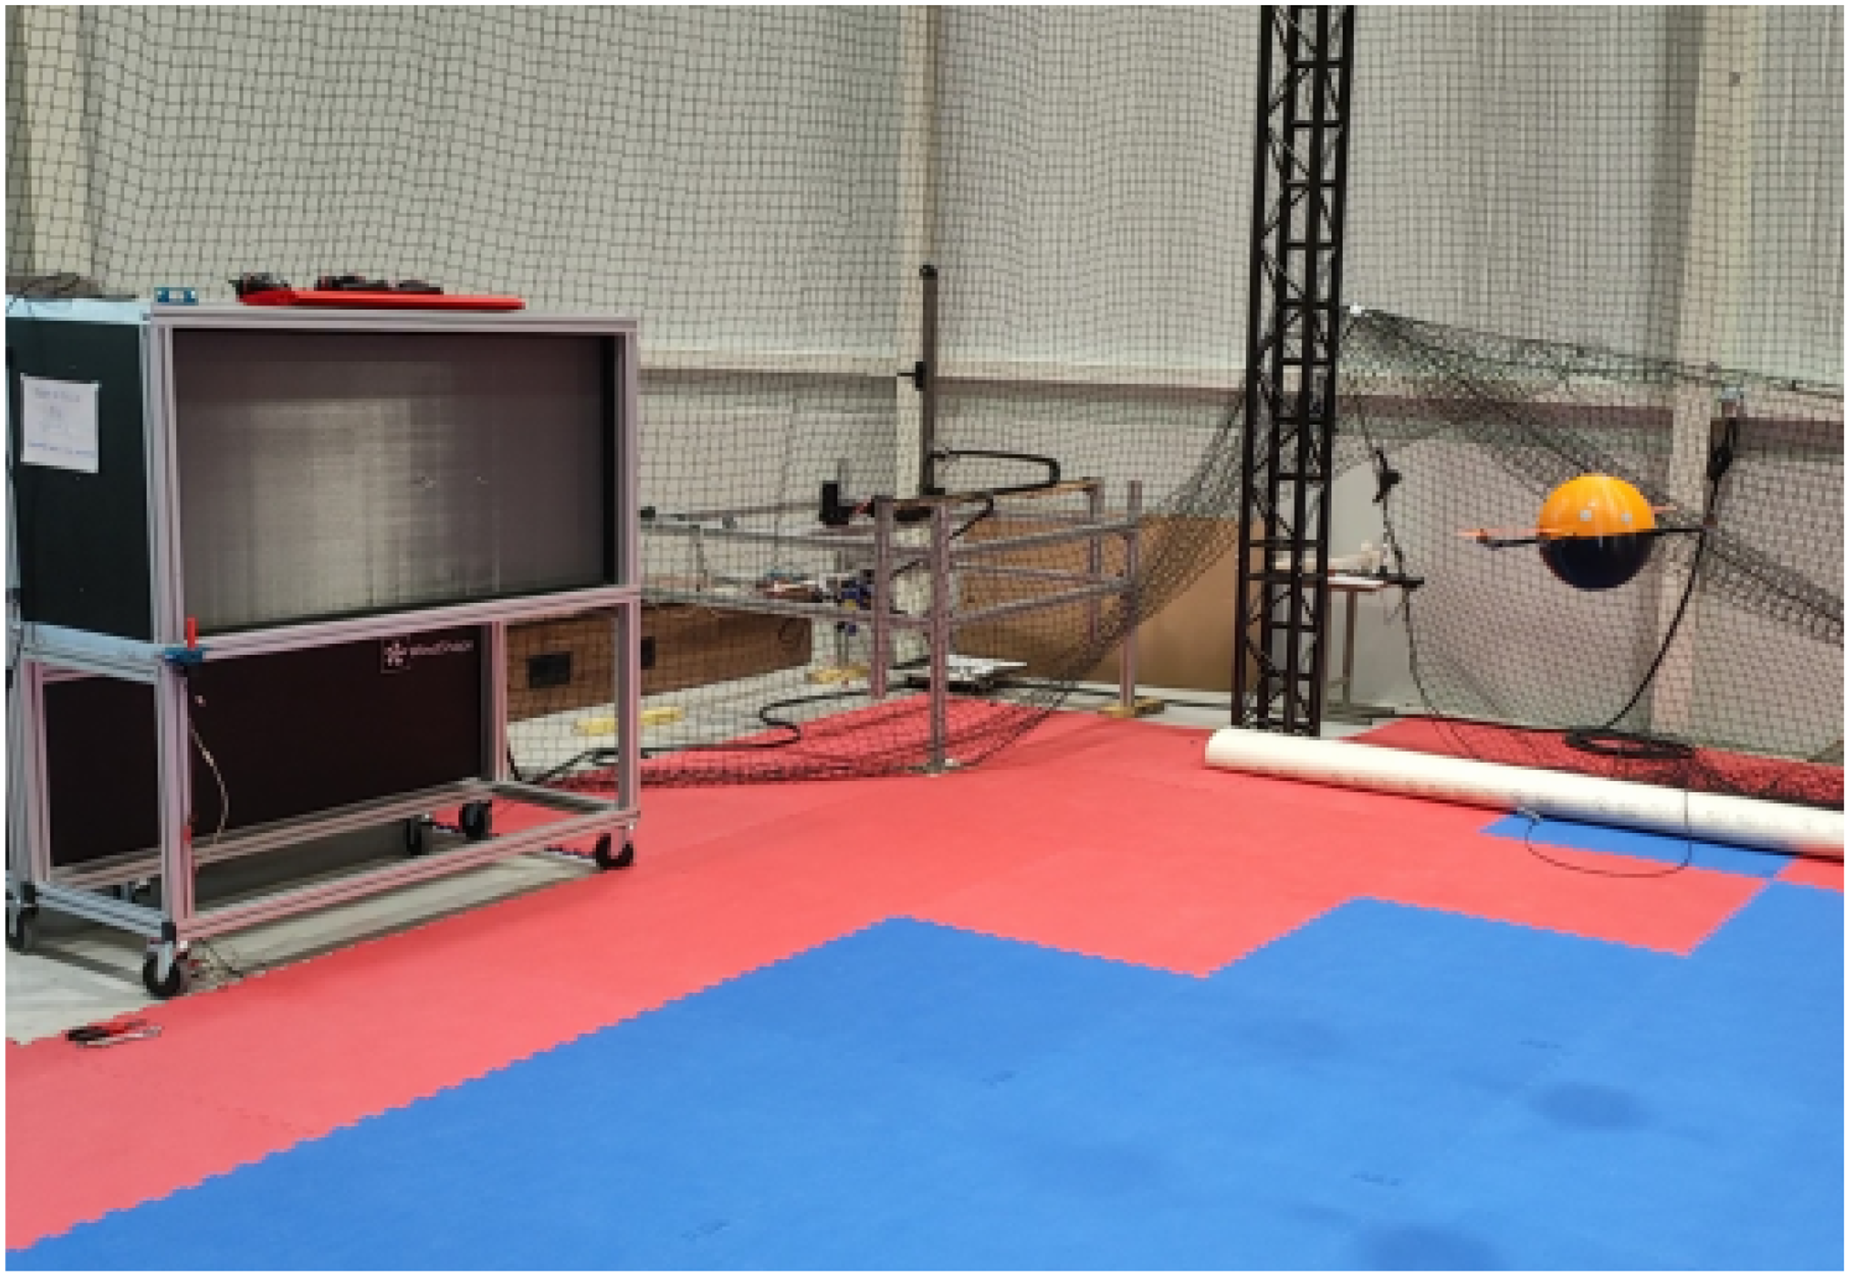
Quadrotor during calibration in front of the WindShape wind generator.
When the wind is blowing on a frame, the generated drag is balanced by the horizontal thrust coming from the bank angle. This angle increases with the wind speed. In order to mitigate errors due to attitude estimation offset, the frame is turning around its yaw axis. The result is that the roll and pitch angles, estimated by the Attitude and Heading Reference System (AHRS) from inertial measurements, describe sinusoidal shapes. Figure 3 is showing the roll angle during the calibration of the quadrotor. This flight corresponds to four different wind speeds, with two complete turns of the frame at each speed. The red sine curves are fitted to the telemetry data. The magnitude of each oscillation corresponds to the quadrotor’s bank angle in the wind generator’s direction.

Estimation of the bank angle from sine curve fitting of the roll angle at different wind speeds.
The conducted measurements are as follows:
Five different quadrotor masses are tested: 0.546 kg (no additional mass), 0.676 kg, 0.806 kg, 0.936 kg and 1.066 kg For each mass, estimate bank angle at 9 different wind speeds from 2.5 m/s to 12.5 m/s Plot the tangent of the bank angle as a function of speed for the different masses.
The result is shown in Figure 4. The next sections are analyzing the two most important outcomes of these data: the hypothesis of linearity of the drag model and the effect of the mass (and shape) on the drag coefficient.

Mean bank angle at different wind speeds and different masses; error bars are standard deviations on measurements.
Discussion on drag model
Figure 4 is showing the mean bank angle as a function of wind speed for different mass configurations. It can be observed that between 2 m/s and 9 m/s, the relation between the angle and speed, thus between drag and speed, is linear. After that point, measurements are becoming unreliable due to important perturbations on the frame.
In Meier et al., 12 a similar result is found for a standard DJI quadrotor. At a bank angle of 6 deg, the drag switch from a linear to quadratic evolution, which corresponds to an airspeed around 8 m/s to 10 m/s. The standard flight speed for such a frame is around 5 m/s. In order to keep the model simple, we will assume that the relative airspeed on the frame stays lower than the critical speed, and only the linear part is considered.
The reference speed for each experiment has been established from the averaged measurements of a hot-wire anemometer. The comparison with other means of measurement (ultrasonic wind sensor) has shown that our reference probe might overestimate the speed by 0.1 m/s to 0.5 m/s. If corrected, the linear model holds down to a null speed.
Effect of mass and shape on drag
The first observation from Figure 4 is that at a given speed, the bank angle is decreasing with the added weight. This is also depicted in Figure 5. When the weight is increasing, the total thrust is increasing to compensate. The total drag is also increasing, however, the bank angle is decreasing. This means that the drag is not increasing as fast as the weight.
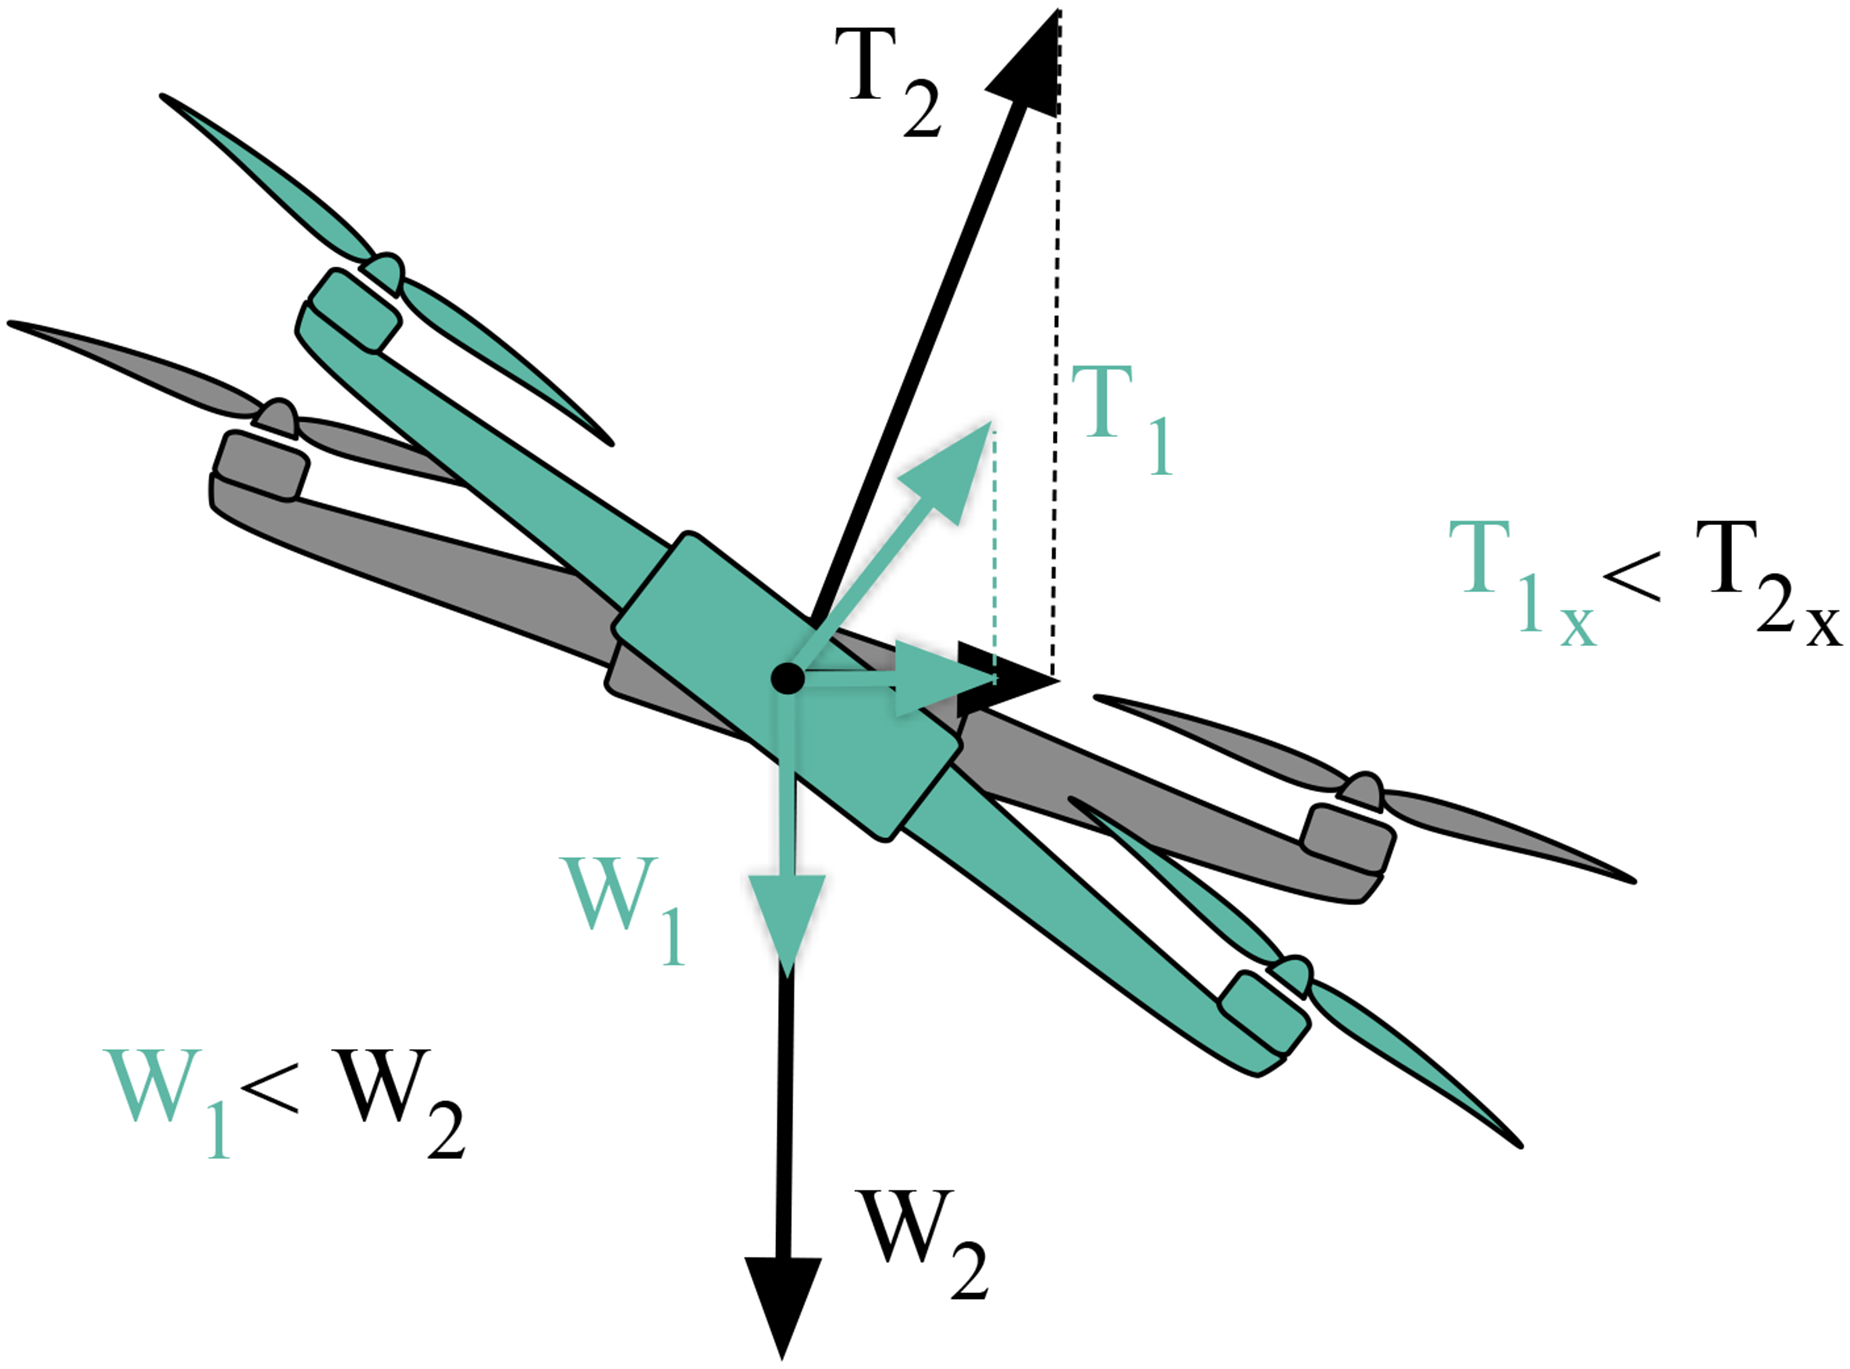
Thrust and weight forces applied on a quadrotor with two different masses. When the mass increases, the thrust increases to compensate for the weight, and the drag is also increased due to the increased motor speed, however, the overall bank angle is reduced.
Also from the data presented in Figure 4, linear regressions are applied to data lower than 9 m/s, for each of the masses. Then the drag coefficient is computed as in Hattenberger et al. 13 Figure 6 is showing the results by plotting the drag coefficients as a function of the mass of the quadrotor. Since the additional weight is not changing the overall shape, the variations of the drag are only related to the variations of motor speed, since a higher thrust is required with increasing weight. Linear regression is applied to the data, showing that the drag coefficient is increasing with the mass.

Linear drag coefficient as a function of mass; green cross indicates the model with the spherical body; error bars are linear regression standard errors on linear regressions.
The influence of the shape is evaluated by comparing the drag coefficient of the quadrotor with and without the spherical body, at the same total weight. The green cross on Figure 6 (top right) is showing the drag coefficient with the sphere, coming from a previous calibration. It can be observed that the coefficient is much bigger, almost doubled by the presence of the large sphere at the center, which is an expected result.
Finally, the Figure 7 is showing the drag coefficient over mass ratio (

Linear drag coefficient over mass ratio as a function of mass; Green cross indicates the model with the spherical body; error bars are linear regression standard errors on linear regressions.
Estimation of drag from flight data
The previous section has shown that the weight and shape of the airframe have an important impact on the drag coefficient. If it is possible to measure this value with a complex experimental setup involving wind tunnels, motion capture systems, or forces and torque sensors, it would be more convenient to extract the relevant parameter from flight data directly. The next sections are presenting an approach to estimate the drag over mass
Estimation using least-square optimization method
Least squares problems are optimization problems expressed in the form


Simulation results
In order to evaluate the feasibility of the approach, it is first applied to simulation data. The simulator used is provided by the Paparazzi system and is based on the JSBSim flight dynamic model. It can be considered a high-fidelity model that can take into account complex aerodynamic parameters and wind inputs. During the simulation, the mass is fixed to
The trajectory of the quadrotor is a square with a side length of 40 meters. Several simulated flights have been recorded at different wind speeds: 0 m/s, 4 m/s, and 8 m/s, always coming from the North in the NED frame. The commanded ground speed of the quadrotor is 2 m/s. Similar results are obtained at 5 m/s but are not presented here.
Figure 8 presents the results of the simulation along the X axis (towards the North), at the three different wind speeds. The data plotted correspond to the elements of the dynamic equation (7): acceleration, specific drag, and specific thrust. The wind is correctly estimated in all cases with an error lower than 0.5 m/s in the worst case. The error (sum of the three aforementioned elements) is always close to zero. It is important to note that the data presented here are based on the perfect simulated values without sensor (IMU, GPS, barometer) noise or bias.

Evolution of acceleration, specific drag, specific thrust, and equilibrium error during a square trajectory in simulation. Results are presented for the X axis only, at a wind speed of 0 m/s (top), 4 m/s (middle) and 8 m/s (bottom).
Table 2 is the synthesis of the simulation flights, presenting the estimated parameters compared to the values given as input to the simulator. It can be concluded that the method is functional and can provide excellent results on synthetic data.
Simulation results for drag over mass coefficient and wind components for three different configurations: 1 - no wind, 2 - 4 m/s wind from North, 3 - 8 m/s wind from North. The commanded ground speed is 2 m/s. The drag and mass correspond to the quadrotor with a sphere body. Corresponding acceleration and forces are shown in Figure 8.

Experimental flight results
In order to evaluate the method in realistic conditions, the same type of flight as in the simulation has been performed with the real frame outdoors. The original work
15
of this study has presented a preliminary data set showing poor results. Deeper analyzes of the flight logs and the possible external causes have led to the following conclusions:
The assumption of constant wind is hard to obtain, even for a few minutes, unless flying on a very calm day, thus with a wind close to zero. The horizontal thrust model is based on the internal attitude estimation of the drone, it is, therefore, crucial to have a good estimate of the orientation matrix, especially during strong acceleration phases. The first flights were using a decoupled INS/AHRS filter. Since such an attitude filter is making the assumption of zero acceleration in attitude computation, it is not compatible with this method.
As a result, the second set of flights is conducted at the Enac campus early in the morning on two different calm days. During the experiments, the wind was between 0 and 1 m/s on day 1, and between 1 and 2 m/s on day 2. The full INS EKF2, from the PX4 project, is used to provide a filtered attitude and velocity. The input sensors are a TDK-Invensense ICM-20600 accelerometer and gyrometer, a STMicro LIS3MDL magnetometer and a U-Blox M8 GPS receiver. Figure 9 is the 3D trajectory of the quadrotor, in full autonomous navigation, at altitudes between 3 and 5 meters above the ground. The size of the square is 40 meters, like the simulation case.

Square trajectory for the outdoor experiment. The four segments are 40 meters long. The flight speed is 2.5 or 5 m/s.
Four different configurations of the quadrotor have been tested:
the light frame, with no additional mass the medium frame, with half of the additional masses but with the same general shape as the light frame the heavy frame, with all the additional masses but with the same general shape as the light frame the spherical body, placed around the electronics, resulting in a different shape but with heavier weight
One the flight with the light configuration is detailed on Figure 10. The acceleration is obtained with a Savitzky-Golay filter from the scipy.signal package used as a differentiation filter on the ground speed.

Evolution of acceleration, specific drag, specific thrust, and estimated wind during a square trajectory in outdoor flight.
Figure 11 is specifically showing the residual error along the X and Y axis. This error is the sum of the acceleration minus the specific thrust and drag forces. As we can see, the fitting is rather good during the complete trajectory, even when changing directions.

Evolution of equilibrium error during a square trajectory in outdoor flight.
Each flight has been performed two to eight times depending on the configuration and the available flight time. Three different speeds have been tested, at 2.5 m/s, 5 m/s, and 8 m/s. The complete results can be seen on Figure 12. As we can see, the different flights have a consistent estimation of the

Comparison of the
At this moment, the real reasons for the coefficient estimation errors are not obvious. Especially, the fitting of the least square is good and the standard deviation of the estimated ratio is also low over the different experiments. Further analyses are required to tell if the source of the error is coming from the estimation errors, the calibration of the model and the sensors, the alignment errors between the calibration and the real flights, or some other unforeseen elements. One can note that in steady conditions with a relative airspeed of 2.5 m/s, the difference corresponds to a bank angle of less than
Regarding the wind estimation, the estimated norm of the wind is between 0 and 1 m/s for day 1, and between 1 and 2 m/s for day 2, as expected from the flight test conditions. At such a low speed and considering the buildings surrounding the test field, the wind direction is not a relevant parameter.
The Table 3 is summarizing the outdoor experimental flights. Comparing the estimated and expected values, it is clear that this method, although giving realistic numbers, is not yet reaching the level of accuracy that one can expect for applications of high-precision wind estimation. Nevertheless, it can be used to obtain a fairly good approximation of the wind field.
Experimental results for drag over mass coefficient and wind components for three different configurations: 1 - light frame, 2 - medium frame, 3 - heavy frame, 4 - spherical body. Wind speeds in redred are from day 1, blueblue are from day 2.

Conclusion and future work
The aim of this study was first to investigate the influence of mass and shape on the drag of a quadrotor, and second to propose a method to estimate this drag coefficient from flight data. This parameter is crucial for wind estimation, but can also be used to improve guidance and navigation. The conclusion for the tested model is that a light version is beneficial for drag estimation. However, a shape generating drag is also interesting, thus a good compromise for a future experiment would be to find a structure generating drag at a low cost for the weight, for instance by using inflatable elements. Concerning the coefficient estimation, the method based on a least-square optimization has proven to work in simulation but is showing a consistent error with real flight data. The reasons for that still need to be identified and this point will be addressed in future work. Current results are nevertheless encouraging.
Another approach would be to integrate the drag coefficient to the state vector of a Kalman filter estimating the wind and airspeed. Compared to the work in Hattenberger et al., 13 where the filter was a linear Kalman filter, introducing the drag coefficient would have two consequences: first, the dynamic becomes non-linear, which requires an Extended Kalman filter formulation, and second, the new state element is not always observable, it would depend on the current speed and acceleration of the system as discussed in Leishman et al. 11 Our goal for a future study is to establish the observability criteria so that the state, at least for the drag coefficient, is propagated only when observable and kept as a constant parameter otherwise. The main interest of a Kalman filter is that it can cope with variations of mass and shape during the flight without the need for a specific calibration procedure. This could be applied to drones used in package delivery scenarios, while other methods are more adapted to frames with fixed characteristics such as the ones used for atmospheric science.
Footnotes
Declaration of conflicting interests
The author(s) declared no potential conflicts of interest with respect to the research, authorship, and/or publication of this article.
Funding
The author(s) received no financial support for the research, authorship and/or publication of this article.