
Abstract
The method of connection weights in neural networks was used to analyze the sensitivity of the compressor rotor, and the Back Propagation Neural Network (BPNN) was used to construct the analysis relationship between the compressor rotor's geometries and the performance based on the training and learning of the data base, and the prediction accuracy can reach more than 99.99%. Then the modified Grason Algorithm based on the neural network connect weights was used to quantify the contribution of the geometrical effects on its performance. The result shows that the tip clearance contributes 11.43% (efficiency sensitivity analysis) and 10.18% (pressure ratio sensitivity analysis) to compressor performance changes. This study focuses mainly on the robust optimization of tip clearance. Non-intrusive probability collection point method (NIPC) was adopted for the uncertainty propagation. The robust optimization method based on BPNN agent model coupled with multi-objective genetic algorithm Non-dominated sorting genetic algorithm-II (NSGA II) was used to perform the optimization. Compared to the design prototype, the variance of robust compressor rotor's efficiency could be reduced by 21.04%.
Introduction
At present, high-rotating compact axial compressors are widely used not only in the aviation, fuel cell, micro-engine, and household appliance industries, but also in the UAV (Unmanned Aerial Vehicle) industry. But there is little published literature on compact axial compressors. The compact axial compressor has the characteristics of low Reynolds number and small size compared with the traditional axial compressor. Because of the small size, the small machining uncertainty will bring the large relative geometric change, which will have a greater impact on the compressor performance. When there is a large deviation between the actual performance of the compressor and the rated performance of the design, it will lead to design failure or product quality unqualified problems, which will not only lead to the extension of the design cycle, but also increase the cost of processing and manufacturing, reduce the competitiveness of the product. In the actual processing and manufacturing process, adopting more precise machining machines to tighten machining tolerance or increasing equipment maintenance frequency can maintain the consistency between the actual product and the design product and the same batch of products to a certain extent, but both methods will lead to the increase of production cost 1 Adopting the uncertain optimization method to optimize compressor rotor geometry size or using three-dimensional designing method to change the geometry layout 2 of the compressor rotor, to improve the anti-interference ability of compressor rotor is so-called robust design. In the design process, if the robust design method is adopted, the manufacturing error will be considered and the sensitivity of the product to the manufacturing uncertainty will also be reduced without changing the existing manufacturing capacity. In this way, not only the manufacturing cost can be reduced, but also the processing time can be shortened and the R&D cycle of the product can be reduced. In this paper, the uncertain CFD optimization method is used for compressor geometry size's robust design.
Many CFD simulations are based on determined boundary conditions, physical models, and geometric parameters. In these deterministic simulations, the system response is a single value. However, the actual running status of industrial products is affected by the uncertainty of running and geometry. Therefore, new methods are required on the level of the simulation tool to consider the existence of uncertainties, to improve the reliability of the simulation process, which means the results of the simulation is not a single value, but the mean value and variance of system response, (mean value represents the product performance, and variance represents the amplitude of the fluctuations). The simulation in which the stochastic characteristics of these parameters are included in the calculation process is the uncertain CFD calculation. Besides, in order to minimize this fluctuation, improve the consistency of the performance of the mass-manufactured products and the reliability of the designed products, designers should not only quantify uncertainty at the level of simulation, but also use optimization algorithm to minimize the impact of uncertainty, which is robust optimization. Robust optimization can not only reduce the sensitivity of existing products to the uncertainty of geometric processing, but also obtain products with strong anti-interference ability if it is carried out in the design stage.
Kailash 1 used a robust optimization frame based on the Monte Carlo algorithm to quantify geometric uncertainty in order to enhance the performance robustness of a compact axial flow compressor which is widely used in domestic appliance, which reduces the standard deviation of the whole stage pressure ratio by 18%, and improves the robustness of the compressor. In addition, the robust optimization method is also successfully used in the aviation field, such as the optimization of aircraft wing and performance of compressor.3–7
But most of the robust optimization framework using Monte Carlo method for quantification of uncertainty which need many calculations and the literature 8 points out that the Monte Carlo sampling method will need at least 106 times of simulation to converge, so this method is high computational resource consumption and it is not feasible in most of the engineering practice.
Compared with Monte Carlo, accelerated convergence Monte Carlo and other sampling methods, the non-sampling method has more advantages in terms of less calculation. The non-sampling method does not require sampling, such as disturbance method,9, 10 moment method, generalized polynomial chaotic method and collection method. The moment method is suitable for dealing with near-linear problems and the moment method will bring some closure problems. The generalized polynomial chaos method is a widely adopted method developed in recent years, in which the output can be expressed as the form of orthogonal polynomials of input parameters and the method has fast convergence.11, 12
In addition, according to the way to solving equations, some methods are intrusive, these methods need interfaces with flowing solver code to solve coupled equations, and it not only needs to modify the existing solvers, but also introduces new calculation errors. Some methods are non-intrusive and do not require solving coupled equations. A comparison of embedded and non-embedded method can be seen in the paper.13, 14 In recent years, The NIPC has received more attention and application. 15 Loeven et al. 16 developed the NIPC using Lagrange interpolation polynomial to construct random variables and verified the efficiency and accuracy of the method by applying it to the uncertainty analysis of airfoil. This method can not only improve the calculation efficiency, but also save the calculation time. Wang 17 carried out a study to confirm the accuracy of NIPC by using the Monte Carlo algorithm based on the research of uncertainty quantification of the NASA Rotor 37. The result shows that this method can greatly reduce the number of calculations and has the considerable credibility with the Monte Carlo sampling method.
In view of the computational advantages of the NIPC method, this paper will try to reduce a newly design compact axial compressor rotor's sensitivity to manufacturing uncertainty through robust optimization. Taking the machining uncertainty into account in the design stage, the robust design of the compact axial compressor can not only avoid the problem of design failure (the performance deteriorates sharply when deviating from the design point), but it can also improve the consistency and reliability of product performance, shorten the development cycle and reduce costs. In addition, the work in this article can also provide relevant reference and technical support for the research of other turbomachinery.
Investigated compact axial compressor rotor and numerical methodology
Investigated compact compressor rotor
The investigated compressor rotor comes from a newly designed high speed compact axial compressor stage, the schematic of 3D geometry is shown in Fig. 1. The compressor rotor has 19 blades, more related parameters of the rotor are listed in Table 1.

Three-dimensional schematic of compressor.
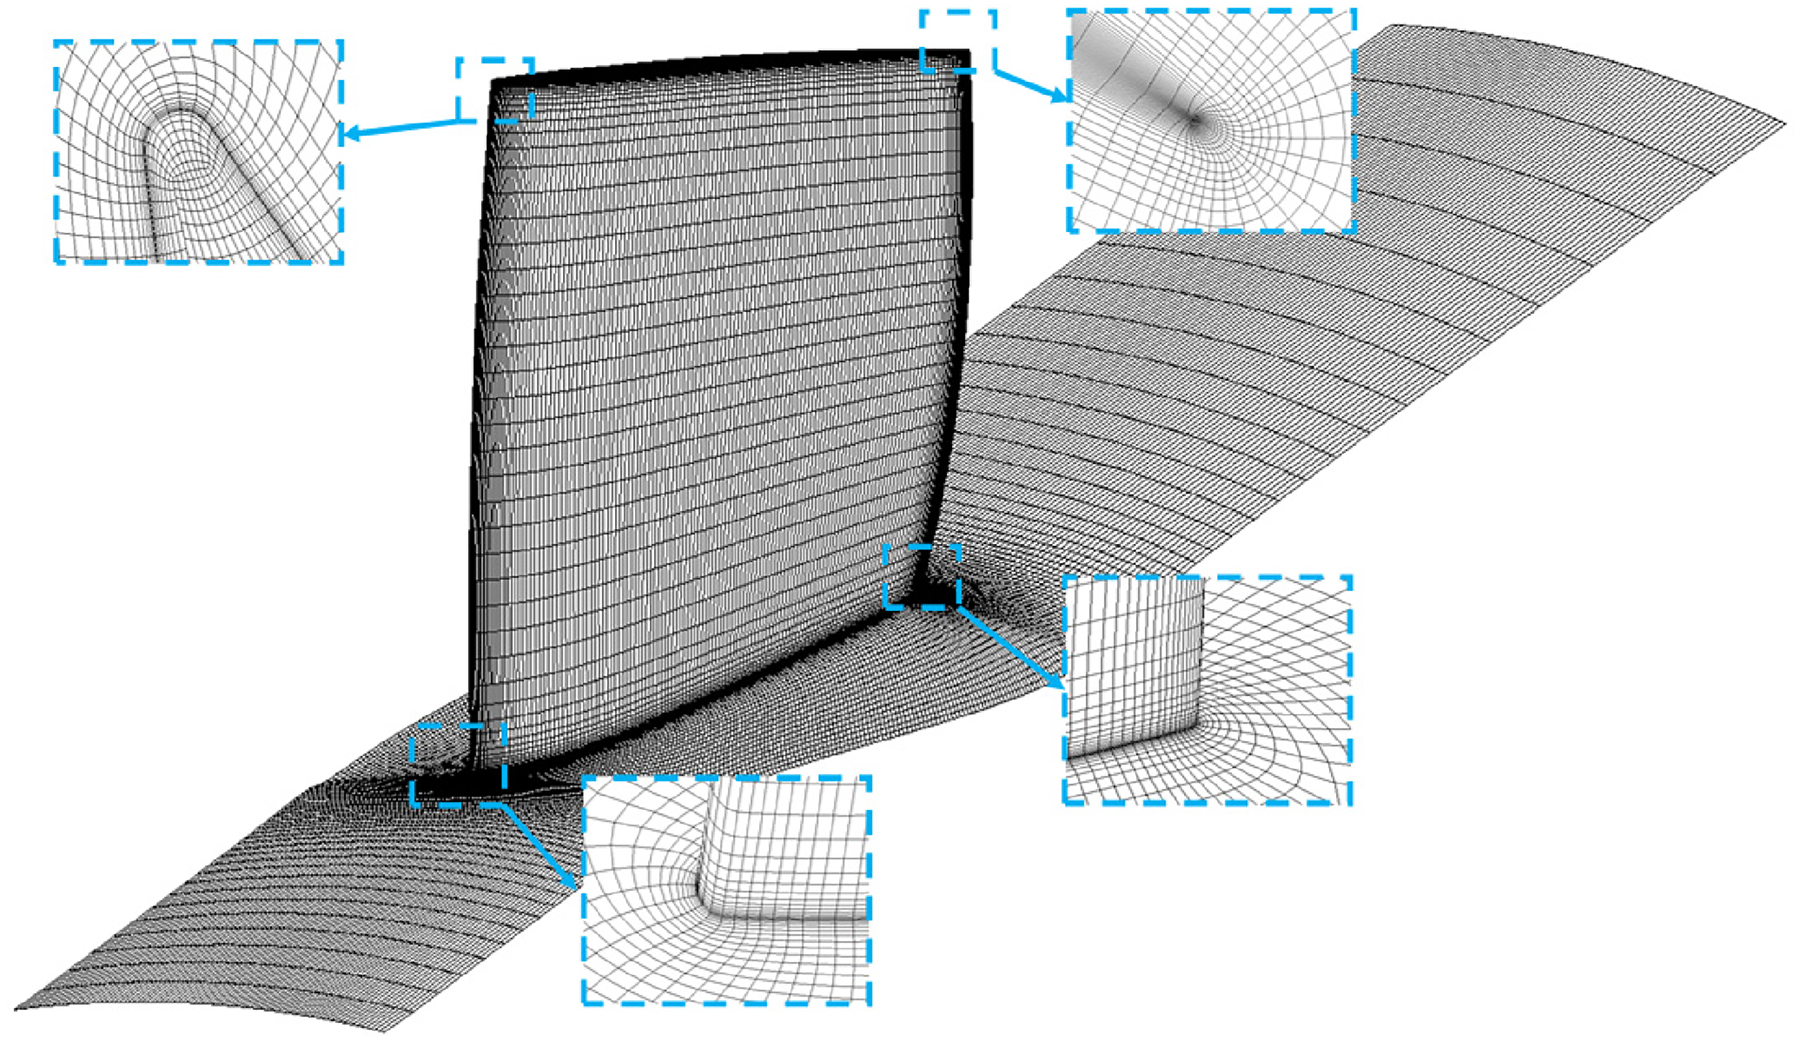
Computational mesh of the rotor.
Main design parameters of the rotor.

Numerical methods
The numerical simulations were implemented by means of a commercial software NUMECA to solve the steady Reynolds Averaged Navier-Stokes (RANS) equations. Because the working Reynolds number of the compact axial compressor studied in this paper exceeds that of conventional compressor applications, the numerical calculation method is not validated. In addition, under the Reynolds number, flow has transition. At present, there is no good theory or experience to predict the position of transition reliably and accurately. Therefore, this paper decides not to use any transition model. Kailash compared the prediction accuracy of SST, K-Epsilon and SA (Spalart-Allmaras) turbulence models for flows in low Reynolds number, the results showed that SA not only predicted flows more accurately, but also was more robust 1 In addition, When Dr Konstantinos 18 conducted experiments and numerical studies on the influence of low Reynolds number on the performance of a compact compressor, the SA turbulence model without transition model with wall function was used for numerical calculation, which showed a good predictive ability. The Spalart-Allmaras model without transition model is chosen in all simulations for turbulence closure with an advantage of high robustness and high accuracy for the prediction of complex flows.
An O4H-type structured grid was generated in the simulation and grid refinement was employed around the blade wall and the endwalls to ensure that the details of the boundary layer flow were captured exactly. The y+ of the blade wall and the endwalls was less than 5, which could meet the demands of the turbulence model. In addition, in order to ensure the stability of the calculation and the reliability of the calculation results, the inlet and outlet sections of the rotor are reasonably extended. The inlet section of the rotor is 1.5 times the chord length of the hub, and the outlet section is 3.5 times the chord length of the hub. The calculation domain includes the rotor flow passage, inlet section, outlet section and tip clearance.
The influence of the number of 0.362, 0.597, 1.297 and 1.72 million grids on the compressor performance was analyzed to determine the appropriate number of grids. The grids were evenly refined in three directions. Figure 3 shows the influence of different number of grids on the performance of the compressor rotor. It can be seen from the Fig. 3 that with the number of grids being refined, the performance curve gradually converges. The efficiency at different mesh numbers was shown in Fig. 3(c). It could be noted that a similar linear decrease in efficiency was presented after 1.279 million grid cells, the change rate of efficiency between 1.279 and 1.72 million grid cells was no more than 0.58%, and the change rate of efficiency between 0.597 and 1.72 million grid cells was 1.45%. In view of the steady variation trend and negligible variation value in efficiency after 1.279 million grid cells, and in order to ensure the accuracy of calculation and save calculation time, the topology of 1.279 million grids was used for subsequent calculation and research in this paper.
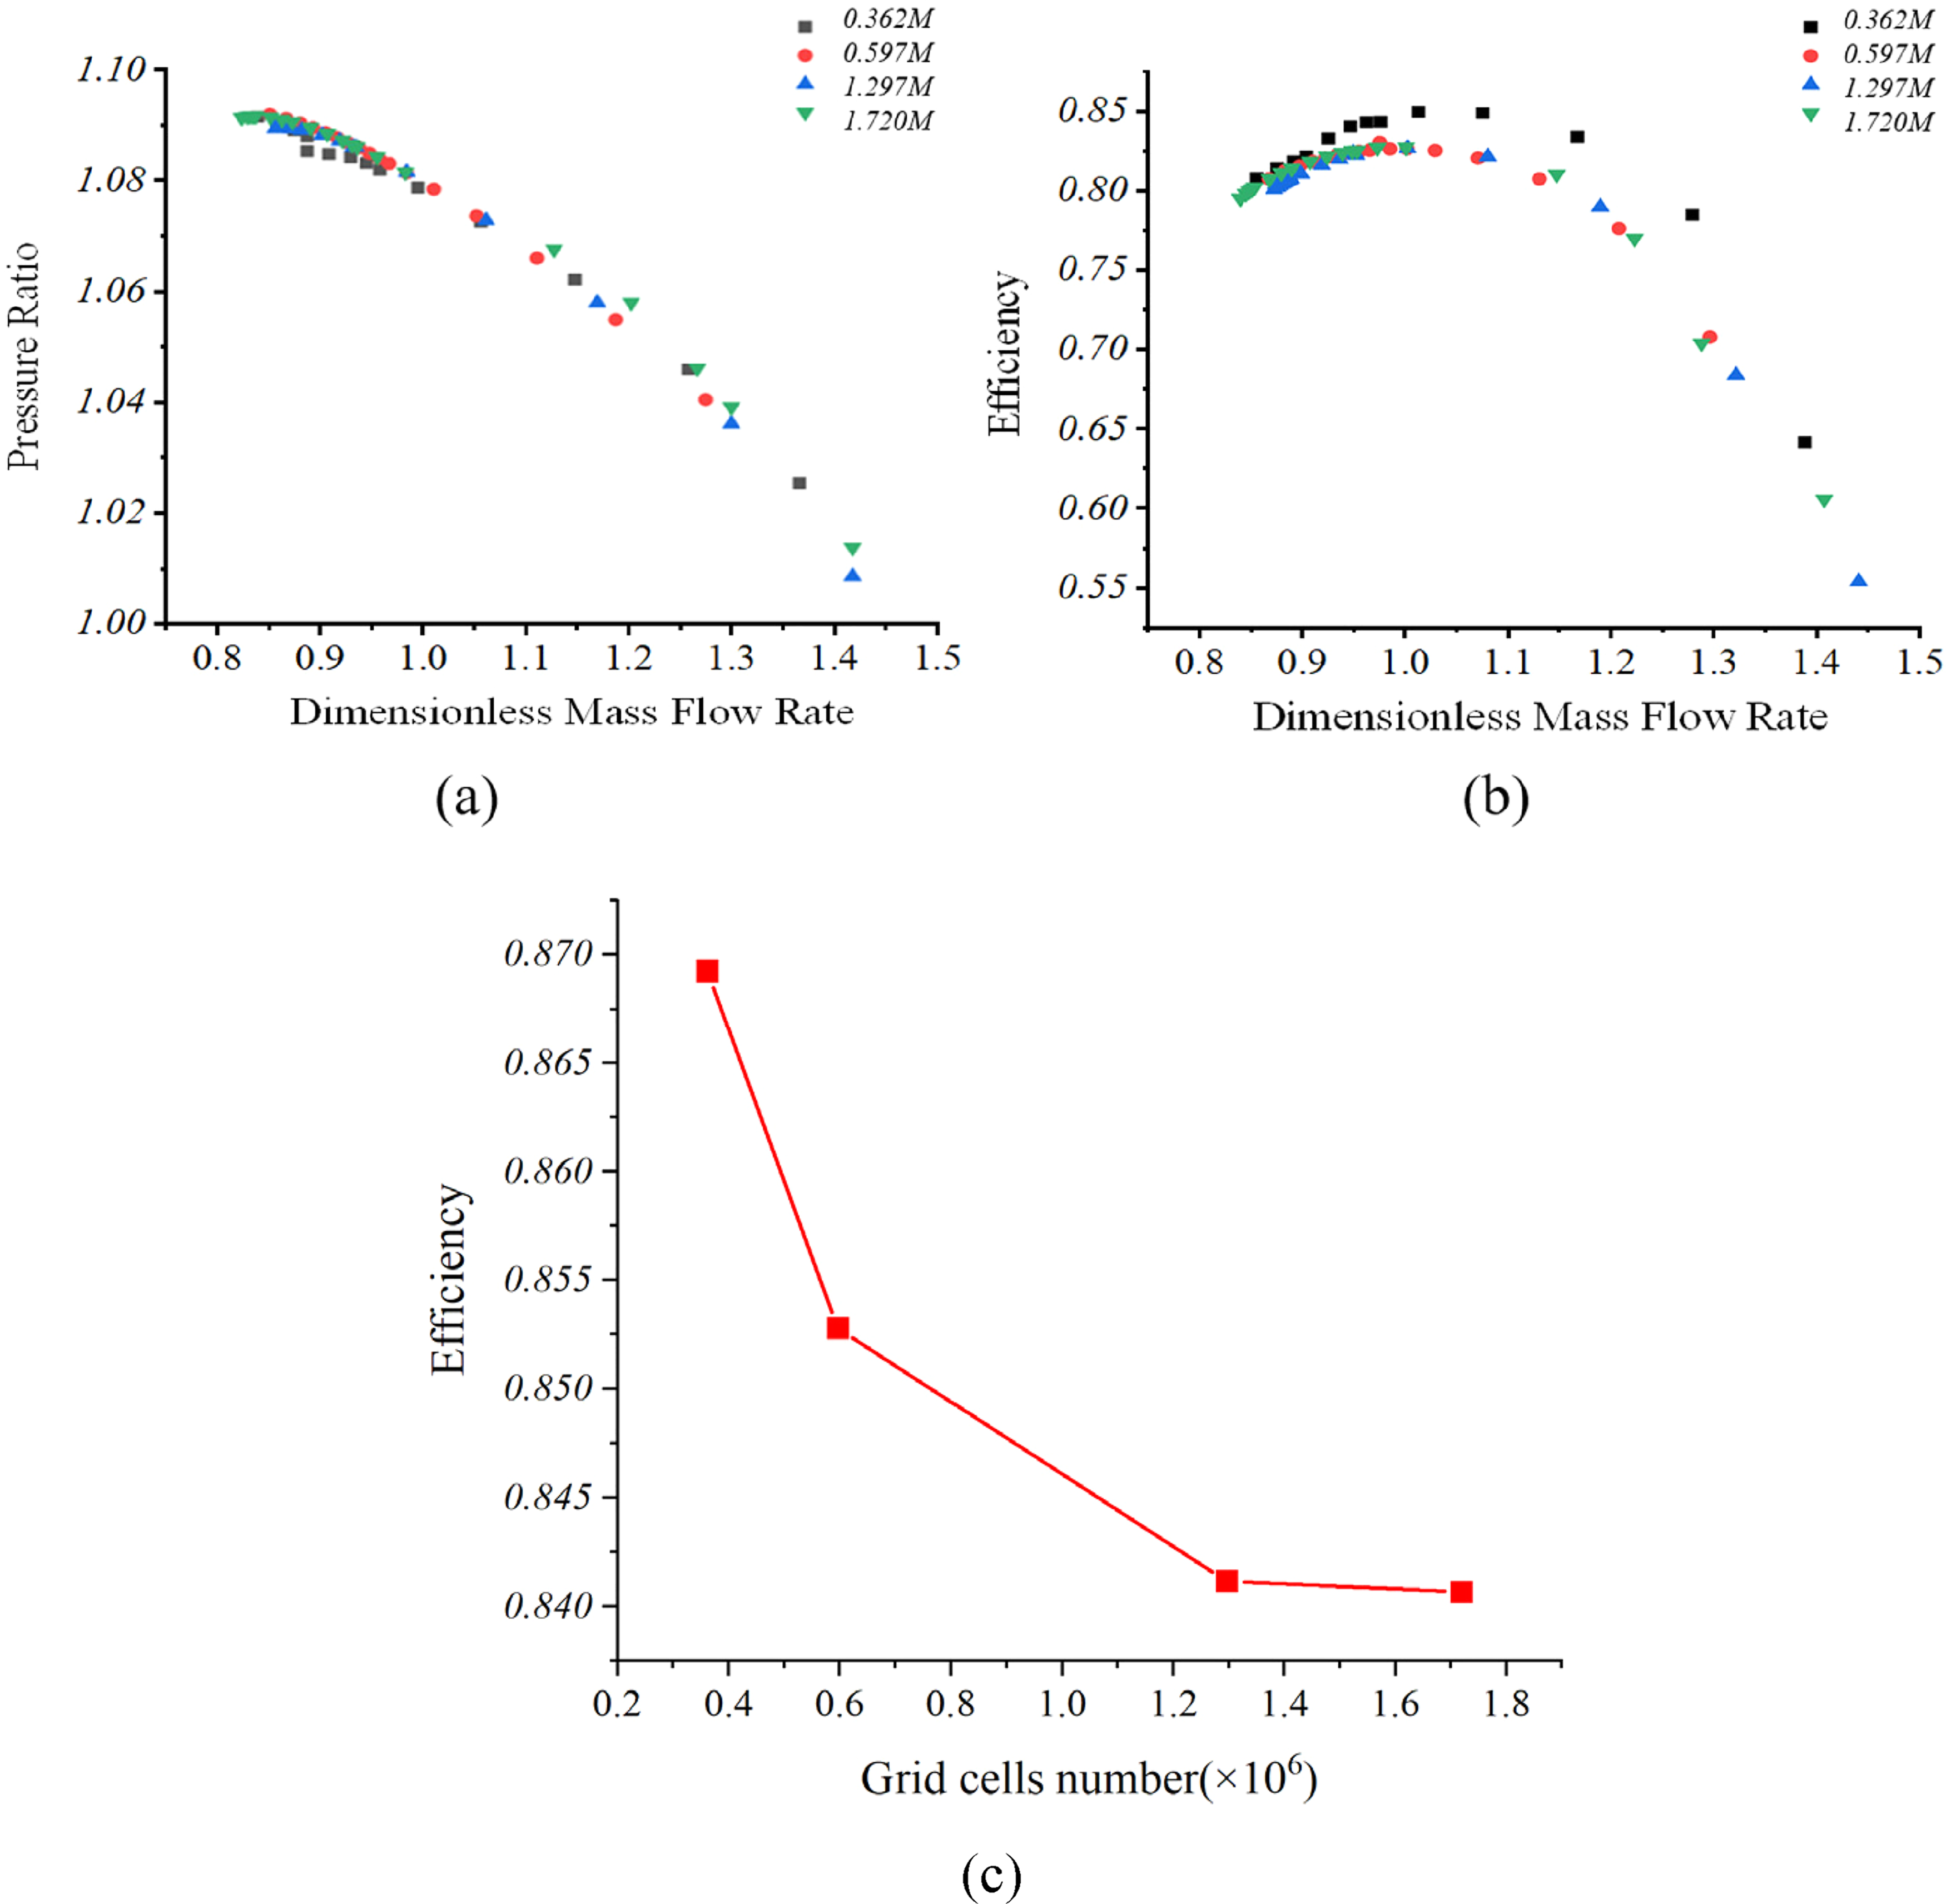
Influence of different mesh numbers on compressor rotor performance (a) pressure ratio varies with flow rate (b) efficiency varies with flow rate (c)the efficiency at different mesh numbers.
Sensitivity analysis of influence of different geometry on rotor performance
In order to reduce the subjectivity of the selection of optimal geometric variables and the requirement for computational resources and shorten the optimization time, sensitivity analysis is used to determine the geometries that have a great impact on the compressor performance before the uncertain optimization.
At present, variances decomposition method and OAT (one at a time, change one variable at a time while other variables remain unchanged) are commonly used in literature to judge the contribution of different geometries to compressor performance (sensitivity coefficient). Variance decomposition method is suitable for the nearly linear systems. The OAT method is easy to understand and simple to operate, however, for the problems with many variables, the workload is relatively large. In this paper, the weights product of Artificial Neural Network (ANN) was employed to rank the contribution of different geometry to compressor performance in term of the strong nonlinear mapping capability and less computations.
In this paper, the Backward Propagation Neural Network (BPNN) was used to train and learn the results of numerical calculation, and the sensitivity analysis of the model was carried out based on the product of the receiving weights. Figure 4 is the flow chart of the sensitivity analysis employed in this method.

Flow chart of sensitivity analysis.
Geometry parameterization
The geometric parameterization diagram is shown in Fig. 5. Fig. 5(a) is a parameterized schematic diagram of blade geometric Angle; Fig. 5(b) is a parameterized schematic diagram of the compressor casing and hub, which is parameterized by simple Bessel curves. Figure 5(c) is the parameterized diagram of the Bessel curve of the blade profile. There are three control points on the suction side and two on the pressure side; Fig. 5(d) is the parameterization diagram of blade stacking line. The stacking line adopts three-stage parameterization method, with simple Bessel curves at both ends and straight segments in the middle. In order to carry out high-precision parameterization of the blade, a total of 9 sections of the blade profile were parameterized and fitted.

Geometry parameterization of rotor (a) blade (b) hub casing (c) blade profile (d) blade stack line.
Database generation
The database is the basis of the establishment of the model. The generation of the database mainly includes the following three steps: the definition of the upper and lower limits of the studied variables, the selection of points in the design space, and the numerical calculation.
In a compressor of traditional size, blade thickness distribution, front and trailing edge radius, tip clearance and other factors have a great influence on the performance of the compressor. 19 In order to deeply study the influence of geometric dimension changes on its performance, this paper studies the influence of blade thickness distribution, front and trailing edge radius, wedge angle and tip clearance size changes on the performance of three sections of rotor blades, including root, middle and tip sections, involving 22 variables. Since the geometric dimensions of the rotor of the compressor in this paper are small, it is not easy to realize the small size changes in the actual production and manufacturing process. In addition, in order to better reflect the influence of the geometric dimensions of different parts on the performance of the compressor, a large range of ± 50% is selected for the selection of the upper and lower limits of each variable. The tip clearance varies from 40 um to 200 um. After the geometric parameterization of the compressor rotor and the definition of the upper and lower limits of geometric dimension changes are completed, design space sampling is required.
Design of Experiment (DoE) is an efficient test design and space sampling technology. In this study, we used Latin hypercube sampling (LHS) to perform DoE. LHS is a space filling technology, which divides the design space into areas with equal probability and generates pseudo-random points so that no two points are located in the same area, thus making the coverage of the design space more uniform. A total of 242 computational geometries were created using LHS in this study, without formal DoE convergence to obtain the appropriate sample number, which was chosen based on time and computational resource availability. Due to the grid was not suitable and the calculation did not converge, 221 effective numerical results were obtained in the end.
Training of BPNN
The BPNN used in this paper contains 22 neurons in the input layer, 10 neurons in the hidden layer and two neurons in the output layer. The topology of the neural network is shown in Fig. 6. The database is divided into training set, testing set and validation set. Each of them account for the 70%, 15% and 15% of the database respectively. Levenberg-Marquardt optimization method is used to find the optimal weight matrices to speed up the process of training the neural network. Mean square error is adopted as performance function, the maximum number of iterations is set to 1000. When the mean square error on the validation set increases six times in a row, the train will stop. Generally, a few seconds and 5 to 7 iterations, the training will converge.

Topology of BPNN.
Sensitivity analysis
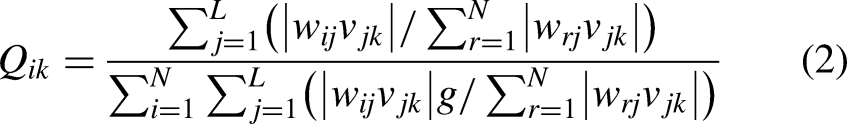
The neural network can obtain the numerical relationship between the output variables and the input variables and the connection weight between the neurons by training. The connection weight can indicate the sensitivity of the output variable to the input variable to some extent. This paper will use the connection weight method for sensitivity analysis, in which Grason algorithm is a representative of this kind of analysis method.20, 21 The product of connection weights is used to calculate the degree of influence or relative contribution of input variables to output variables. See the formula (1) for the specific definition.

Since the values of connection weights
Because the sensitivity analysis is based on the neural network, the result is closely related to the initial samples and iteration path, and each time the database is randomly divided into training set, validation set and test set, so the analysis results will appear certain differences. But after a lot of training of the neural network, the correlation coefficient R of the predicted values and the target value, whether in the training set, testing set and validation set all remain more than 99.99%, so the BPNN can well predict the performance of compressor rotor.
Figures 7 and 8 show the four different sensitivity analysis results, from which it can be seen the effect of tip clearance on the compressor efficiency and pressure ratio is always most significant, its relative contribution to the efficiency fluctuates between 9.43% and 12.30%, and the pressure ratio varies from 8.05% to 12.30%, that is far higher than other factors which affect the rotor performance. It shows the rotor tip clearance is the geometry which influence the rotor performance most significantly. However, due to the analysis results is not constant but varies slightly, so this method cannot give a deterministic quantitative evaluation result. Therefore, eliminating the difference of the analysis results to give a deterministic quantitative evaluation result is necessary.
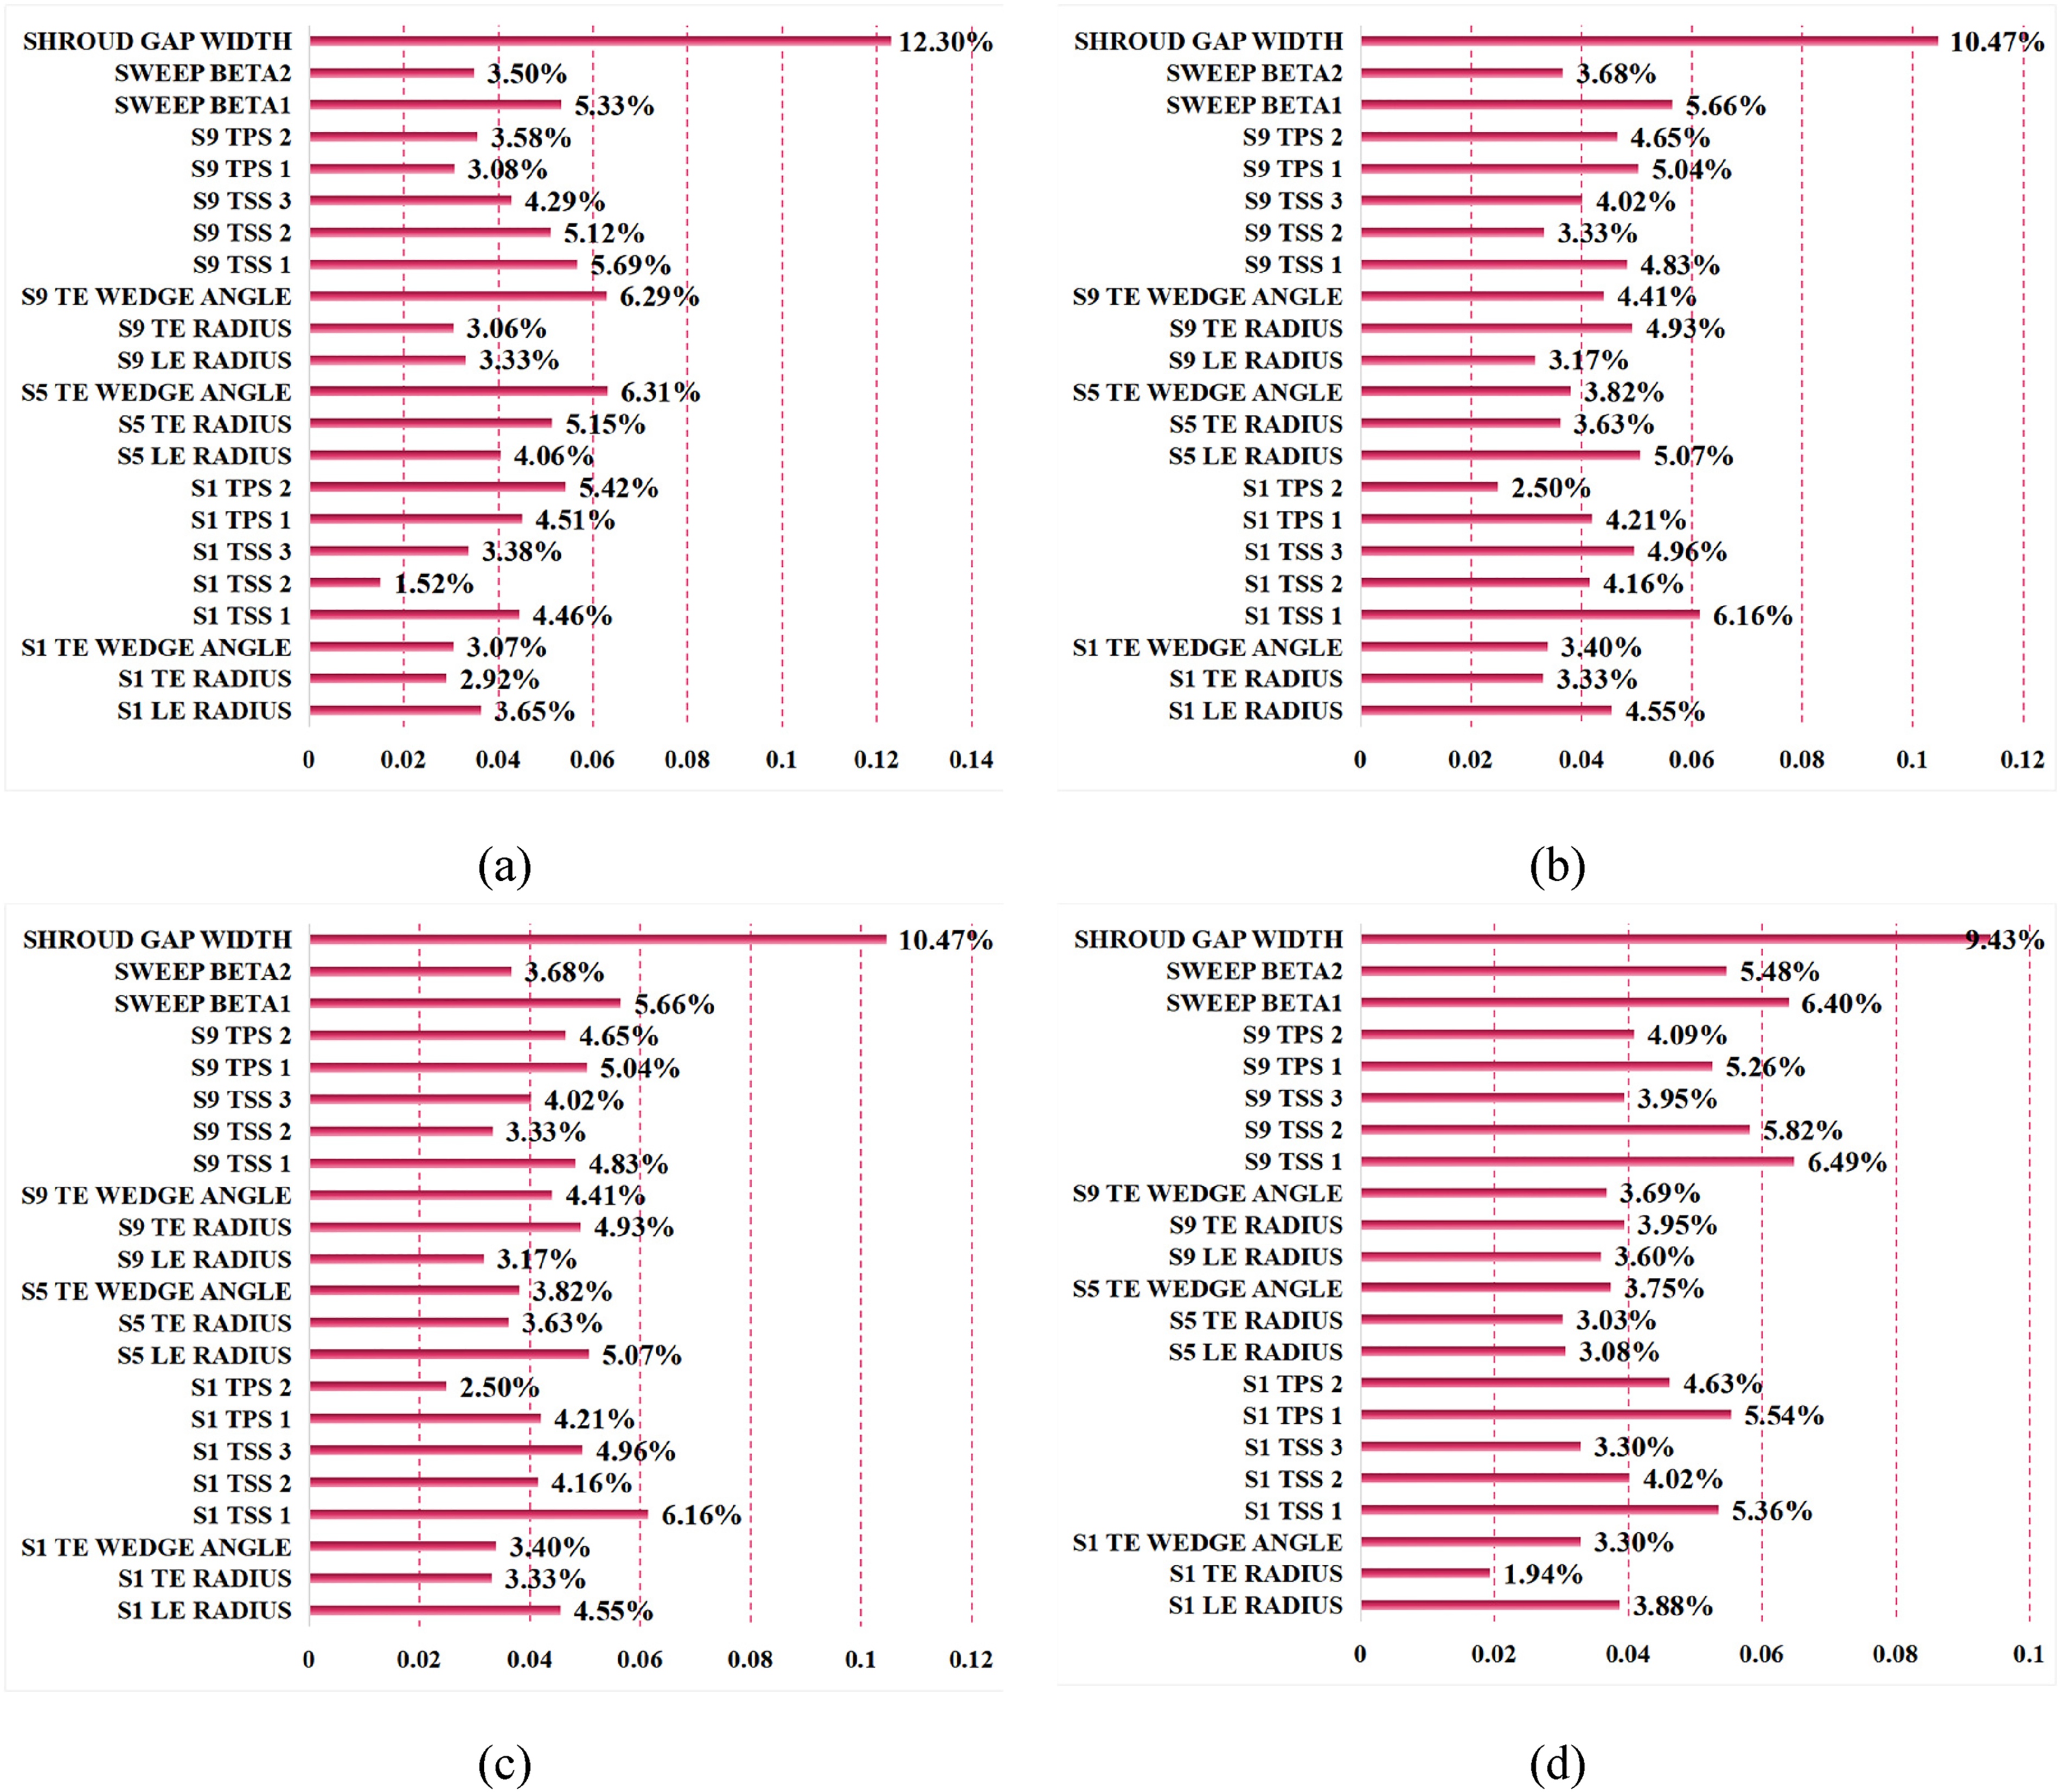
Comparison of efficiency sensitivity analysis results.
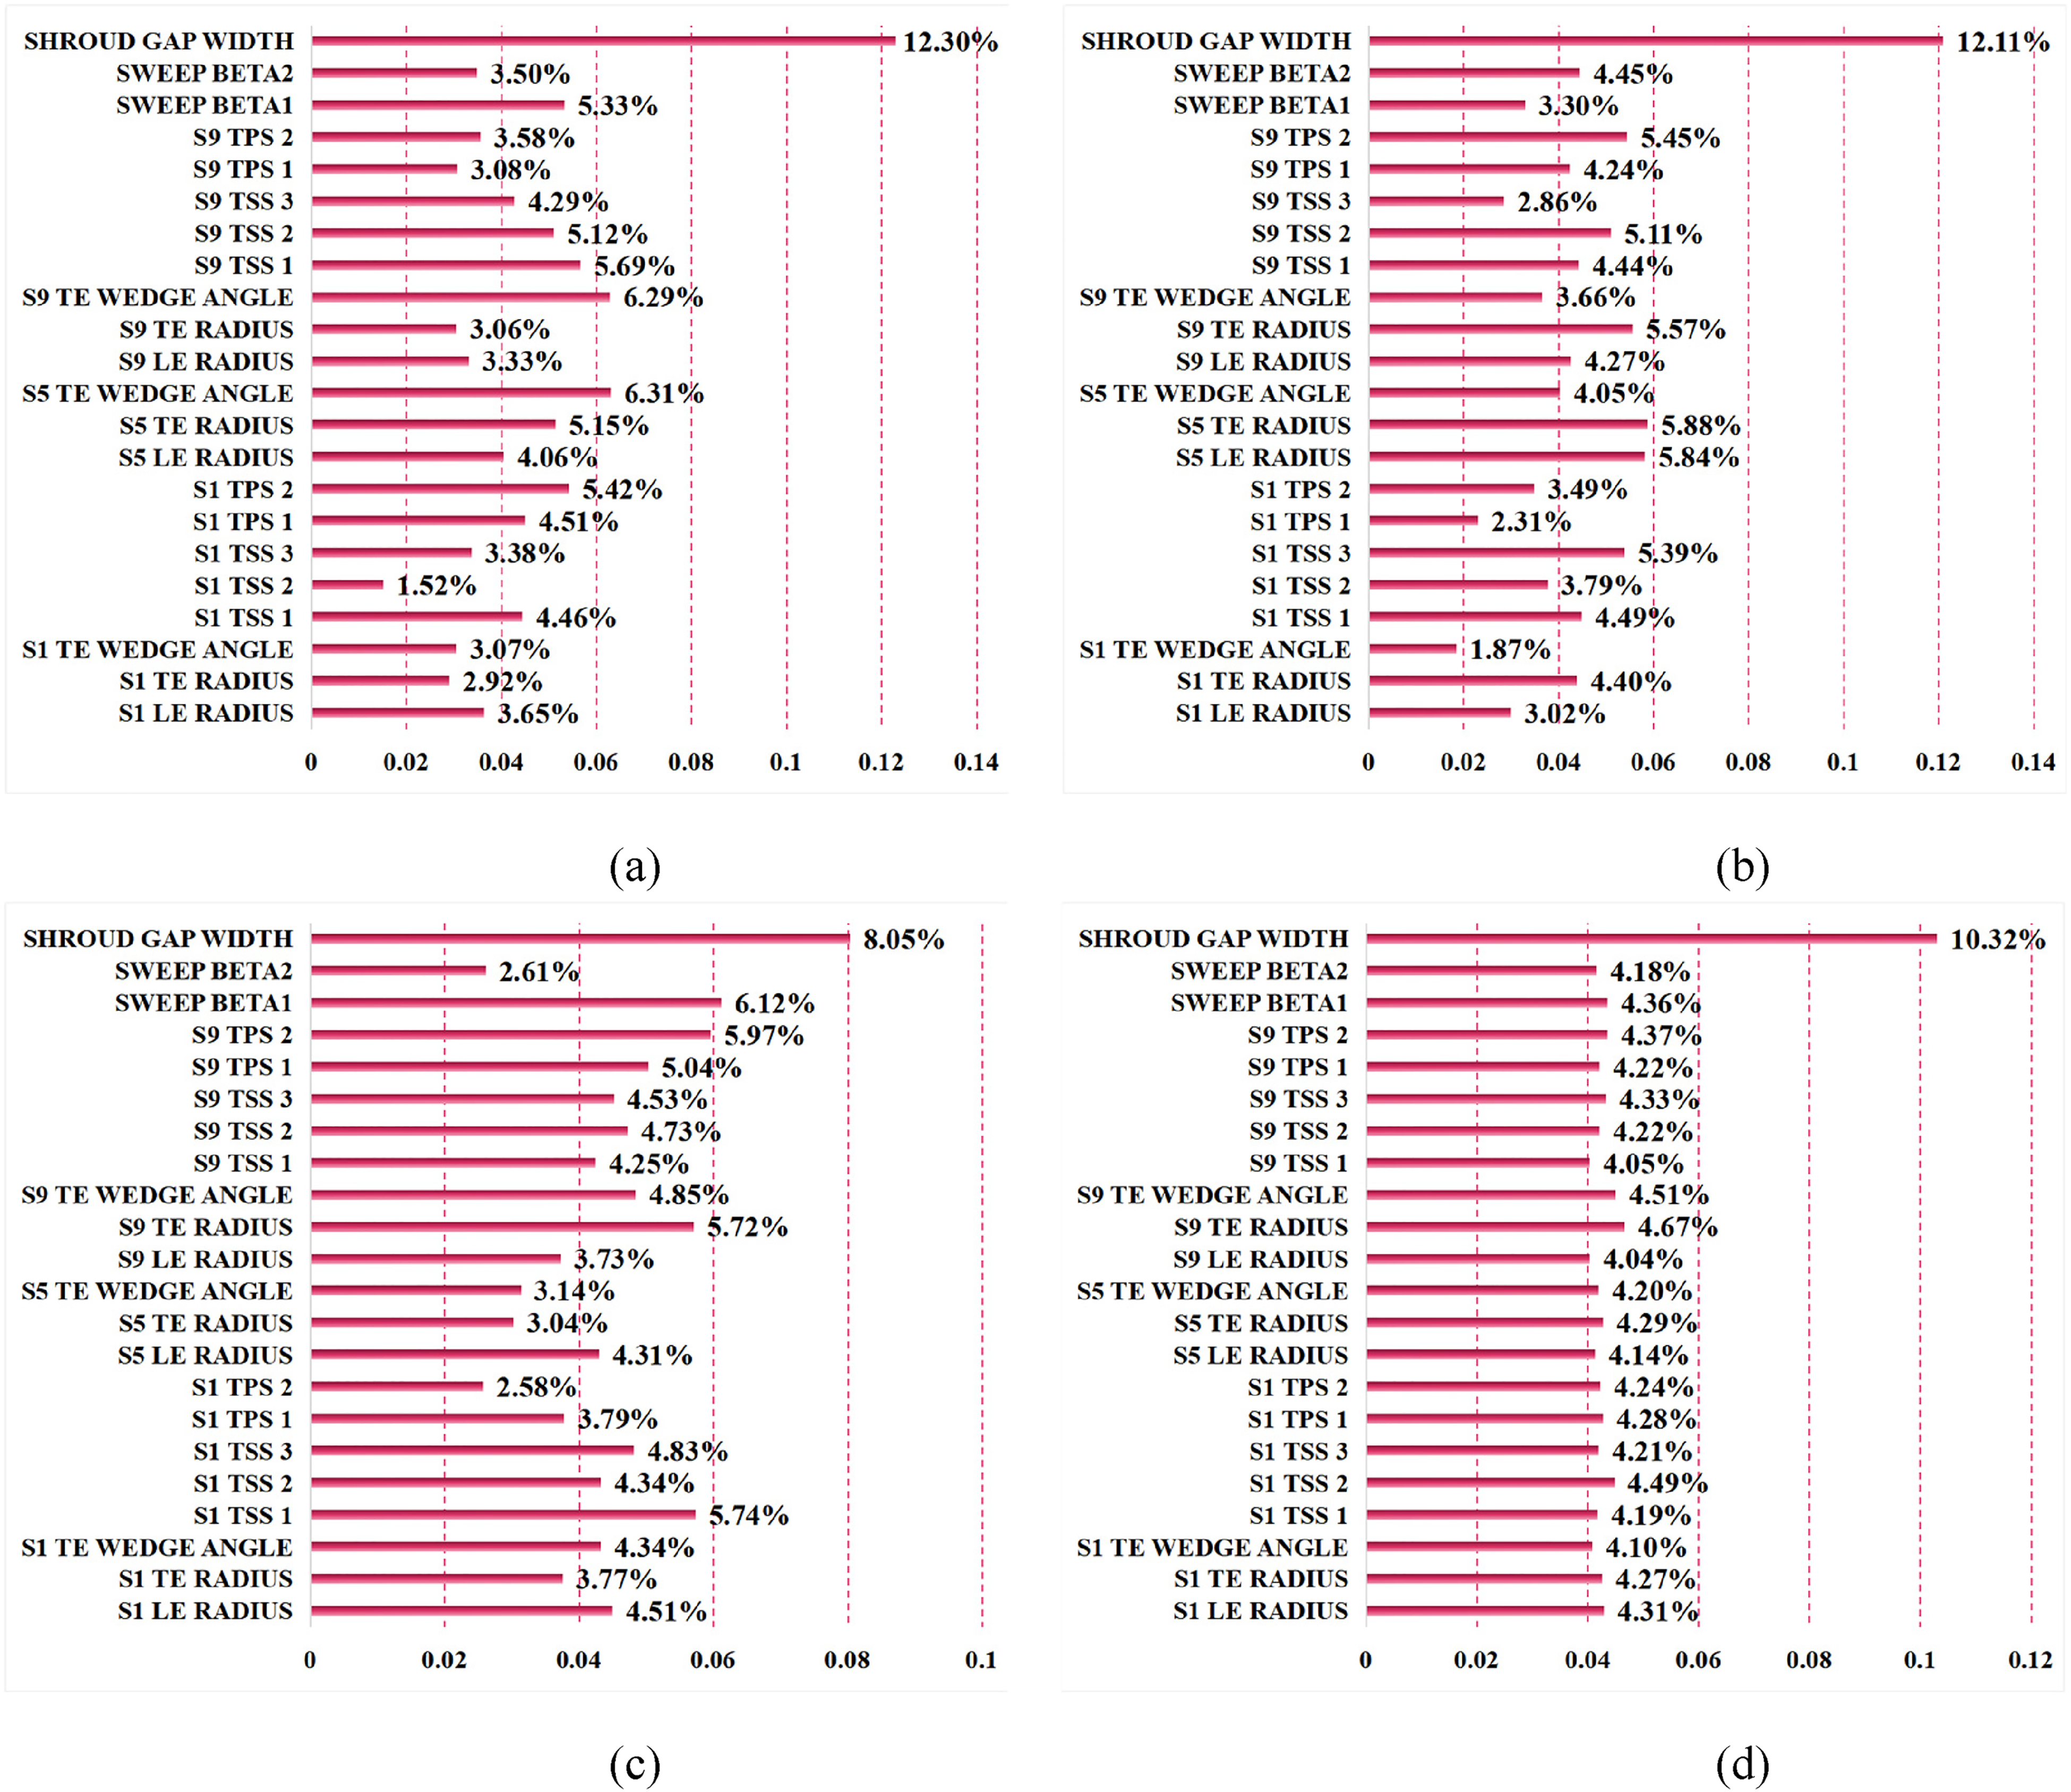
Comparison of pressure ratio sensitivity analysis results.
This paper adopts the method of mean value calculation to eliminate the difference of each analysis result and obtain a unified analysis result. The specific method is as follows:
(1) Randomly divide the database into training set, test set and validation set according to a ratio of 7:1.5:1.5 and conduct network training; (2) Sensitivity analysis is conducted using Grason algorithm to obtain the relative contribution of different geometries to compressor performance; (3) Repeat steps (1) and (2) 1000 times; (4) calculate the mean value of the analysis results.
Figure 9 shows the results of mean sensitivity analysis results of compressor rotors. Figure 9(a) shows the sensitivity analysis results of the mean efficiency of the compressor rotor. The contribution of blade tip clearance to the fluctuation of the compressor rotor efficiency reaches 11.43%, while other geometric parameters are basically around 4%.

Analysis of mean sensitivity of compressor rotor (a) average sensitivity analysis of compressor rotor efficiency (b) average sensitivity analysis of compressor rotor pressure ratio.
Figure 9(b) shows the sensitivity analysis results of the mean pressure ratio of the compressor rotor. The relative contribution of blade tip clearance to the change of the pressure ratio of the compressor rotor is 10.18%. The relative contribution of other geometric parameters is also about 4%. Therefore, tip clearance is the leading factor that has the greatest influence on the performance of compressor rotor.
Robust optimization
Robust optimization mainly includes the following steps: geometric parameterization, database generation, agent model construction, uncertainty propagation in CFD, multi-objective optimization. Different from the traditional deterministic optimization method which only pursues the optimal performance, the objective function of robust optimization not only involves the improvement of performance, but also requires the compressor to enhance the anti-interference ability or reduce the variance of performance fluctuation. Therefore, robust optimization is essentially a multi-objective optimization problem.
For multi-objective optimization, the traditional method is to use the weight function to transform the multi-objective optimization problem into the single-objective optimization problem. However, in most cases, it is difficult to set the appropriate weight for multiple types of objectives and for designers, there is no alternative except the final optimal scheme. At present, many new multi-objective optimization algorithms based on pareto optimality are proposed, which produce non-inferior solutions rather than optimal solutions. These solution sets are called Pareto frontiers or Pareto optimal solution sets. Each solution in the Pareto front represents certain degree of compromise between different objectives.
Many traditional optimization algorithms have been extended to multi-objective optimization. Some multi-objective genetic algorithms (MOGAS) have been proposed and successfully applied to multiple fields. However, in practical engineering applications, a significant shortcoming of multi-objective genetic algorithm is that it requires expensive computing resources, especially CFD simulation for aerodynamic performance optimization. A more practical solution is to use less individual and iterative algebra. Small population may lead to sparse pareto front while fewer iteration will increase the risk of incomplete convergence. An effective way is to use agent model for performance prediction instead of high fidelity CFD simulation. Agent model not only can reduce the computational burden of the optimization process and can also according to agent model to analyze the sensitivity of output to input.
Before the agent model is established for optimization and sensitivity analysis, the user needs to generate a set of sample points and perform CFD simulation to generate database. Then the analytical relationship between the input and output is constructed based on the database. In order to make the database contain more information, reduce the experimental quantity and ensure the accuracy of the agent model, many DoE methods have been proposed. Reasonable design of experiment plays a very important role in reducing calculation consumption and model accuracy. Figure 10 is the robust optimization framework adopted in this paper.

The robust optimization framework.
Due to the geometric parameters in the compressor design, is numerous, if for every several parameters in robust optimization, no matter from the point of view of time and cost, are not wise and economic choice, selected on the compressor performance influence of geometric parameters optimization is a kind of economic, effective and feasible method. The sensitivity analysis results in Section 3 show that the influence of tip clearance on the compressor performance has a major position. The overall performance of the compressor is more sensitive to the change of the blade tip clearance. Therefore, this paper mainly studies how to reduce the sensitivity of the tip clearance, hoping to achieve better robust optimization effect through robust optimization with the least geometric variables under the condition of permitting computation time and computation resources.
Geometrical parameterization, database generation and agent model construction
The geometric parameterization and database generation adopted the same method as in Section 3, and the change of tip clearance was realized by changing the blade height. When generating the database, the LHS was used as the DoE to generate the database and 31 sampling points were produced. A good agent model can predict the outputs accurately and reliably as well as improve the confidence level of the optimization results. At present, many agent models have been proposed and applied successfully.
Jun et al. 7 studied the characteristics of three agent models of RSM, ANN and Kriging. The strength and weakness of those models were compared through three aspects which include rapid response, nonlinear mapping capability and model generation efficiency. By comparison, ANN performs better in the three aspects than the other two methods. In addition, Wunsch et al. 3 successfully studied the compound uncertainty quantification of compressor operation and the geometric by using the agent model established by ANN. Wang et al. 4 used ANN to construct the model and successfully carried out robust aerodynamic optimization of rotor blades, which not only improved rotor aerodynamic performance but also reduced the sensitivity of compressor rotor to fluctuation in the working environment. In view of the excellent performance of BPNN in the sensitivity analysis of rotor performance prediction in Section 3, in this paper, forward propagation neural network (BPNN) was also used to construct the agent model.
The BPNN with 10 neurons in hidden layer and 2 neurons in output layer was trained base on the database to predict the performance of the compressor and The BPNN was coupled with the multi-objective optimization algorithm to conduct the robust optimization. Momentum factor and learning rate were 0.8 and 0.5. The maximum number of iterations was set to 10 and after every iteration, two candidates were selected to perform CFD simulation and added into the database, then the agent model would update based on the new database. With the number of the samples in database increases, the accuracy of agent model will also improve.
Definition of uncertainty and uncertainty quantification
The probability density function of the manufacturing uncertainty has an important influence on the quantification of the uncertainty. In this paper, Beta probability distribution function is used to characterize the random distribution of manufacturing uncertainty. The manufacturing uncertainty is set to 20 um. The deterministic calculation amount of different quadrature rules is shown in Table 2. It can be seen from the table that the calculation amount of Full Tensorization (FT) method is much higher than that of the other two methods. Under level 2, Sparse Linear Growth (LG) and Sparse Exponential Growth (EG) have the same calculation amount. When it exceeds level 2, EG begins to surpass LG method and with the increase of level, the gap between them gradually increases. In addition, when level 3 is reached, if 10 uncertainties are studied at the same time, the calculation amount of FT certainty will reach 5. 10
The number of points corresponding to the different quadrature rules.

For the study of a single uncertainty, there is no great difference in the calculation amount of the three methods in the level 2. In this paper the Level 2 LG method is adopted to definite the uncertainty and the weight of collocation points can be seen in Table 3.
The weight of collocation point.

This paper adopts the NIPC, this method does not need to change the existing solver, and can ensure the accuracy of calculation while reducing the number of deterministic calculations. Wang 17 adopted the Monte Carlo algorithm to carry out the geometric uncertainties of the NASA Rotor37 and verify the accuracy of NIPC, the results showed that the accuracy of level 2 of NIPC with 5 CFD calculations can match up with 512 CFD calculations results using Monte Carlo method. The NIPC could greatly reduce the calculation amount.
Multi-objective optimization
Multi-objective optimization algorithm
Robust optimization is a multi-objective optimization problem and genetic algorithm has a good multi-objective optimization ability. NSGA II is one of the most popular multi-objective genetic algorithms at present, which has the advantages of fast running speed and good convergence of solution set and becomes the benchmark of performance of other multi-objective optimization algorithms. The multi-objective optimization problem is generally described as follows: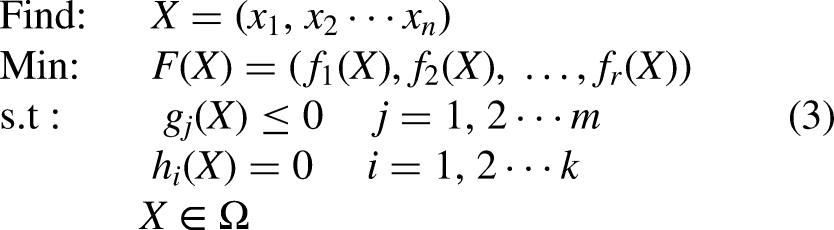
The description of feasible space can be expressed as follows:
The settings of optimization parameter
The goal of robust optimization is to improve the efficiency and pressure ratio of compressor rotor as well as reduce the fluctuation of the performance due to the manufacturing uncertainty which will led to the change of the width of tip clearance, therefor, the problem investigated is an optimization of four objectives. The NUMECA FINE/Design3D was adopted to carry out the multi-goal optimization and the objective function was defined as follows:
NSGA II was used to perform the optimization, which reduced the complexity of non-inferior sorting genetic algorithm and had the strength of high running speed and good convergence. The initial number of populations was set to 50 and the cycles of reproduction was set to 25. Two geometric solutions were selected to perform CFD simulation to validate the agent model and used to reconstruct the new agent model.
The convergence criterion of multi-objective optimization
To evaluate the result of multi-objective optimization and whether the iteration converges, there are three criterions for judging the results of multi-objective optimization.
Nondominant criterion: The nondominant criterion measures the existence of suboptimal design in the population and the variation range of the criterion is [0, 1]. The last population of the optimizer should contain only nondominant samples and the value of the nondominant criterion should be 0 at this time, while the value of the first population may be 1. If the final optimization result is not close to 0, then the final optimization is likely to fail. The criterion is defined as follows: Where P is the population, Distance criterion: Distance criterion is defined as the average distance between the total sample and the origin of the target space relative to the worst sample and the variation range of this criterion is [0,1]. When all samples are at the same order of magnitude, the criterion converges with a small error. In the case of similar target scales, the criterion should be close to 1.0. A low value of the distance criterion may mean that the target has a different order of magnitude or that the optimizer does not converge to the Pareto frontier. If not close to uniformity, the standard values shld remain stable at the end of the run. The distance criterion is defined in formula equation (7).


(3) Space criterion: Space criterion shows the capability that the optimizer collects the nondominant samples, if the final population contained only the nondominant samples, those samples should distribute evenly in the target space. The space criterion is defined as follows:

The variation range of this criterion is also [0,1], if the final population have the perfect distribution, this criterion should be 0, if the results was desirable, S(P) should be a smaller value.
The analysis of the optimization result
Figure 11 presents the last distribution of distance criterion and space criterion for the final iteration of the robust optimization. This paper argued that when space criterion was less than 0.05 and the distance criterion was greater than 0.9, the optimization would converge. It can be seen from the Fig. 11(a), the distance criterion is greater than 0.92 and the space criterion is less than 0.04, in addition the nondominant criterion is close to 0, so this paper argued that the robust optimization converged.

the last distribution of distance criterion and space criterion.
It should be noted that because it is difficult to get the real Pareto front, this paper takes the result of the last iteration as the reference value to select the appropriate Pareto optimal solution as the final solution.
Figure 12 presents the final optimization results of the efficiency, pressure ratio and variance of the efficiency and pressure ratio. It shows that the efficiency and pressure ratio decrease with the increase of the tip gap while the variance of both fluctuates with the increase of tip gap and shows no obvious positive correlation or negative correlation. The variance of pressure ratio is far less than the variance of efficiency, which means that the pressure ratio is not so sensitive to geometric changes as the efficiency to geometry variation.
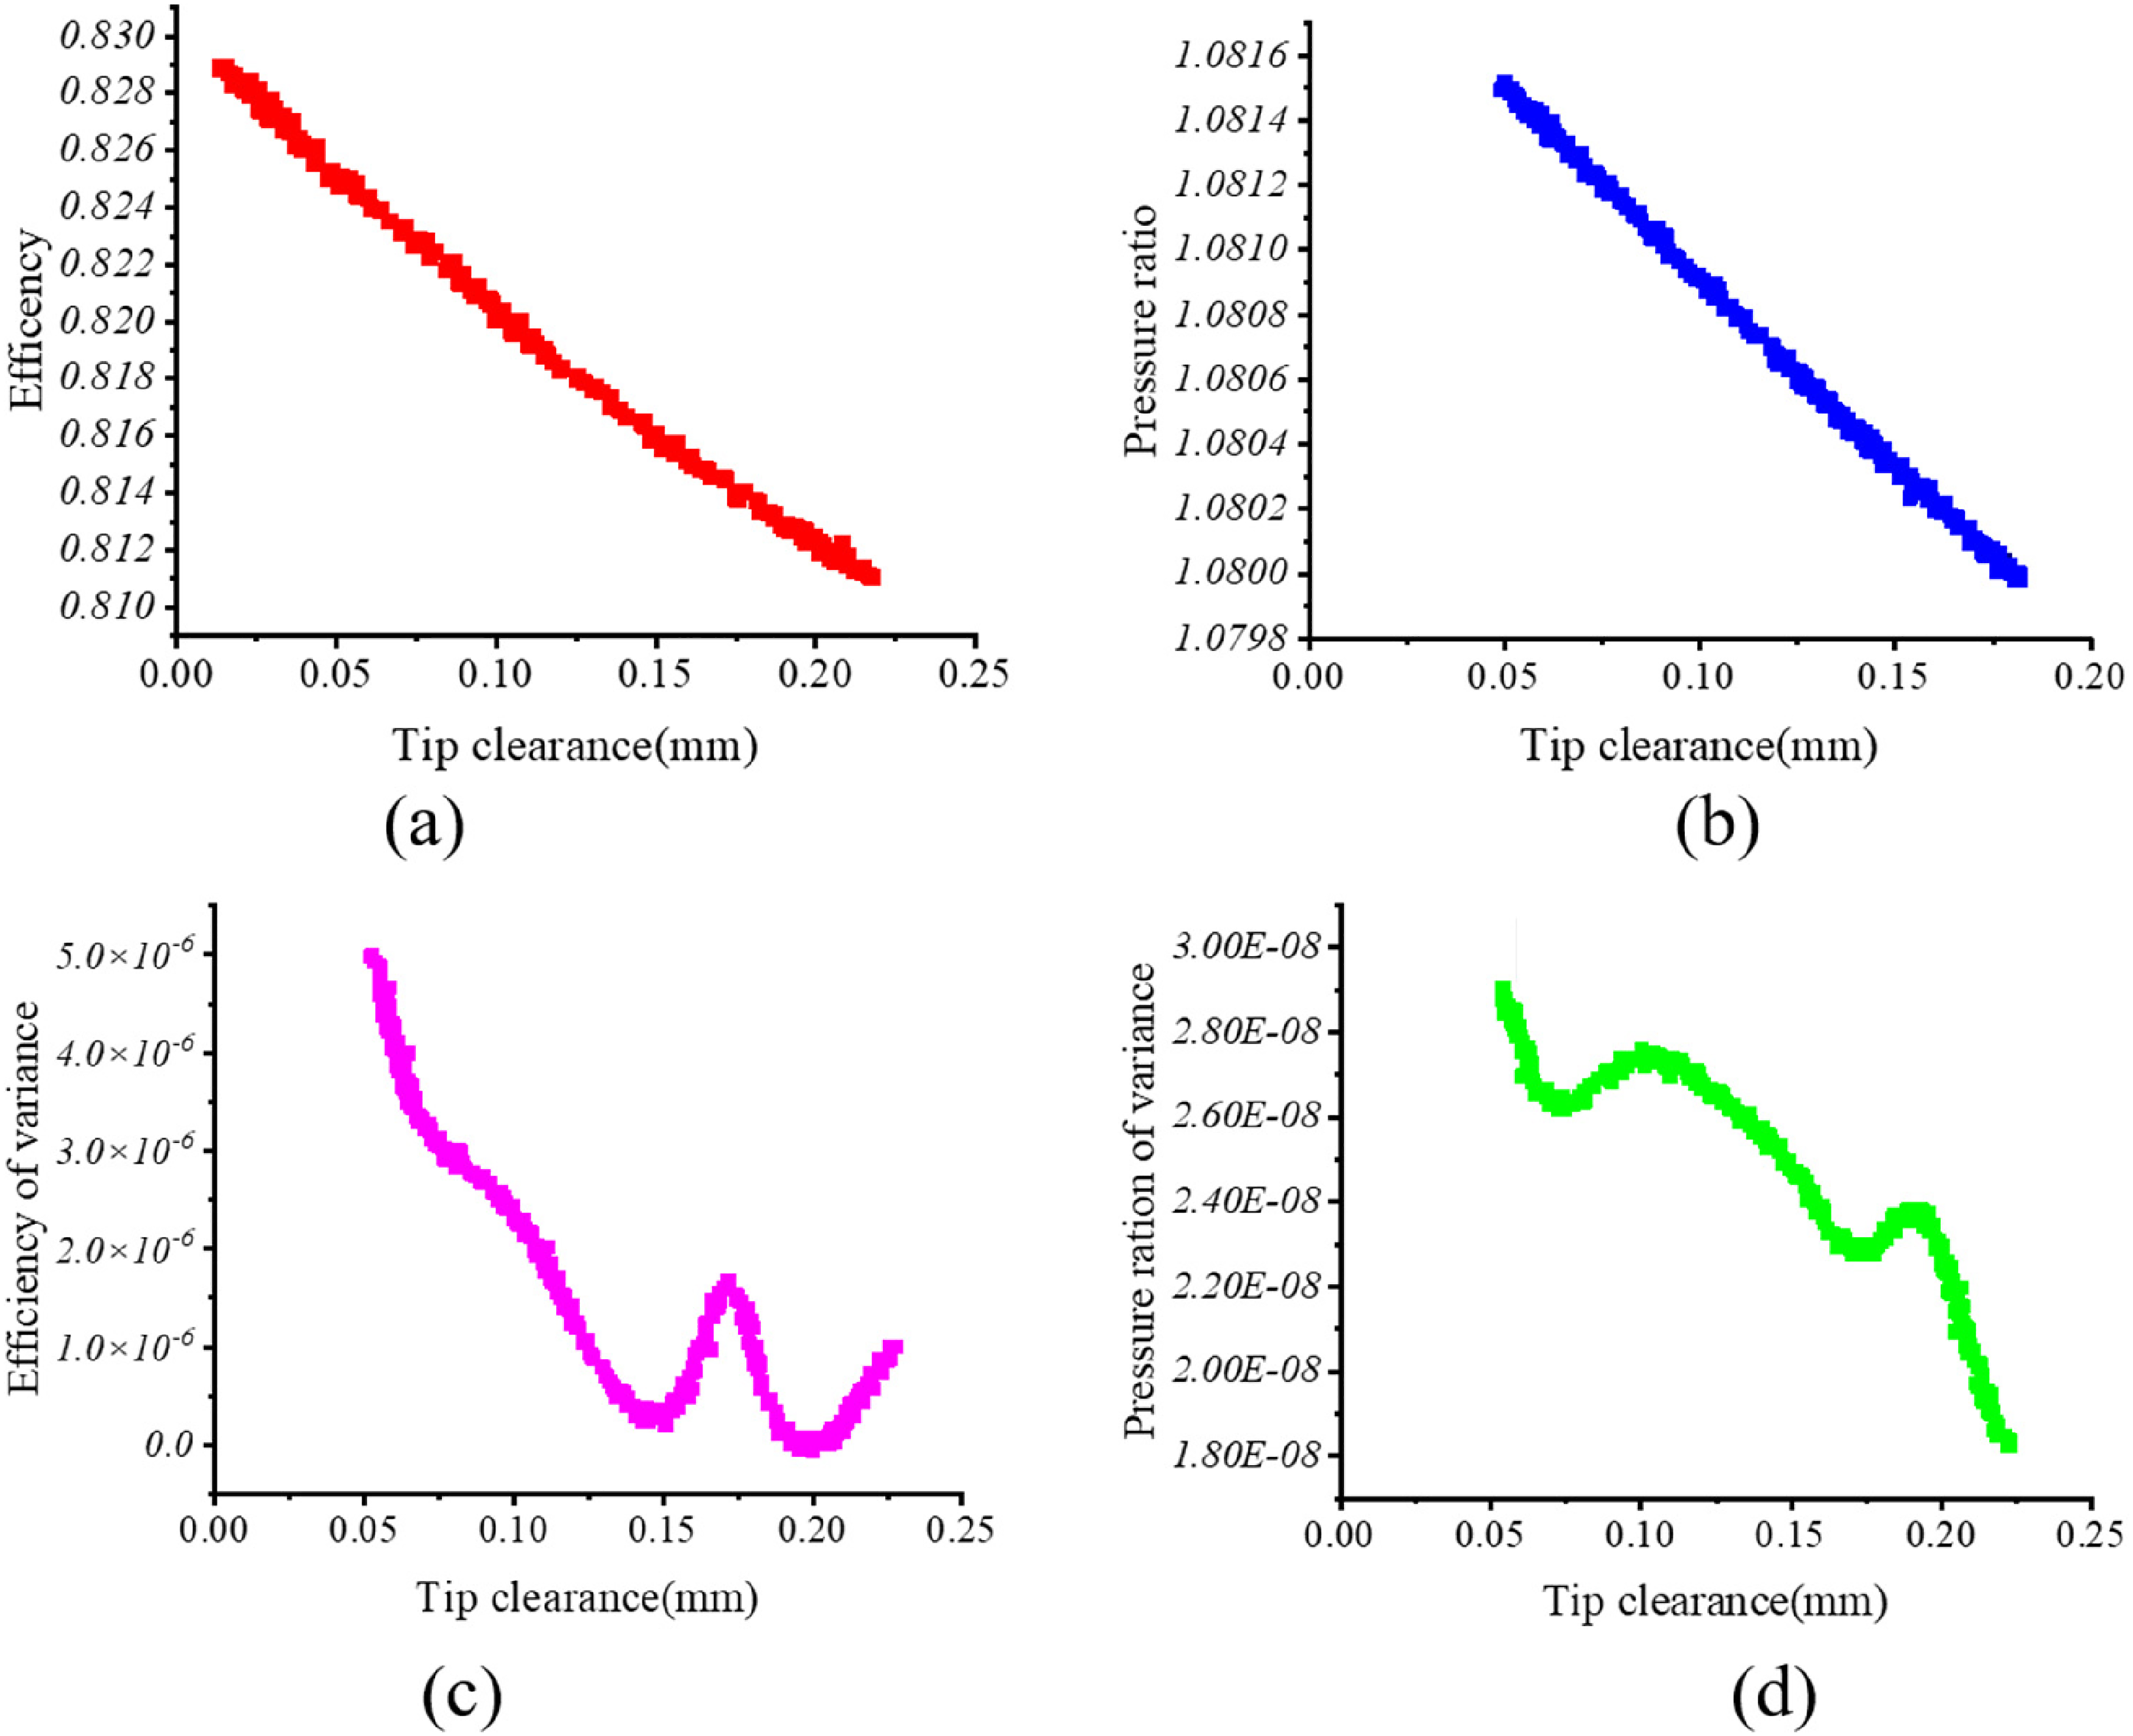
The distribution of Pareto's non-dominated solutions.
Finally, the case with the tip clearance of 94 um is chosen, whose mean efficiency and pressure ration are 82.245% and 1.08096. The mean efficiency of the design prototype is 82.7% and the mean pressure ratio is 1.08153. Compared with the prototype while the efficiency and pressure ratio slightly decrease while the variance of the efficiency decreases by 21.04%.
To some extent, the robust optimization reduces the sensitivity of the rotor efficiency to geometric changes and improves its robustness.
Conclusion
In this study, the sensitivity analysis based on the connect weight product of neural network was employed to rank the contribution of different geometric changes which led to the variation of the compressor rotor performance. The trained BPNN can predict the performance of the compressor accurately. The correlation coefficient R between the object performance and predicted value can be over 99.99%, which also means the agent model could predict the 99.99% performance of the rotor. The contribution ranking algorithm is employed and the weight matrices of the BPNN is used to calculate the contribution of the various geometries. The averaged analysis result shows that the tip clearance contributes 11.43% (efficiency sensitivity analysis) and 10.18% (pressure ratio sensitivity analysis) to compressor performance changes, while blade thickness distribution, leading and trailing edge radius and other single geometrical factors contribute about 4%, far less than the influence of tip clearance on compressor performance. Therefore, tip clearance was selected as the main geometric variable to carry out the robust optimization. The NIPC method coupled with the NSGA II was used to perform the robust optimization and the results showed that when the tip gap was taken as 94um, the variance of the efficiency could be decreased by 21.04%. Although the efficiency and pressure ratio of the rotor of the compressor are slightly reduced, the case basically meets the performance requirements of the compressor. The following conclusions, some design guidelines and recommendations for a compact axial compressor can be summarized:
The neural network connection weight product sensitivity analysis method not only has the advantage of less computation, but also is more suitable for nonlinear systems than variance decomposition. The analysis results show that the rotor of compact axial compressor is the most sensitive to the tip clearance, which is far beyond the influence of other geometries on the compressor performance. Before the implementation of optimization, sensitivity analysis can not only reduce the subjectivity and arbitrariness of the selection of optimization variables, but also reduce the dimension of optimization and greatly reduce the calculation amount and calculation time of optimization. For compact axial flow compressor, in a certain range, the performance of compressor rotor with the decrease of the tip clearance increases, but the height of the tip clearance variance has no corresponding relationship with the performance. If only tip clearance is selected for optimization, it is difficult to ensure optimal performance and robustness at the same time, in this paper, the compromise was made between optimal performance and robustness. Under the condition that the performance was slightly reduced and the requirements of the design goals could be guaranteed, the design case with tip clearance of 94 um was selected finally.
Footnotes
Acknowledgements
This work is supported by the National Natural Science Foundation of China (Grant Nos. 52076052 and 51776048) and National Science and Technology Major Project of China (Grant Nos. Y2019-VIII-0013-0174).
Declaration of Conflicting Interests
The author(s) declared no potential conflicts of interest with respect to the research, authorship, and/or publication of this article.
Funding
The author(s) disclosed receipt of the following financial support for the research, authorship, and/or publication of this article: This work was supported by the National Science and Technology Major Project, National Natural Science Foundation of China, (grant number Y2019-VIII-0013-0174, 51776048, 52076052).