Tailsitters have complex aerodynamics that make them hard to control throughout the entire flight envelope, especially at very high angle of attack (AoA) and reverse flow conditions. The development of controllers for these vehicles is hampered by the absence of publicly available data on forces and moments experienced in such conditions. In this paper, wind tunnel experiments are performed under different flap deflections and throttle settings at all possible AoA. The dataset is made open access. Our analysis of the data shows for the tested wing, flap deflections greatly affect the lift coefficient and stall occurs at AoA as well as . Wing-propeller interaction is studied by analyzing the propeller induced force in the axis orthogonal to the thrust axis, which is dependent on AoA, airspeed, flap deflections and thrust in a nonlinear and coupled manner. The influence of inverse flow on the wing is also discussed: The data confirm that when the airflow over the wing is reversed, flap deflections will affect the pitch moment in an opposite way compared to the non-reversed case, but this opposite effect can be avoided by increasing the throttle setting. The data show the exact relationship between flap deflections and forces in this condition. Moreover, it is found that the flap control effectiveness for a wing with or without spinning propellers is usually higher around zero degrees AoA than at and it is more effective to change the flaps from to than from to the respective .
In the family of unmanned aerial vehicles (UAVs), hybrid drones are becoming a research hotspot. Fixed-wing drones offer high endurance, long range, and high speed, while rotorcraft feature high agility, hovering and vertical take-off/landing (VTOL) capabilities. A hybrid drone integrates the advantages of both and is capable of hovering as well as using its wing for fast forward flight. Currently, four types of hybrid drones are being intensively studied1 : the quadplane, the tilt-rotor, the tilt-wing, and the tailsitter. Among these types, the tailsitter stands out for its endurance and simple mechanisms. Potentially, tailsitters can be used in many societal applications, such as package delivery, exploration in complex environments and take-off/landing from a ship. However, in reality, there are still many challenges in the airframe design and control of tailsitters, especially when dealing with tailsitters’ highly nonlinear aerodynamics and the impact of inverse flow in the descending phase.
Faced with these challenges, many studies have been carried out in recent years. Li et al.2 proposed a nonlinear robust controller to handle the high nonlinearities, based on a nominal model and a nonlinear disturbance observer to compensate the uncertainties. Flores et al.3 implemented a recurrent neural network for the estimation of highly nonlinear aerodynamic terms during the transition stage. Due to the difficulty of modeling highly nonlinear tailsitters, Barth et al.4 proposed a model-free control algorithm to estimate and counteract the rapidly changing aerodynamic forces and moments with an intelligent feedback structure. In a similar fashion, Smeur et al.5 proposed an incremental nonlinear dynamic inversion controller for the attitude and position control. Although many studies have focused on the high non-linearity of tailsitters, few of them take the inverse flow in the descending phase into consideration.
Considering the difficulty of theoretical modeling, wind tunnel tests are an important way to record and evaluate the aerodynamic characteristics of tailsitters. Fratello et al.6 conducted experiments with both propeller-wing and nacelle-wing configurations at low subsonic speeds and the test results illustrated the interaction of the propeller, the nacelle and the wing. Through wind tunnel tests, Gamble et al.7 analyzed the influence of the propeller slipstream on a 24 inches flexible wing, concluding that 12 to 18 of the propeller thrust was translated into airframe drag. Stoll8, Hrishikeshavan9, and Ananda10 successively explored the aerodynamic characteristics of hybrid propeller- wings under different experimental conditions. Since the range of the angle of attack (AoA) is confined to to degrees in the NACA4412 airfoil data,11 Kubo et al.12 used the modified NACA0012 airfoil data13 to interpolate for the angle of attack range that is not available for their main wing, the NACA4412 airfoil.11 Lyu et al.14 conducted a wind tunnel test to characterize the full envelope aerodynamics of a tailsitter UAV and showed the results of calculated aerodynamic coefficients. Truong et al.15 presented a semi-empirical model of the aerodynamic coefficients of airfoils in the full range of angle of attack. Snyder et al.16 presented the characteristics of four airfoils tested in the two-dimensional wind tunnel at the AoA from 0 to and deflected the aileron of NACA 23024 airfoil from to . Results of their aileron study show that it’s ineffective to deflect the aileron above . The metadata is published together with the report. Nevertheless, the knowledge of the tail-sitter’s aerodynamic model covering the full range of angle of attack is generally absent for low-cost UAVs,14 and only few data sets have recorded the impact of different flap deflections and throttle settings on the aerodynamics of a wing with or without propellers.
The main contribution of this paper is an open-published wind tunnel test data set17 that contains the aerodynamic data of a wing with and without spinning propellers for different flap deflections at all angles of attack, which is the first one of its kind. Multiple tests were performed with different flap deflection angles for 0%, 50% and 70% throttle settings. The wind tunnel data set should be valuable for understanding the aerodynamics of VTOL aerial vehicles, especially tailsitters. Moreover, the wing-propeller interaction, the impact of inverse flow and the control effectiveness of flaps are also studied in this paper based on the measured data.
The paper is structured as follows. A description of the conducted experiments and a data set format are given first. After that, the data collected under different flap deflection, airspeed and throttle settings are presented. Then, the wing-propeller interaction, the influence of inverse flow and the control effectiveness are discussed. Finally, conclusions are drawn based on the aforementioned analysis.
Experiment setup and measurements
Experiment setup
The data were collected from multiple wind tunnel tests, all of which were conducted at the Open Jet Facility (OJF) at Delft University of Technology in February 2021. The OJF is a low-speed closed circuit wind tunnel situated in a large room with a width of 13 m and a height of 8 m. The octagonal outlet right before the test section is 2.85 m in width and 2.85 m in height. The maximum velocity in the test section is about 35 m/s. The dense wire meshes in the settling chamber of the OJF reduce velocity deviations and turbulence in the flow, which guarantees a smooth flow in the open test section.
The airfoil of the wing used for the wind tunnel tests is modified from the MH32 asymmetric airfoil,18 whose geometry is shown in Figure 2. The wingspan is 1 m. The wing has some taper, such that its chord is 0.25 m at the root and 0.2 m at the tip. The labeled picture of the wing’s cross section is shown in Figure 1. refer to the chord of the respective cross section of the airfoil. The max thickness is 11% at 30.8% chord and the max camber is 1.9% at 38.3% chord. The two flaps on the wing are connected to servos that change the flap deflections. The maximum flap deflection angle is each way. In this paper, upward deflections are defined as positive values. The wing is equipped with three brushless DC motors (BLDC) of the type T-MOTOR MN3510-25 360 KV. The speed of the motors depends on the throttle setting of a BLHeli_32 electronic speed controller (ESC). The throttle setting here specifically refers to the percentage of the PWM range of the motors, that is, 1000–2000 us. The propellers used in the tests are APC propellers, with a diameter of 0.3302 m and a pitch of 0.254 m. The two propellers near the tip and root of the wing rotate in the same direction, while the propeller in the middle rotates in the opposite way.
The cross section of the test wing.
Side view of experiment setup without propellers.
Normally, wind tunnel experiments with half a wing would include a wall at the root of the wing that would prevent a tip vortex there. In this experiment, the wall is absent and it could instigate the upwash and downwash characteristics during the flap deflection. However, since the main focus of the experiments was to figure out the impact of flap deflections and throttle settings on the wing’s dynamics instead of the absolute values of lift, drag and moment, it is still feasible and meaningful to make comparable analysis between different flap deflections even with the absence of the sidewall.
The experimental setup is shown in Figure 2. The wing is fixed on a six-axis forces and moments balance, which is mounted on a turntable, allowing a rotation of 360 degrees. For the OJF-balance, the difference between the known applied loads and the back calculated loads are errors. The maximum and the standard deviation of the errors are presented in percentage of the nominal loads in Table 11 . The sampling frequency of the balance is 100 Hz. The coordinate frames from the top view are shown in Figure 4. The wind tunnel is controlled open loop: a desired air speed is converted to a rotation speed of the wind tunnel fan. The resulting air speed is measured by a Pitot tube.
Maximum and standard errors of OJF-balance.
MAX
STDEV
Measurements
To eliminate any measurement offsets, a calibration data set was first collected with no wind tunnel airflow by rotating the balance table together with the wing fixed on it for the full . Then, for each measurement, the following procedure was followed. The airspeed was set as m/s initially and increased with intervals of m/s, until a maximum of m/s. The wind tunnel airspeed is not closed loop controlled, and slight variations from the desired airspeed occur depending on the flow resistance in the test section. The actual airspeed is recorded continuously for each experiment. The average deviation between the actual airspeed and the desired airspeed is 0.8 m/s for 0% and 70% throttle settings, and 0.2 m/s for 50% throttle setting. Compared to the value of the desired airspeed, the deviation is much smaller and its influence is assumed to be negligible.
At each airspeed, the wing was rotated at a speed of per second, such that all possible AoA are covered. Based on experience with the Nederdrone,19 equipped with wings of this kind, a throttle setting of around 60% is typical during the hover and transition phase. To investigate the effect of the throttle, the experiment was performed with 50% throttle, 70% throttle and once without propellers mounted. For these three different throttle settings, the experiments were performed with various flap deflections: no flap deflection, 50% flap down, 50% flap up, 100% flap down and 100% flap up. It is worth mentioning that the motor stopped twice for an instant during the measurement for 50% throttle with 50% upward flap deflection, which is shown in Figure 7 as two small spikes. The available measurements from the wind tunnel tests are listed in Table 2 and an overview of the performed experiments is given in Figure 3.
The format of the wind tunnel experiment data set.
Available measurements from the wind tunnel tests.
Measurements
Nomenclature
Time
Force (measurement X-axis)
Force (measurement Y-axis)
Force (measurement Z-axis)
Moment (measurement X-axis)
Moment (measurement Y-axis)
Moment (measurement Z-axis)
RPM (wind tunnel)
rpm
Temperature
temp [C]
Atmospheric pressure
P [Pa]
Differential pressure
dP [Pa]
Airspeed
Dynamic pressure
[Pa]
Angle of attack
[deg]
Comparison between test wing and MH32-il airfoil.
MH32-il
Tested MH32
Descriptions of the collected data
Forces and moments
Since the pitch moment is usually regarded as the most important moment in tailsitter research,20 the longitudinal forces and moment will be our main focus in this paper.
Figure 4 presents a top view of the measurement coordinate frame and the aerodynamic coordinate frame . Both coordinate frames are right-handed. and are the aerodynamic lift and drag generated by the wing independent of the thrust, is the propeller thrust, and and are the forces induced by the propeller slipstream in the and axes. To describe the collective forces in the lift and drag directions, and are respectively defined as the resultant forces on the positive axis and the negative axis. is the pitch moment, and together with the forces , it can be calculated from the measurements by Equation (1).
When the throttle setting is 0% and the propellers are not mounted, in the plane, the wing is only subjected to and , which can be described by Equation (2).
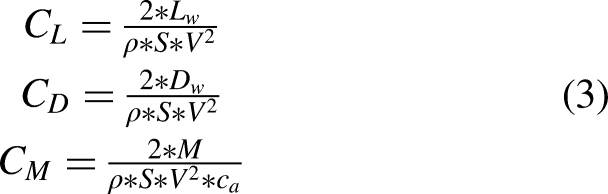
Accordingly, the aerodynamic coefficients of the wing can be calculated by Equation (3).
where is the air density, is the wing area, is the mean aerodynamic chord and refers to the wind tunnel airspeed.
The measurement coordinate frame and the air coordinate frame from the top view.
When the throttle setting is not 0%, in the plane, apart from the aerodynamic forces and generated by the wind tunnel air, the wing is also subjected to the propeller thrust , and the force induced by the propeller slipstream . Through force synthesis, and can be described by Equation (4).
The aerodynamic coefficients are dimensionless parameters defined in fluid dynamics field. Since and consist not only of aerodynamic forces, but also thrust components, the aerodynamic coefficients cannot comprehensively describe the aerodynamics of the wing with spinning propellers. Hence, in this paper, the aerodynamic coefficients are used to analyze the measurements for 0% throttle setting; for 50% and 70% throttle settings, the measurements are analyzed in the form of forces and moments directly.
Measurement validation
Since the test wing is a modified MH32 airfoil, within the AoA before the stall, we compared its lift coefficients at low Reynolds number to those of mh32-il airfoil in UIUC Airfoil Coordinates Database, as is shown in Table 3. In this table, the lift coefficient of our wing with no flap deflection is selected. The deviation in the values is predictable due to the different thickness and camber of the airfoil. Even if a deviation exists in the absolute values, it is found that the lift coefficients of our wing and the MH32-il airfoil are both near-linear correlated to the AoA with a similar trend within the AoA range before the stall.
To validate the accuracy of measurements, we also conducted the repeated experiments for 0% throttle setting on two consecutive days respectively. By comparing the measured data under the same experimental setting, it is found that the measured wind tunnel data set is soundly trustworthy. Taking the repeated measurements for 0% throttle and flap deflection as an example, the resultant lift coefficients calculated from non-filtered data on two days keep high consistency in the trend and values, as is shown in Figure 5. The picture also confirms that the resultant lift coefficient in our experiments is not subject to different wind tunnel airspeeds as expected, and the influence of flow velocity can be ignored in the analysis of aerodynamic coefficients.
for flap deflection (0% throttle setting) from two repeated tests.
Influence of flap deflection
For 0% throttle, the air flowing over the wing surface only comes from the wing tunnel. Figure 6 displays the aerodynamic coefficients , and of the wing for different flap deflections. The feature of our data set is that the measurements cover the full AoA.
, and for different flap deflection (0% throttle setting).
It can be observed from Figure 6 that the wing’s aerodynamic coefficients are affected by the upward and downward flap deflections in an opposite way. The more the flap deflects, the greater the impact of flap deflections on the aerodynamic coefficients is. With the AoA range of to , the lift coefficient is commonly expressed by first-order Taylor series based on , , , which is validated in Figure 6. Within the to AoA range, downward flap deflections contribute to the larger value of . The opposite is true within to and to AoA. It is worth noting that besides , stall also occurs in the lift coefficient at AoA where the wing encounters inverse flow. Besides, the moment coefficient reaches extreme values at AoA with downward and upward flap deflections respectively.
Influence of throttle setting
Figure 7 shows the forces and for 0%, 50% and 70% throttle settings at 12m/s airspeed. It can be seen that compared to the flap deflection, the throttle setting is the main factor affecting the forces and . Different from for 0% throttle setting, there is no noticeable stall in for 50% or 70% throttle setting. The value of continuously increases within the range of to for 0% throttle, to for 50% throttle and to for 70% throttle, indicating that the increase of the throttle enlarges the range in which rises smoothly. At AoA, the thrust is exactly opposite to the drag, and negative values are attained when the thrust exceeds the drag. Also, both and reach larger peak values with the increase of throttle.
and for 0%, 50%, 70% throttle settings at
12 m/s.
Influence of airspeed
The two plots in Figure 8 illustrate the pitch moment at different wind tunnel airspeeds for respective 0% and 70% throttle settings. It is shown that the pitch moment is significantly influenced by the airspeed for both 0% and 70% throttle settings, especially when is large. With the increase of airspeed, the peak value of increases. For 0% throttle setting, the pitch moment is significantly affected by the airspeed and the flap deflection affects the pitch moment more with the increase of airspeed; For 70% throttle setting, the pitch moment is mainly affected by flap deflection around AoA, while largely influenced by the airspeeds near AoA.
at different airspeeds for respective 0% (a) and 70% (b) throttle settings.
Discussion
Inverse flow
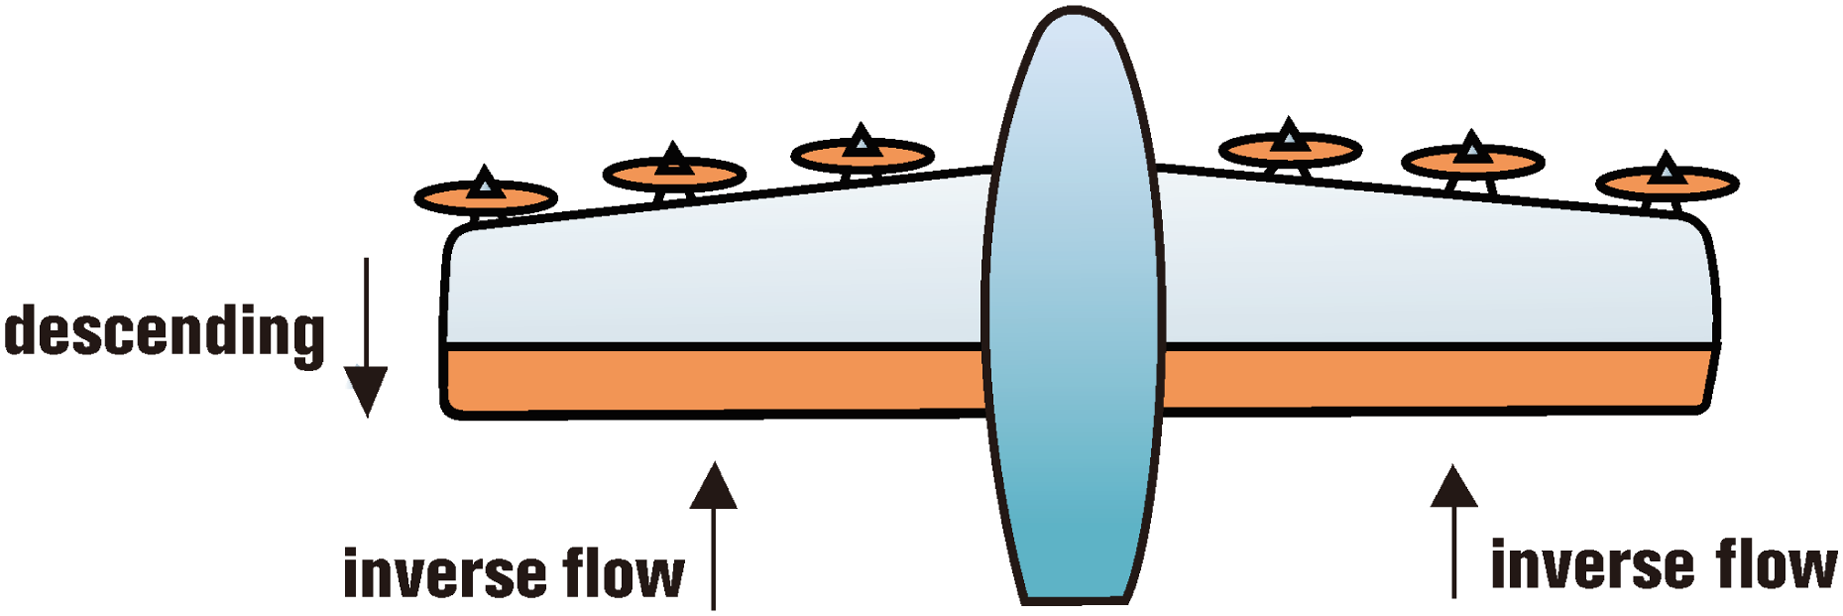
During the hover phase of tailsitters, the dominant flow over the wing surface is usually the flow generated by the propellers. However, it could also happen that the total thrust is largely reduced and the dominant flow comes from the trailing edge of the wing. As Figure 9 shows, when a tailsitter descends vertically, it will be affected by air flowing over the wing in reverse (inverse flow), which can affect the control effectiveness of the flaps. In this section, the influence of the inverse flow will be discussed.
Schematic representation of a tailsitter equipped with the test wings in the descending phase.
It can be seen from Figure 10 that in our wind tunnel tests, when the AoA is in the range of to and to , the trailing edge of the wing will face towards the air flowing over the wing surface in reverse, which simulates the situation when the tailsitter encounters inverse flow.
Schematic representation of the test wing under the influence of inverse flow from the top view.
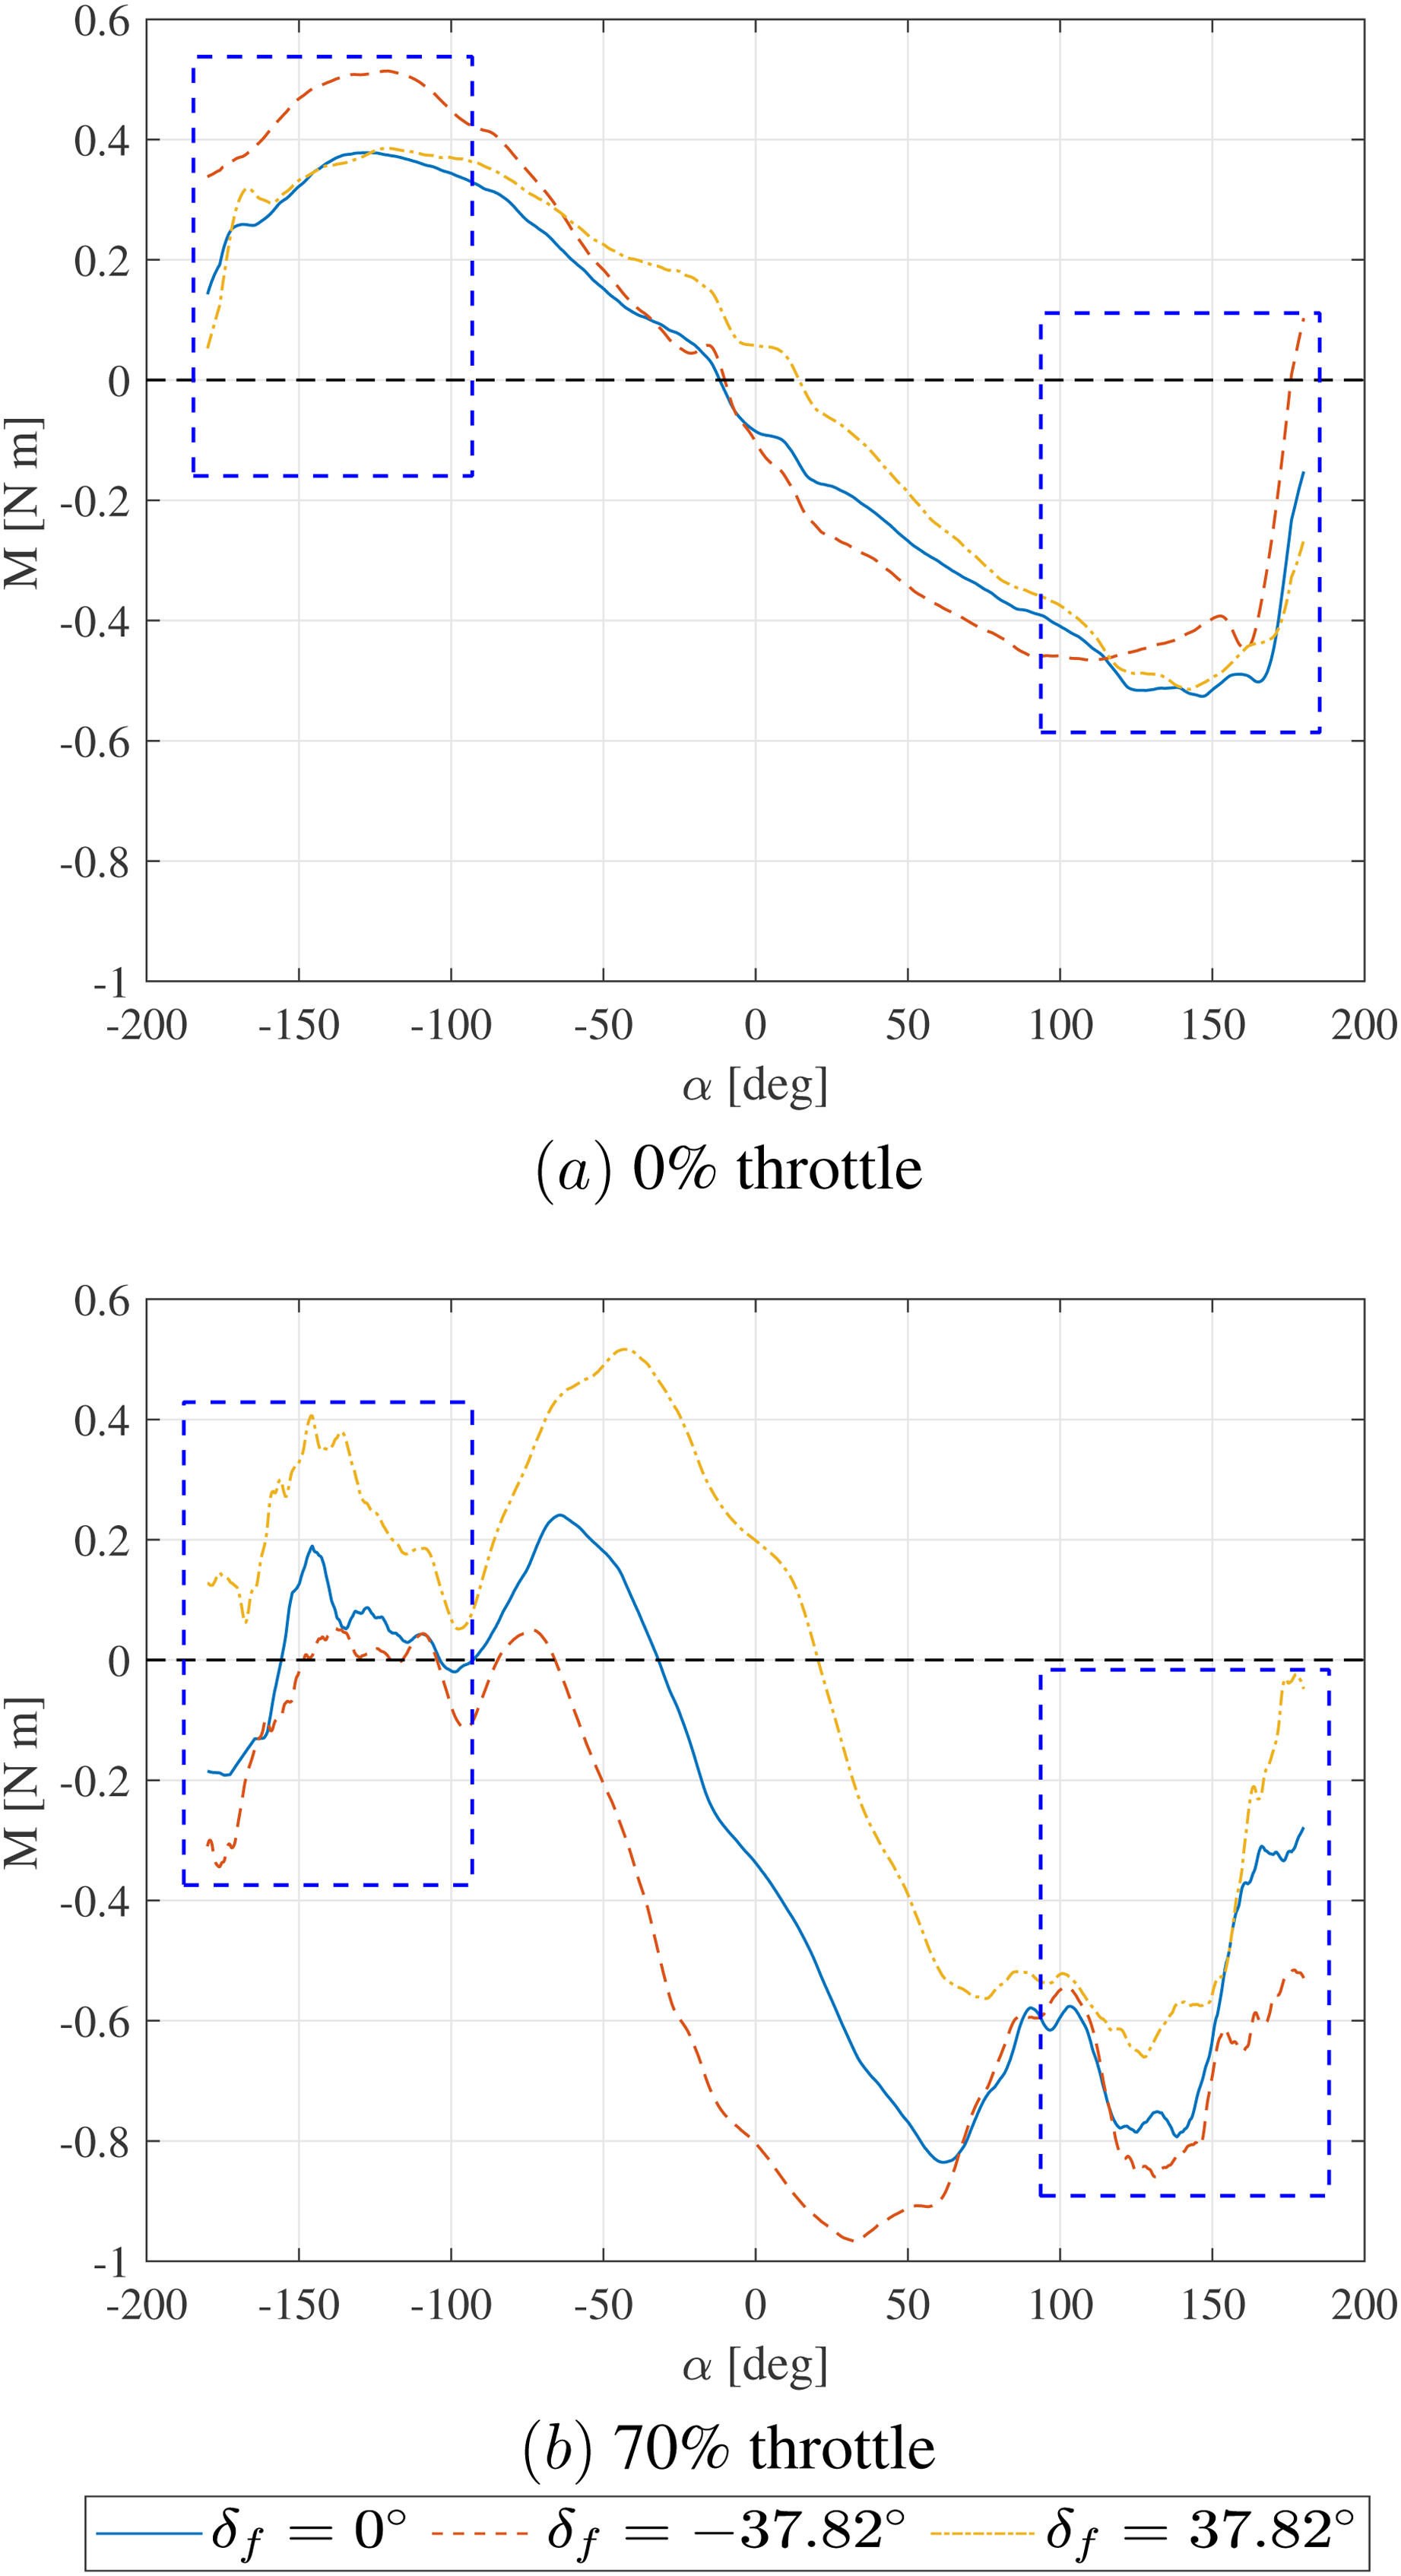
Figure 11 shows the pitch moment for the 0% and 70% throttle settings at 6m/s airspeed, in which the plots have been filtered with a moving average filter compared to the moment at 6m/s in Figure 8. Within the range of to , the moment basically has the larger value with the upward deflected flaps for both 0% and 70% throttle settings. However, within the range of to and to , the wing is under the impact of inverse flow. For the 0% throttle setting, the air flowing over the wing is purely from the wind tunnel in the reversed direction. As is shown in Figure 11, the value of the moment for 0% throttle is larger with downward deflected flaps than with upward ones within the range of to and to , which is just opposite to the case within to . It is also worth noting that within to the upward flap deflection has little impact on the moment for 0% throttle. On the contrary, the propeller induced slipstream for 70% throttle is so strong that it is the dominant flow over the wing in a non-reversed direction. Within the full AoA, the moment for 70% throttle always reaches a larger value with upward deflected flaps than with downward deflection. It can be concluded that when the air flowing over the wing is reversed, the flap deflections will affect the pitch moment in an opposite way compared to the non-reversed case, but this kind of opposite effect can be prevented by increasing the throttle setting.
for respective 0% throttle(a) and 70% throttle settings at 6m/s airspeed(b).
Wing-propeller interaction
In research on tailsitter UAVs, the wing-propeller interaction is one of the main concerns. When the motors are on, a slipstream will be generated by the spinning propellers that has an influence on the wing aerodynamics. The normal way of modeling the overall lift acting on the wing is to calculate it with the lift coefficient and the total speed, which is the sum of aircraft speed and propeller stream speed.21 However, the lift coefficient is generally expressed by first-order Taylor series based on , , . This method is only applied within the range before the stall, e.g. the range from to in Figure 6, instead of the full AoA. In practice, tailsitters can encounter the circumstance of large AoA. In this section, the differential forces on the axis between 0% and respective 50%, 70% throttle settings are studied to find out the influence of the propeller slipstream within the full AoA.
We assume that the propeller thrust does not influence the free-stream wind-tunnel speed. The wind tunnel does not have a closed-loop velocity controller, yet the influence of the propeller thrust is typically small. For each airspeed, the only thing that changed between our experiments is the throttle setting. If one would assume each motor to produce a force in the direction of the motor axis, the thrust would have no effect in the axis. Yet, for different throttle settings, the difference in the resultant force on the axis is the force generated by the propeller induced flow, which can be calculated by the following equation:
where is the aerodynamic force generated by the propeller induced flow on the axis, is the difference of the force measured on axis, is the force measured on axis for 50% or 70% throttle setting, and is the force measured on axis for 0% throttle setting. From the measurements obtained by Theys et al.22, we conclude that the force on the axis induced by a propeller alone without the wing in oblique flow is small, which can be neglected compared to acting on the wing.
Figure 12 displays the induced force on the axis generated by the spinning propellers for 50% and 70% throttle settings, in which the data have been filtered with a moving average. For each throttle setting, is discussed for different flap deflections at respectively 6m/s, 9m/s and 12m/s wind tunnel airspeeds. It is observed that compared to the increase of airspeed, the increase of throttle has a bigger impact on the magnitude of . For 50% throttle, by increasing the airspeed from 6m/s to 12m/s, becomes highly nonlinear within range from to . For 50% throttle at 9m/s airspeed, downward flap deflections obviously have a bigger impact on compared to upward ones within range from to , which is not the case for other airspeeds or 70% throttle. For 70% throttle at 6m/s airspeed, the value of for downward flap deflections is always larger than that for upward deflections, while with the increase of airspeed, is larger with upward deflected flap than downward ones around AoA, indicating that the propeller induced force is also affected by the inverse flow.
generated by 50% and 70% throttle at 6 m/s and 12 m/s airspeeds.
From Figure 12, it can be concluded that within the full AoA, the force induced by the propeller slipstream acting on the wing is non-linearly dependent on the AoA, the flap deflection, airspeed and the throttle setting in a coupled manner. Considering the wing-propeller interaction, it may be more accurate to model a tailsitter by directly expressing the resultant force in the lift direction as a nonlinear function of the angle of attack, the flap deflection, the speed of the tailsitter and the thrust, than just calculating the collective force of the thrust and the aerodynamic lift even if the propeller slipstream velocity is considered and added to the total speed.
Control effectiveness
The control effectiveness refers to the the change in force or moment caused by a change in control input,5 which directly describes the control effect of actuators on the output. When the control effectiveness is zero, it indicates that the output has no response to the respective actuator. A change of its sign can potentially complicate the design of a stable controller. Hence, when trying to control a tailsitter drone, it is important to find out how the control effectiveness changes depending on the AoA, airspeed, flap deflection and throttle setting. In this section the control effectiveness of the flaps will be considered, which can be calculated with the following equation:
where is the partial derivative of the moment, is the partial derivative of flap deflection, is the moment change, and the is the change of flap deflection.
With flap deflections changed in four ways, Figure 13 displays the control effectiveness for 0%, 50% and 70% throttle settings at 6m/s, 9m/s and 12m/s airspeeds. It can be observed that the control effectiveness generally gets higher with the increase of the throttle setting and airspeed and reaches the peak value around AoA. The control effectiveness is relatively lower around AoA. For each throttle setting, the observations of flap control effectiveness are described as follows.
Control effectiveness of flap deflection under different throttle settings.
For 0% throttle setting, the change of flap deflection has little impact on the control effectiveness at low airspeed and the effectiveness value is largest at AoA with the flaps deflected from to . Ideally, the curve of the control effectiveness would be a flat horizontal line above zero. However, as the AoA changes to , the value of control effectiveness decreases rapidly and the sign flips. Noticeably, when the flaps are deflected from to , sudden declines and rises appear in the curve of control effectiveness, respectively within the ranges of to and to .
For both the 50% and 70% throttle settings, the control effectiveness is basically higher around AoA than at and attains a larger peak value with the increase of airspeed. For both upward and downward flap deflections, it is more effective to deflect the flaps from to than from to . For 50% throttle, the highest control effectiveness is achieved at AoA by deflecting the flaps from 0% to 50% down. For 70% throttle, it is both significantly effective to deflect the flaps from 0% to . Similar to the situation under 0% throttle setting, the control effectiveness also drops rapidly in the the ranges of to and to , especially for 50% throttle.
Overall, for different throttle settings and airspeeds, the change of flap deflections can make a big difference to the control effectiveness at small AoA. In other words, it is more effective to deflect the flaps around AoA than at , which validates the common practice that it is usually very hard to control a tailsitter at large AoA, e.g. during its vertically descending phase. To control a tailsitter with spinning propellers, it is generally more effective to deflect the flaps from zero to halfway deflection than from halfway deflection to full deflection.
Conclusion
This paper describes aerodynamic data of a wing under different throttle setting and flap deflection conditions, measured from wind tunnel tests at all angles of attack (AoA).
The aerodynamic coefficients of the tested wing are analyzed based on the measurements for 0% throttle. It is found that flap deflections have a great impact on the lift, drag and moment coefficients. Within to AoA, the lift coefficient is linearly related to the flap deflections and angle of attack, which is not the case for the rest of angles of attack. It is found that when sufficient thrust is provided, a clear stall can no longer be observed in the lift of the vehicle.
For 0% throttle setting, the pitch moment is more affected by changes in airspeed than changes in flap deflection at very large AoA. For the tested airfoil with spinning propellers, the flap deflections have a significant impact on the pitch moment within the AoA range from to .
For the full AoA, the propeller induced force is dependent on the AoA, the flap deflections, airspeed and the thrust in a coupled and nonlinear way. It is not accurate to model a tailsitter by calculating only the collective force of the thrust and the aerodynamic lift, even if the propeller slipstream airspeed has been considered and added to the total speed.
When the air flowing over the wing is reversed, the flap deflections will affect the pitch moment in an opposite way compared to the non-reversed case. This kind of opposite effect can be avoided by increasing the throttle setting.
The control effectiveness is an important term for the control of tailsitters, which depends on the AoA and flap deflection itself. It is more effective to deflect the flaps from to than from to . It is also found that the flap control effectiveness is usually highest around AoA. In flight conditions involving high AoA and low throttle, the control effectiveness of the flaps can become close to zero or even negative. This makes control design for tailsitters challenging at high angle of attack, and during vertical descending flight. For a tailsitter drone, it could be promising to deflect the motors and propellers rather than flaps to achieve large control effectiveness of the pitch moment.
Footnotes
Declaration of conflicting interests
The authors declared no potential conflicts of interest with respect to the research, authorship, and/or publication of this article.
ORCID iDs
Ziqing Ma
Ewoud J.J. Smeur
Notes
References
1.
SaeedASYounesABIslamSet al. A review on the platform design, dynamic modeling and control of hybrid uavs. In 2015 International Conference on Unmanned Aircraft Systems (ICUAS). IEEE, pp. 806–815. doi:10.1109/ICUAS.2015.7152365.
2.
LiZZhangLLiuHet al. Nonlinear robust control of tail-sitter aircrafts in flight mode transitions. Aerosp Sci Technol2018; 81: 348–361.
3.
FloresAFloresG. Transition control of a tail-sitter uav using recurrent neural networks. In 2020 International Conference on Unmanned Aircraft Systems (ICUAS). IEEE, pp. 303–309. doi:10.1109/ICUAS48674.2020.9213919.
4.
BarthJMCondominesJPBronzMet al. Model-free control algorithms for micro air vehicles with transitioning flight capabilities. Int J Micro Air Vehicles2020; 12: 1–12.
5.
SmeurEJJBronzMde CroonGCHE. Incremental control and guidance of hybrid aircraft applied to a tailsitter unmanned air vehicle. J Guid Control Dyn2020; 43: 274–287.
6.
FratelloGFavierDMarescaC. Experimental and numerical study of the propeller/fixed wing interaction. J Aircr1991; 28: 365–373.
7.
GambleBJReederMF. Experimental analysis of propeller-wing interactions for a micro air vehicle. J Aircr2009; 46: 65–73.
8.
StollAM. Comparison of cfd and experimental results of the leaptech distributed electric propulsion blown wing. In 15th AIAA Aviation Technology, Integration, and Operations Conference. 3188, AIAA, pp. 1–9. doi:10.2514/6.2015-3188.
9.
HrishikeshavanVBogdanowiczCChopraI. Experimental investigation of performance of a wing-propeller system for a quad-rotor-biplane micro air vehicle. In 54th AIAA/ASME/ASCE/AHS/ASC Structures, Structural Dynamics, and Materials Conference. 1784, AIAA, pp. 1–19. doi:10.2514/6.2013-1784.
10.
AnandaGKSeligMSDetersRW. Experiments of propeller-induced flow effects on a low-reynolds-number wing. AIAA J2018; 56: 3279–3294.
11.
AbbottIHVon DoenhoffAE. Theory of wing sections: including a summary of airfoil data. Dover Publications Inc, New York, Published by McClelland & Stewart Ltd,1959.
CritzosCCHeysonHHBoswinkle JrR. Aerodynamic characteristics of naca 0012 airfoil section at angles of attack from 0 degrees to 180 degrees. Technical report, Langley Aeronautical Laboratory, 1955.
14.
LyuXGuHWangYet al. Design and implementation of a quadrotor tail-sitter vtol uav. In 2017 IEEE international conference on robotics and automation (ICRA). IEEE, pp. 3924–3930. doi:10.1109/ICRA.2017.7989452.
15.
TruongV. An analytical model for airfoil aerodynamic characteristics over the entire angle of attack range. J Renew Sustain Ener2020; 12: 1–16.
16.
SnyderMHWentzWAhmedA. Wer-16: Two-dimensional tests of four airfoils at angles of attack from 0 to 360 degrees. Technical report, Wichita State University, Center for Energy Studies, 1984.
17.
MaZSmeurE. Wind tunnel data set with a wing at all angles of attack. 4TU.ResearchData.Dataset. doi:10.4121/16620226.
18.
Escobar-RuizAGLopez-BotelloOReyes-OsorioLet al. Conceptual design of an unmanned fixed-wing aerial vehicle based on alternative energy. Int J Aerospace Eng2019; 2019: 1–13.
19.
De WagterCRemesBSmeurEet al. The nederDrone: A hybrid lift, hybrid energy hydrogen UAV. Int J Hydrogen Energy2021; 0: 1–16. doi: 10.1016/j.ijhydene.2021.02.053.
20.
LiBZhouWSunJet al. Model predictive control for path tracking of a vtol tailsitter uav in an hil simulation environment. In 2018 AIAA Modeling and Simulation Technologies Conference. 1919, AIAA, pp. 1–14. doi:10.2514/6.2018-1919.
21.
YangYZhuJYangJ. Indi-based transitional flight control and stability analysis of a tail-sitter uav. In 2020 IEEE International Conference on Systems, Man, and Cybernetics (SMC). IEEE, pp. 1420–1426. doi:10.1109/SMC42975.2020.9283378.
22.
TheysBDimitriadisGHendrickPet al. Experimental and numerical study of micro-aerial-vehicle propeller performance in oblique flow. J Aircr2017; 54: 1076–1084.