
Abstract
To address the safety hazards of coastal outdoor billboards under extreme wind disasters and the limitations of existing design codes, this study conducts systematic wind tunnel tests on three kinds of typical billboards (floor-standing single-panel, single-column double-panel, and single-column triple-panel configurations) using 1:20 scale rigid models. The surface pressure distribution is measured through pressure tap measurements. Key findings reveal: (1) the high pressure zone on windward panel shifts toward the wind direction with the increasing wind angle; (2) the extreme values of positive/negative local wind pressure occur in the 45°/90° wind direction cases, and the local wind pressure coefficients can be up to 1.39/−1.28, respectively, exceeding the values specified in the codes; (3) the extreme positive value of overall average wind pressure, up to 0.95, occurs in the 0° wind direction case. The findings provide quantitative benchmarks for wind-resistant design optimization of billboard.
Introduction
As an important part of urban infrastructure, the wind safety of outdoor billboards is directly related to public safety and economic losses. In recent years, the frequent occurrence of typhoons and other extreme wind events has led to billboard collapses, resulting in serious casualties and property losses.1–3 However, the existing codes (ASCE 7-22 4 in the United States and GB50009-2012 5 in China) are still rough on the wind loads of billboards, which cannot accurately reflect the actual force characteristics under complex wind situation. Studies have shown that key factors such as the local wind pressure distribution of billboards, 6 aerodynamic damping effect, 7 and multi-panel interference effect 8 significantly affect their wind-resistant performance, which are often ignored in the current design methods, resulting in unsafe or overly conservative designs. Therefore, the study of wind resistance of billboards is of great theoretical significance and engineering application value to improve the code system and enhance the structural safety.
Early studies mainly focused on single-panel billboards, and a database of wind-pressure or body-shape coefficient was established through wind tunnel tests.3,9–11 Letchford 9 established the quantitative relationship between height-to-width ratio, gap ratio and wind pressure coefficient through wind tunnel tests. With the development of engineering requirements, the study of multi-panel structures (double-panel and triple-panel) has gradually increased. Studies have shown that the local wind pressure distribution of multi-panel structures exhibits significant asymmetry and non-Gaussian characteristics, and the negative pressure extremes in the edge region of the leeward panel can be up to several times that of the windward side.6,8 The wind vibration response study found that aerodynamic damping has an important suppression effect on the high-frequency response, 7 but the torsional vortex-excited vibration still needs further study. Field measurements show that the extreme torque and extreme force of billboards do not occur simultaneously, and a combined load design method is required.3,11 Numerical simulation provides a new approach to analyze the failure mechanism of billboards under complex working conditions. Salgado-Estrada et al. 12 quantified the probability of structural failure under extreme wind speeds based on CFD and reliability theory. For the structural failure mode, Wen and Xie 13 proposed two types of typical damage mechanisms, namely, anchor bolt fracture (brittle) and column local buckling (ductile), based on the on-site investigation after the typhoon, and established a buckling capacity assessment method based on the European Norm EN1993-1-6:2007 14 through pushover analysis. Despite the remarkable achievements, the existing codes are still lagging behind the engineering practice, and the research on the wind vibration mechanism of billboards under multi-factor coupling has yet to be deepened.
To address the safety hazards of coastal outdoor billboards under extreme wind disasters and the limitations of existing design codes, this study selects three typical structural forms based on the current common urban outdoor billboards and signboards, including: floor-standing single-panel, single-column double-panel, and single-column triple-panel configurations, to simplify and produce scale rigid models. The wind tunnel test was conducted to investigate the differences in the wind pressure and its distribution among the three types of billboards.
Although previous studies (e.g. Li et al. 7 and Wang et al. 8 ) have identified multi-panel interference effects, a systematic, comparative investigation of local and overall wind pressure characteristics across the three most common structural forms (single-, double-, and triple-panel) under a wide range of wind angles (0°−180°) is still lacking. Existing codes and some prior research often treat these configurations similarly, which our findings show can be non-conservative or overly conservative.
Wind tunnel test
Model
The models include floor-standing single-panel billboard model, single-column double-panel billboard model, and single-column triple-panel billboard model, as shown in Figures 1 –3. Figure 4 is the schematic for the three models. The black-bordered rectangles represent the panels while the arrows indicate the direction of wind. These scale rigid models, scale ratio of 1:20, are for pressure measurement.
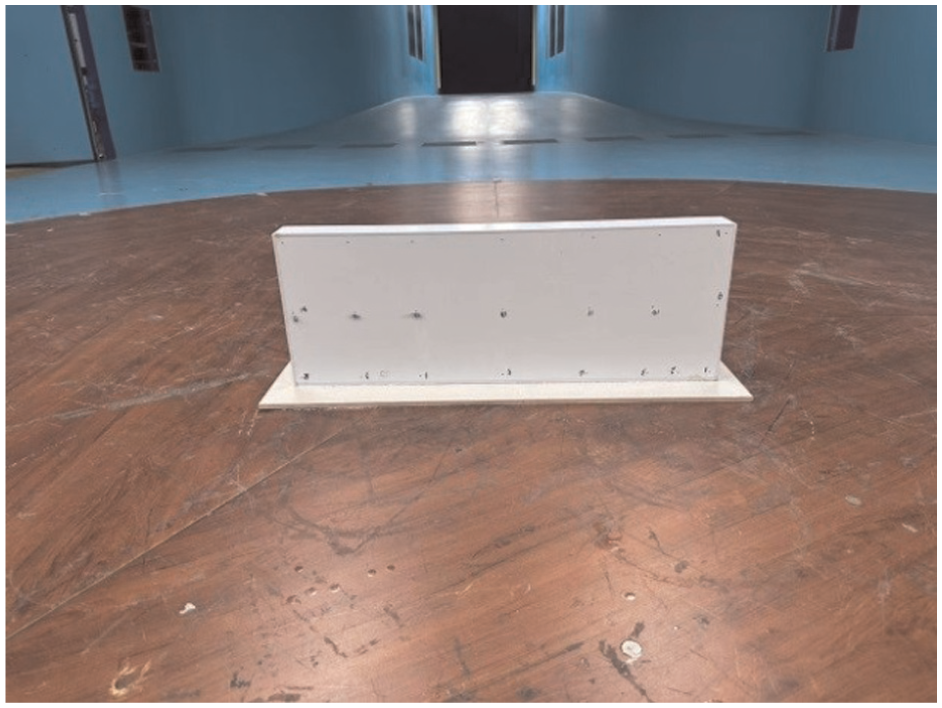
Floor-standing single-panel billboard model.

Single-column double-panel billboard model.

Single-column triple-panel billboard model: (a) back view and (b) top view.

Billboard models schematic: (a) floor-standing single-panel billboard model, (b) single-column double-panel billboard model, and (c) single-column triple-panel billboard model.
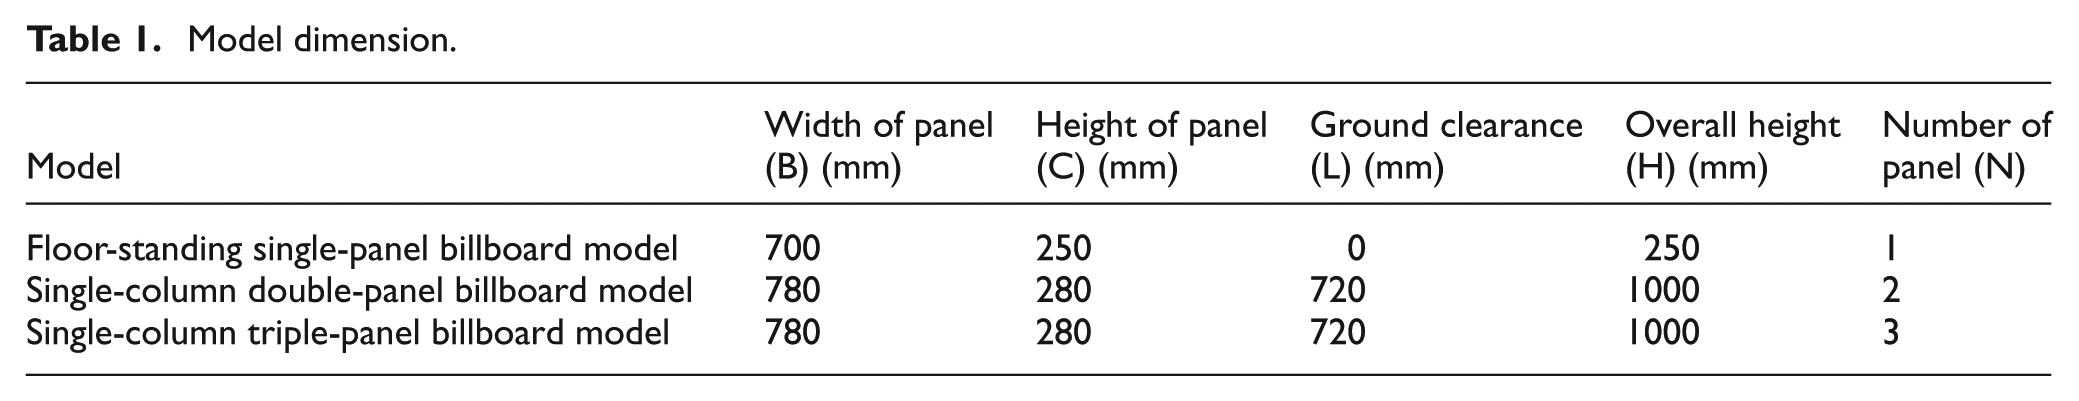
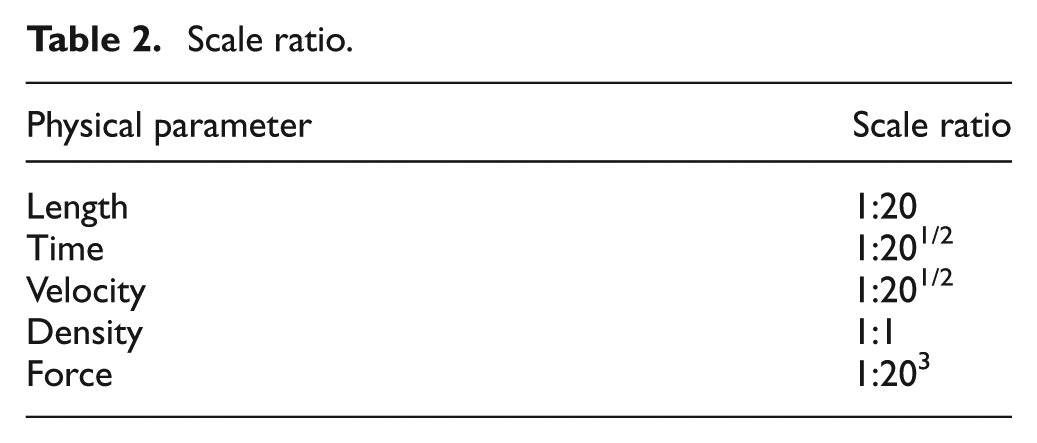
The model panel is made of 3 mm-thick ABS (Acrylonitrile-butadiene-styrene) plates, and in order to measure the wind pressure on both the inner and outer surfaces of the billboard panels, 20 mm-thick hollow boxes is used to simulate the billboard panels. The skeleton of the models (including the columns, beams, and other supporting members) are made of stainless steels. The dimensions and scale ratios of the models are shown in Tables 1 and 2. The pressure taps are arranged in a grid pattern on both the front and back surfaces of the panel to capture the pressure gradient. A typical distribution is illustrated in Figure 5.
Model dimension.
Scale ratio.
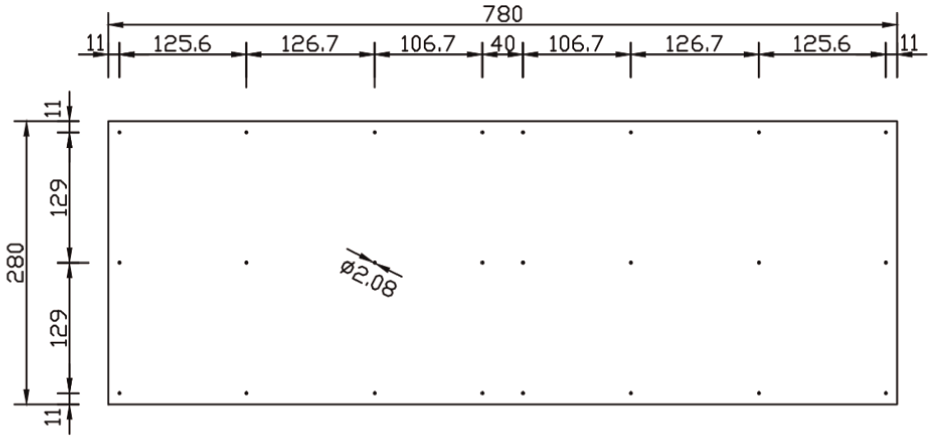
A typical distribution of the pressure taps.
Wind field simulation
This test is conducted in the XMUT-WT wind tunnel of Xiamen Institute of Technology. The mean wind speed the longitudinal turbulence intensity, and the spectrum of fluctuating wind speed simulated in the wind tunnel is shown in Figure 6. The mean wind speed profile is assumed to follow the exponential law where the exponent equal to 0.10.
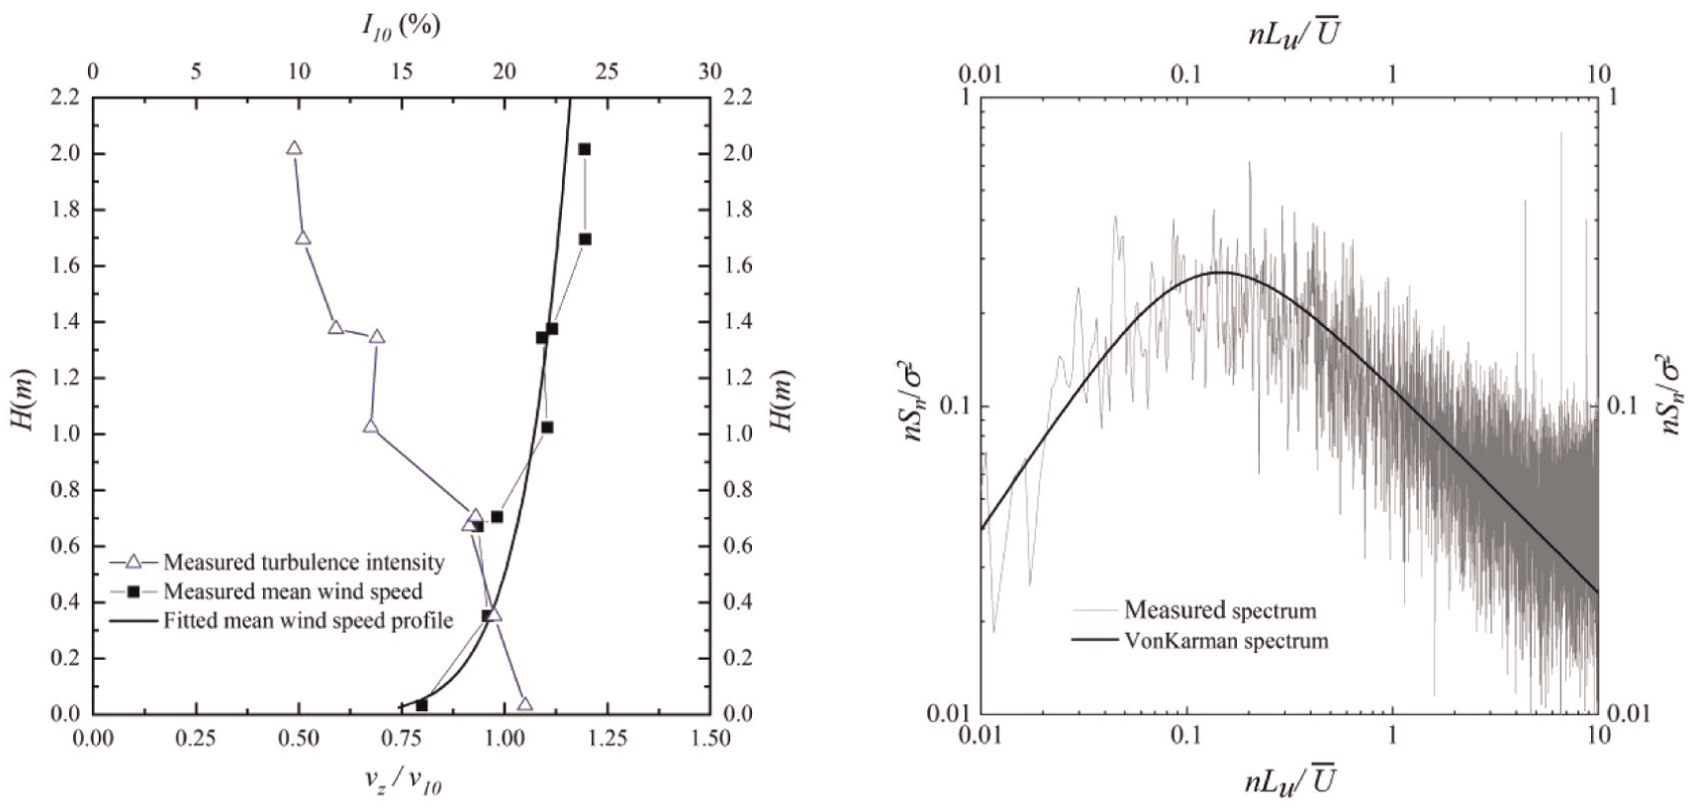
Characteristics of the simulated wind field in the wind tunnel.
The Cobra probe (hereinafter referred to as “TFI”), with a sampling frequency of 600 Hz, is used to measure the incoming wind speed and the measuring point is 1000 mm from the ground. The reference wind speed (
Case setting
Each of the three models is set up with several incoming wind directions, with the incoming flow acting vertically at the front of the model panels defined as 0°, and the wind directions are shown in Table 3 and Figure 4. Unfortunately, due to equipment failure, the data for the 22.5° wind direction case of the floor-standing single-panel billboard model and the 15.0° and 105.0° wind direction cases of the single-column three-panel billboard model are lost. Given that the tested wind directions are sufficiently dense and cover the critical angles (e.g. 0°, 45°, 90°), the missing data points for specific angles are not expected to alter the overall trends and conclusions regarding pressure distribution and extreme values, which are based on a comprehensive dataset. The sampling time duration of measurement record is 135 s, which corresponds to 10 min in prototype scale.
Wind direction.

Test result
Distribution of local wind pressure coefficient on panel
The local wind pressure coefficient at each location (measurement point) of the model panel is defined as follows:


where
The number of measurement points can only be set to a limited number, so only a limited number of positions at the panel can be measured for wind pressure. The pressure distribution over the whole panel is obtained by linear interpolation method, and then the local wind pressure coefficient of the whole panel is calculated by equation (1).
Figure 7 is the distribution of local wind pressure coefficient on panel for the floor-standing single-panel billboard model.

Distribution of local wind pressure coefficient on panel for the floor-standing single-panel billboard model.
In the 0° wind direction case, the distribution of local wind pressure coefficient is basically symmetrical, with the local wind pressure coefficient at the lower center of the panel being the maximum, gradually decreasing toward the surrounding regions, and the local wind pressure coefficient at the corners of the panel being the minimum. The local wind pressure coefficients are all positive, with a distribution range from 0.32 to 0.76.
In the 45° wind direction case, the central region with the maximum local wind pressure coefficient shifts to the right (toward the wind direction) to near 1/4 of the panel width, and its value increases compared to the previous case. The local wind pressure coefficients are still all positive, with a slightly increased distribution range, between 0.19 and 0.96.
In the 67.5° wind direction case, the central region with the maximum local wind pressure coefficient is still near 1/4 of the panel width, but its value has decreased compared to the previous case. The gradient of the local wind pressure coefficient decreasing to the right (toward the wind direction) has increased significantly. Negative local wind pressure coefficients appear at the lower corner of the panel. The local wind pressure coefficients are distributed between −0.55 and 0.66.
In the 90° wind direction case, the central region with the maximum local wind pressure coefficient is still near 1/4 of the panel width, but its value has further decreased compared to the previous case, and the gradient of the local wind pressure coefficient decreasing to the right (toward the wind direction) has further increased. The local wind pressure coefficients on the right 1/8 region of the panel (toward the wind direction) are negative and have relatively larger absolute values, while the other 7/8 region are still positive, and have relatively smaller absolute values. The local wind pressure coefficients are distributed between −0.85 and 0.26.
Figure 8 is the distribution of local wind pressure coefficient on panel for the single-column double-panel billboard model.
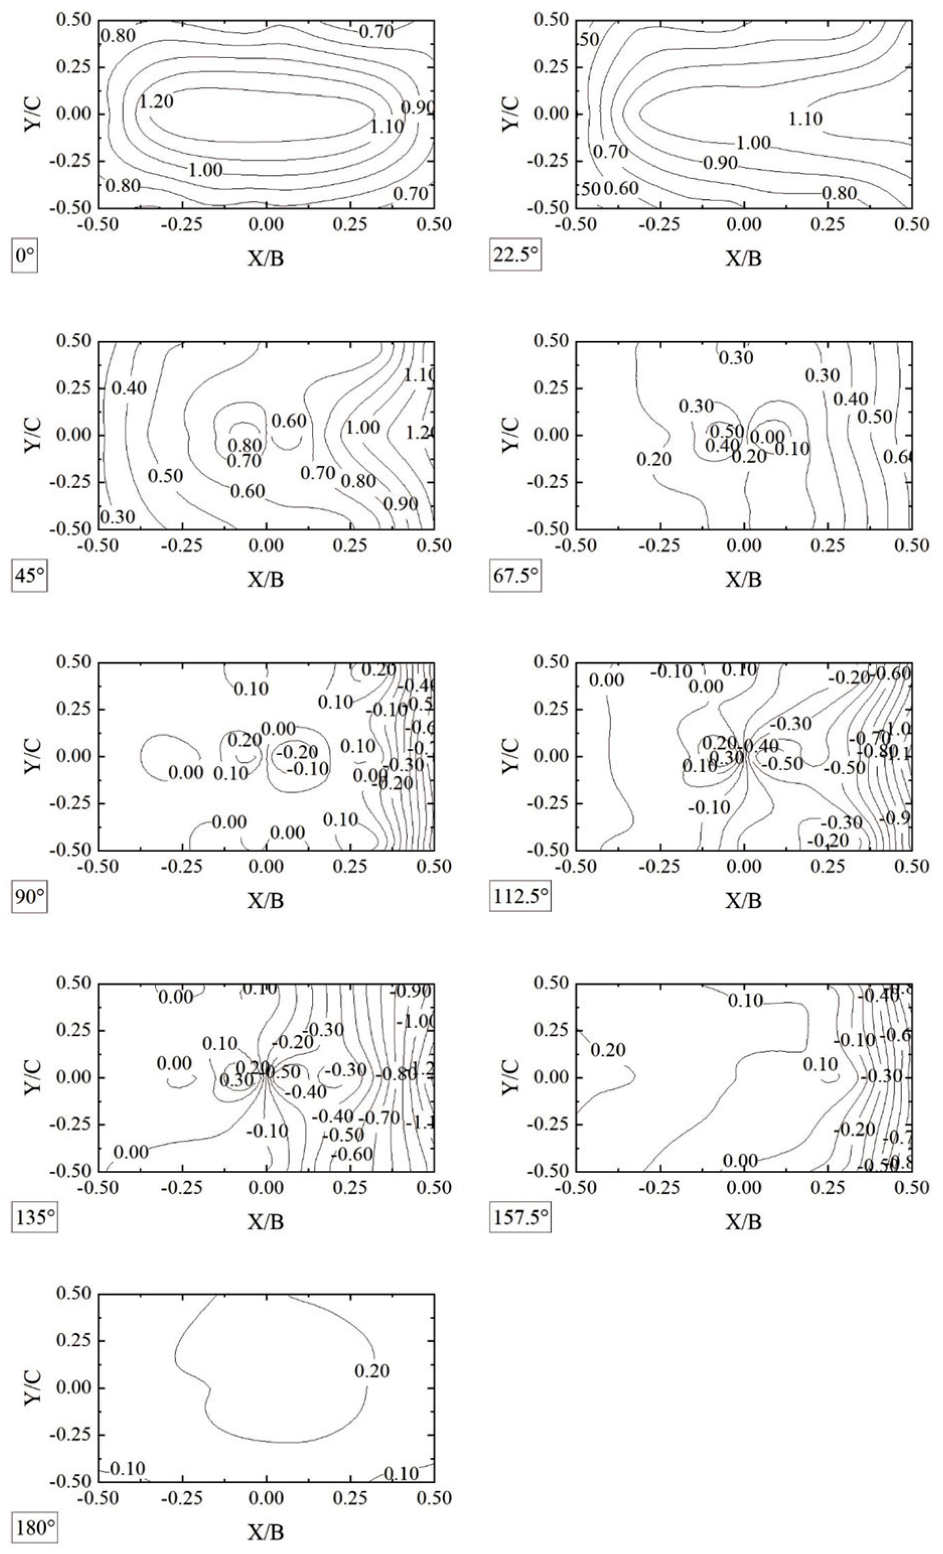
Distribution of local wind pressure coefficient on panel for the single-column double-panel billboard model.
In the 0° wind direction case, the distribution of local wind pressure coefficient is essentially symmetrical from top to bottom and from left to right. The local wind pressure coefficient in the central part of the panel is the maximum, gradually decreasing toward the surrounding regions, and the local wind pressure coefficients at the corners of the panel are the minimum. The local wind pressure coefficients are all positive, ranging from 0.64 to 1.27.
In the 22.5° wind direction case, the region with the maximum local wind pressure coefficient moves from the center to the right (toward the wind direction) to the edge of the panel, and the contour lines change from closed loops to open ones accordingly. The local wind pressure coefficients decrease from the right (toward the wind direction) to the left (away from the wind direction). They are all positive, with a distribution range of 0.46 to 1.16.
In the 45° wind direction case, the distribution pattern of local wind pressure coefficient is similar to that of the 22.5° wind direction case. But the local wind pressure coefficients decrease from the right (toward the wind direction) to the left (away from the wind direction) with a slight undulation and the distribution range becomes wider. They are all positive, with a distribution range between 0.25 and 1.22.
In the 67.5° wind direction case, the distribution pattern of local wind pressure coefficient is similar to that of the 45° wind direction case. The local wind pressure coefficients are still all positive, but the values decrease prominently, with a distribution ranging from 0.05 to 0.65.
In the 90° wind direction case, the airflow separates as it passes over the billboard model, creating a vortex at the leading edge and a negative pressure zone. The local wind pressure coefficients are negative and large in absolute value in the right (toward the wind direction) 1/8 region of the panel, and predominantly positive but small in magnitude in absolute value in the rest 7/8 region. The local wind pressure coefficients are distributed between −0.75 and 0.24.
In the 112.5° wind direction case, the distribution pattern of local wind pressure coefficient is similar to that of the 90° wind direction case. The range of the negative pressure zone at the right (toward the wind direction) side of the panel expands toward the middle of the panel and the coefficients increase in absolute value, while the range of the positive pressure zone decreases and the coefficients just change a little in value. The local wind pressure coefficients are distributed between −1.19 and 0.25.
In the 135° wind direction case, the distribution pattern of local wind pressure coefficient is similar to that of the 112.5° wind direction case. The range of the negative pressure zone at the right (toward the wind direction) side of the panel further expands to occupy 1/2 region of the panel, with a slight increase in the absolute value, while the range of the positive pressure zone further reduces, with a little change in the value. The local wind pressure coefficients are distributed between −1.28 and 0.27.
In the 157.5° wind direction case, compared with the previous case, the range of the negative pressure zone at the right (toward the wind direction) side of the panel reduces to 1/4 of the panel, and the absolute values decrease; the range of the positive pressure zone expands, but the values change a little. The local wind pressure coefficients are distributed between −0.83 and 0.21.
In the 180° wind direction case, compared with the previous case, the negative pressure zone disappears, and the local wind pressure coefficients are all positive but smaller in absolute value, with a distribution between 0.09 and 0.30.
Figure 9 is the distribution of local wind pressure coefficient on panel for the single-column triple-panel billboard model. When the wind angle is less than 90°, the values and the distribution pattern of local wind pressure coefficient of the single-column triple-panel billboard model are basically the same as that of the single-column double-panel billboard model, and are therefore omitted here. In the 90° wind direction case, the local wind pressure coefficients show a significant difference, which mainly is that the absolute values of the local wind pressure coefficients of the negative pressure zone at the right (toward the wind direction) side of the panel is much smaller. The local wind pressure coefficients are distributed between −0.32 and 0.34. This is mainly due to the fact that the angle between the two adjacent panels is only 60° and the bending of the streamline is relatively gentle compared to the freestanding column two-panel billboard model. In the 120° wind direction case, the local wind pressure coefficients are positive in most of the regions except for a few regions where they are negative, distributed between −0.08 and 0.25.

Distribution of local wind pressure coefficient on panel for the single-column triple-panel billboard model.
Extreme value of local wind pressure coefficient on panel
Tearing damage and connection failure of the panel are closely related to the peak wind pressure at local areas on the panel. The peak (maximum and minimum) local wind pressure coefficients are obtained from all measurement points for each model.
The extreme value of local wind pressure coefficient on panel for the floor-standing single-panel billboard model is showed in Figure 10. In the 0°–67.5° wind direction cases, the minimum local wind pressure coefficients are basically all greater than 0, indicating that the panel is primarily subjected to positive pressure. In the 45° wind direction case, the maximum local wind pressure coefficient reaches an extreme positive value (0.96), and in the 90° wind direction case, the minimum local wind pressure coefficient reaches an extreme negative value (−0.85).

Extreme value of local wind pressure coefficient and average wind pressure coefficient on panel for the floor-standing single-panel billboard model.
The extreme value of local wind pressure coefficient on panel for the single-column double-panel billboard model is showed in Figure 11. In the 0°–67.5° wind direction cases, the minimum local wind pressure coefficients are greater than 0, which means that the entire panel is subjected to positive pressure. In the 0° wind direction case, the maximum local wind pressure coefficient reaches the extreme positive value (1.27); in the 45° wind direction case, the maximum local wind pressure coefficient reaches the second extreme positive value (1.22); in the 135° wind direction case, the minimum local wind pressure coefficient reaches the extreme negative value (−1.28). In the 90°–180° wind direction cases, the maximum local wind pressure coefficients change very little, all remaining within the range of 0.20–0.30.

Extreme value of local wind pressure coefficient and average wind pressure coefficient on panel for the single-column double-panel billboard model.
The extreme value of local wind pressure coefficient on panel for the single-column triple-panel billboard model is showed in Figure 12. In the 0°–60° wind direction cases, the minimum local wind pressure coefficients are greater than 0, which means that the entire panel is subjected to positive pressure. The maximum local wind pressure coefficient reaches the extreme positive value (1.39) in the 45° wind direction case, while the minimum local wind pressure coefficient reaches the extreme negative value (−0.32) in the 90° wind direction case.

Extreme value of local wind pressure coefficient and average wind pressure coefficient on panel for the single-column triple-panel billboard model.
The extreme local wind pressure coefficients of the three billboard models have common laws. The maximum local wind pressure coefficient basically reaches the extreme positive value in the 45° wind direction case. In the 0°–90° wind direction cases, the minimum local wind pressure coefficient decreases with the increase of wind angle, and its value is basically greater than 0 when the wind angle is less than 67.5°, that is, the panel is basically subjected to all positive pressure.
Average wind pressure coefficient on panel
The overall stability of the billboard structure and the buckling damage of the support are closely related to the wind pressure on the panel as a whole. The average wind pressure coefficient for the panel is calculated by weighting the local pressure at each measurement point by its tributary area. The average wind pressure coefficient of the panel is defined as:

where
The average wind pressure coefficient on panel for the floor-standing single-panel billboard model is shown in Figure 10. The average wind pressure coefficient on panel for the single-column double-panel billboard model is shown in Figure 11. The average wind pressure coefficient on panel for the single-column triple-panel billboard model is shown in Figure 12.
For all the three billboard models, the average wind pressure coefficient is the greatest in the 0° wind direction case, with values of 0.67 for the floor-standing single-panel billboard, 0.95 for the single-column double-panel billboard, and 0.89 the single-column triple-panel billboard, respectively. As the wind angle increases, the average wind pressure coefficient gradually decreases.
The average wind pressure coefficient for the floor-standing single-panel billboard model is the minimum in the 90° wind direction case, which is about 0. The average wind pressure coefficient for the single-column double-panel billboard model is the minimum and negative in the 135° wind direction case, that is, it reaches the extreme negative pressure, about −0.26. The average wind pressure coefficient for the single-column triple-panel billboard model basically reaches the minimum value in the 75° to 120° wind direction cases, but it is still positive.
Analysis and discussion
The wind pressure distribution characteristics observed in the three typical billboard models, as well as the extreme value laws, are inherently linked to key aerodynamic phenomena, such as flow separation, vortex generation and multi-panel flow interference. These phenomena further explain the differences in wind load behavior across configurations.
For the floor-standing single-panel billboard, the symmetrical positive pressure distribution at 0° wind direction (local wind pressure coefficient: 0.32–0.76) results from direct flow impingement and stagnation on the windward face. The highest pressure at the lower center is attributable to the ground effect, which constrains flow diversion and enhances stagnation. As the wind angle increases to 45°, the high-pressure zone shifts toward the wind direction, reaching an extreme positive coefficient of 0.96. This shift is driven by the redirection of the incoming flow, which concentrates kinetic energy on the windward edge of the panel, thereby reducing flow stagnation at the center and enhancing pressure accumulation on the side facing the wind. When the wind angle reaches 90°, the emergence of a significant negative pressure (minimum coefficient: −0.85) in the right 1/8 region of the panel is attributed to flow separation at the leading edge (wind-facing edge) of the panel. As the flow encounters the sharp edge of the panel, it cannot follow the contour and separates, forming a shear layer and a trailing vortex. This separation vortex creates a low-pressure recirculation zone immediately downstream of the leading edge, explaining the strong suction on the rightmost portion of the panel. The remaining 7/8 region maintains weak positive pressure due to the partial attachment of the deflected flow.
For the single-column double-panel billboard, the consistency of wind pressure distribution with the single-column triple-panel model at wind angles < 90° indicates that the two configurations experience similar flow attachment behaviors under low wind-angle conditions. At 0°, the high central positive pressure (coefficient: 0.64–1.27) results from uniform flow impingement on the front panel, with minimal interference between the two panels. As the wind angle increases to 45°, the high-pressure zone migrates to the windward edge and exhibits slight undulations in the pressure gradient. This undulation is caused by weak flow interference between the two adjacent panels: the flow passing over the windward panel generates a small-scale secondary flow that interacts with the oncoming flow toward the leeward panel, leading to local pressure fluctuations. When the wind angle exceeds 90° (e.g. 112.5° and 135°), the expansion of the negative pressure zone (extreme coefficient: −1.28 at 135°) and the increase in absolute value are dominated by vortex interaction. The leading edge of the windward panel induces primary flow separation, generating a shedding vortex that propagates toward the leeward panel. This vortex merges with the secondary separation vortex formed at the leeward panel’s edge, intensifying the low-pressure region and expanding its coverage to 1/2 of the panel surface. At 180°, the disappearance of negative pressure is due to the flow fully attaching to the back of the panel (now the windward side), eliminating separation and vortex effects.
For the single-column triple-panel billboard, the significantly smaller absolute value of the negative pressure coefficient (−0.32 at 90°) compared to the double-panel model (−0.75 at 90°) stems from the 60° angle between adjacent panels, which modulates flow behavior through gentle streamline bending. The narrow gap between panels constrains the formation of large-scale separated flow; instead, the flow undergoes gradual deflection along the panel surfaces, reducing the intensity of vortex generation. This mild flow interference prevents the accumulation of low pressure, resulting in weaker negative pressure and a narrower negative pressure zone. Additionally, the maintenance of positive average wind pressure across all wind angles (minimum: −0.08) indicates that the triple-panel configuration’s multi-surface flow attachment effectively offsets the negative pressure from local separation, enhancing overall aerodynamic stability.
Due to aerodynamic interference, single-column double-panel and triple-panel billboards exhibit more complex behaviors than floor-standing single-panel billboards. In the 0°–67.5° wind angle range, both multi-panel configurations show similar pressure distributions to the single-panel case, indicating that interference effects are minimal when the flow approaches nearly face-on. The primary panel effectively shields the secondary ones, and the flow remains largely attached. The critical difference emerges at higher wind angles. For the double-panel billboard at 135°, the extreme negative local pressure coefficient of −1.28 is a consequence of intense vortex interaction. The windward panel acts as a vortex generator. The flow separating from its windward edge forms a strong, organized vortex that impinges directly upon the leeward panel. This vortex, combined with the separation vortex from the leeward panel’s own windward edge, creates a merged, intensified low-pressure region, expanding the area of significant suction. In contrast, the triple-panel configuration exhibits a markedly subdued negative pressure (minimum coefficient: −0.32 at 90°). The 60° angle between adjacent panels promotes a fundamentally different flow pattern: gentle streamline bending instead of abrupt separation. The narrow gaps between panels constrain the flow, forcing it to follow a sinuous or tortuous path, thereby reducing flow separation. This constrained flow undergoes a series of mild deflections, inhibiting the formation of large-scale, energetic separation vortices. The resulting weaker vortices generate less intense suction, leading to the observed reduction in negative pressure extremes. Furthermore, the presence of multiple surfaces allows for flow reattachment on downstream panels, which helps to maintain a positive average pressure across the structure, enhancing overall aerodynamic stability.
The aerodynamic interpretations above have direct engineering implications:
Local Failure versus Global Stability: The extreme local pressures, driven by vortex formation at oblique angles, are the primary cause of panel tearing and connection failures. In contrast, the overall structural stability is more influenced by the average pressure, which is buffered by attached flow components. This explains why localized damage is more prevalent than global collapse.
Configuration Optimization: The findings suggest that designs incorporating gentler angles between panels (as in the triple-panel case) can effectively mitigate destructive vortex-induced suction forces by promoting smoother airflow and reducing flow separation.
Code Development: Current codes, which often specify a single net pressure coefficient, fail to capture these critical local effects and configuration-specific variations. The results advocate for incorporating separate, more stringent local pressure coefficients for critical regions like panel edges, particularly for multi-panel billboards at wind angles between 45° and 135°.
Conclusion
As an important part of urban infrastructure, the wind safety of outdoor billboards is directly related to public safety and economic losses. To address the safety hazards of coastal outdoor billboards under extreme wind disasters and the limitations of existing design codes, this study selects three typical structural forms based on the current common urban outdoor billboards and signboards, including: floor-standing single-panel, single-column double-panel, and single-column triple-panel configurations, to simplify and produce scale rigid models. The wind tunnel test was conducted to investigate the differences in the wind pressure and its distribution among the three types of billboards. The main conclusions are as follows:
The high pressure zone on windward panel shifts toward the wind direction with the increasing wind angle.
When the wind angle is less than 90°, the local wind pressure coefficient and its distribution on the panel of the single-column double-panel billboard model and the single-column triple-panel billboard model are basically the same.
When focusing on the local wind pressure on panel, the most unfavorable wind angle of positive pressure is 45°, and the most unfavorable wind angle of negative pressure is 90°. The maximum positive and negative values of local wind pressure coefficients on panel for the floor-standing single-panel billboard model are 0.96 and −0.85 respectively; the maximum positive and negative values of local wind pressure coefficients on panel for the single-column double-panel billboard model are 1.27 and −1.28 respectively; the maximum positive and negative values of local wind pressure coefficients on panel for the single-column triple-panel billboard model are 1.39 and −0.32 respectively. The extreme local negative pressure (−1.28) for the double-panel model at 135° is a consequence of intense vortex interaction, while the subdued negative pressure (−0.32) for the triple-panel model results from gentle streamline bending.
When focusing on the overall average wind pressure on panel, the average wind pressure coefficients of the floor-standing single-panel billboard model and the single-column triple-panel billboard model are positive in every wind direction case, and just that of the single-column double-panel billboard model shows negative sometimes. The most unfavorable wind angle for positive pressure is 0°, the maximum positive values of average wind pressure coefficient for the floor-standing single-panel billboard model, the single-column double-panel billboard model and the single-column triple-panel billboard model are 0.67, 0.95, 0.89 respectively. The extreme negative value of average wind pressure coefficient for the single-column double-panel billboard model is −0.26, and the corresponding most unfavorable wind angle is 135°.
Comparing with the ASCE 7-22 4 specified net pressure coefficient of 1.3 for signs and the GB50009-2012 5 equivalent, the overall average wind pressure coefficients for our models are lower (maximum 0.95). However, the local wind pressure coefficients significantly exceed these values (up to 1.39 and −1.28). This discrepancy explains why localized failures (e.g. panel tearing, connection failure) are more common in practice than overall structural collapse. Therefore, design codes should consider separate, more stringent local pressure coefficients for critical areas like panel edges, especially for multi-panel configurations at oblique wind angles.
Summary
This study bridges the gap between observed test data and aerodynamic theory, providing a mechanistic basis for optimizing billboard wind-resistant design (e.g. reinforcing edge regions prone to vortex-induced negative pressure, adjusting panel angles to mitigate separation).
However, it is important to note that this study employed rigid models and focused on time-average pressure. The effects of unsteady vortex shedding, dynamic response, and turbulence-structure interaction were not directly measured. Future work should incorporate high-frequency pressure scanners and particle image velocimetry (PIV) to resolve transient flow patterns and validate the vortex interaction mechanisms. Furthermore, the influence of the column and supporting structure on local flow diversion—especially for multi-panel billboards—warrants more detailed investigation, as these elements may introduce additional complexity to the wind-structure interaction.
Footnotes
Handling Editor: Divyam Semwal
Author contributions
Conceptualization, Wei-long Ni; Funding acquisition, Huai-feng Wang, Li Lin and Wei-long Ni; Investigation, Jia-bin Wang; Methodology, Huai-feng Wang; Project administration, Li Lin; Resources, Li Lin and Wei-long Ni; Software, Huai-feng Wang, Jia-bin Wang and Dandan Xia; Test, Dandan Xia and Jia-bin Wang; Visualization, Huai-feng Wang; Writing – original draft, Huai-feng Wang; Writing – review & editing, Huai-feng Wang; Supervision, Wei-long Ni.
Funding
The authors disclosed receipt of the following financial support for the research, authorship, and/or publication of this article: The authors would like to gratefully acknowledge the support from the Fujian Provincial Key Laboratory of Wind Disaster and Wind Engineering under Grant No. KF20250103.
Declaration of conflicting interests
The authors declared no potential conflicts of interest with respect to the research, authorship, and/or publication of this article.