
Abstract
The international standards for safety glass design have been limited to the use of a soft body impactor representing a human body to estimate the accidental collision resistance. However, UAVs have recently emerged as a new collision source due to their increasingly widespread use. An evaluation protocol for UAV collision is required to secure the safety of the glass used for structural cladding. In this paper, the collision mechanism of unmanned aerial vehicles (UAVs) onto glass panels is investigated by conducting experiments. We evaluate the impact forces of UAV collision on the glass panels and verify the numerical simulations by comparing the resultant forces from the experiments. Using the verified numerical simulation, 72 different collision conditions (changing the impact angles and velocities, respectively) are modeled, including extreme collision conditions that could be infeasible in the real experiments under manual control. Through this study, complicated collision mechanisms are clarified and elucidated. Additionally, specific collision conditions that induce maximum and minimum threats are identified, which should assist the design of future structural cladding glass systems and the UAV operation discipline in urban areas.
Introduction
Collision accidents by unmanned aerial vehicles (UAVs) have been reported more often as the UAVs have been increasingly used for a variety of purposes such as recreation, delivery, surveillance, rescue, and so forth. For instance, in October 2017, a SkyJet commercial airliner collided with a UAV during its landing in Quebec, Canada, and the concern about the aircraft collision accident with aerial vehicles arose very significantly. On the other hand, in September 2019, the Saudi Aramco oil processing facility in Saudi Arabia was attacked by UAVs, resulting in a fire that severely damaged the facility. Such UAV-related accidents may occur intentionally or accidentally, and those events might have the potential to cause serious casualties and damage in public. If these kinds of accidents happen unintentionally, those are by malfunctioning of sensors or circuits. Although the sense and avoid systems for UAVs have been developed and advanced significantly, the causes of malfunction of UAVs (e.g., low accuracy, high dependency on weather or illumination conditions, and acoustic delays) have not been completely resolved yet. 1 Furthermore, the aviation of commercial UAVs has still required control under human supervision. 2 Therefore, UAV collision has drawn significant research interest for last years, and the accurate estimation of the impact damage has become more important than ever.
Relevant studies have been conducted extensively on the risk evaluation for people and other aircraft, rather than for building materials and structures. For human safety, studies have been conducted to predict risk using a probabilistic method. Dalamagkidis et al. proposed a methodology for computing fatality rates caused by UAV ground impact. 3 Clothier et al. used the probability of fatality to estimate the risk of UAVs to people; this risk substantially depended on the population density of the specific area and the characteristics of the UAV.4,5 Anders proposed a threshold weight of 250 g for a UAV to cause severe harm to a human being and developed a preliminary methodology capable of computing the optimized flight path and altitude to minimize the probability of fatality.6,7 Stevenson et al. employed the mean time between failures (MTBF) widely used to measure the reliability of a hardware product or component to estimate the level of safety of ground impact risk. 8 These methodologies were, however, limited by incorrect assumptions and high uncertainty, particularly in a situation of insufficient data, inexperienced operation, and sophisticated UAV systems. 9 Such limits prevent theoretical models from precisely estimating the risk.
To overcome these limits, more direct methods have been proposed to measure the collision risk and estimate the quantitative risk by gauging the impact energy through UAV impact tests. For example, Koh et al. investigated the weight thresholds of UAVs of different weights and elevations into human crash-test dummies. 10 Campolettano et al. performed falling impact tests and airborne flight impact tests against a human dummy. 11 Both studies directly measured the impact energies, impact forces, and moments resulting from different types of UAVs by using accelerometers on the human dummies. The abbreviated injury scale and the head injury criterion were used to indicate the hazard levels of airborne and falling UAVs.
Concerns of airborne collision risk between a UAV and other aircraft (e.g., manned aircraft) have also garnered significant attention. Liu et al. investigated the dynamic response of UAV ingestion into a high-bypass commercial jet engine by using a computational method. 12 The European Aviation Safety Agency (EASA) and Lu et al. performed airborne collision tests to investigate the damage to cockpit windshields by UAV strikes.13,14 Meng et al. simulated the finite element (FE) model of the impact between a UAV and the leading edge of a commercial airliner horizontal stabilizer. 15
As aforementioned, most studies considered the risk of UAVs to people and other aircraft, whereas only a few have reported damages on structures. Research to estimate the structural damage caused by UAV collision is required to ensure safe flights in urban areas. The glass panel, a commonly used structural cladding in high-rise buildings, can severely injure people when broken. Accordingly, our previous study calculated the probability of glass breakage by the UAV through the collision tests. 16 Using the blunt criterion, 17 the probability function was devised by considering the dimensions of the targets, the mass of the UAV, and the impact velocity. However, in those collision tests, there was a limitations in reproducing various collision conditions: It was difficult to change the impact angle independently by manual controls because UAVs were restricted from exceeding a specific angle during the flights.
Extreme weather events (e.g., gusts and air drags) or malfunction of electrical components might, in fact, result in more various collision conditions that could be infeasible in real experiments. In those collision conditions, the impact angle no longer depends on the impact velocity and can be an independent variable. In order to control the variable easily, numerical modeling is very useful, and various collision scenarios are simulated in that the impact angle and the impact velocity can be varied independently.
In this study, a numerical framework is developed to investigate the collision responses of UAVs onto the glass panels. The developed methodology is verified by comparing the results from the experiments and simulations. After verification, we numerically investigate the collision mechanism of the UAV onto the glass panel under a variety of collision conditions. By changing the impact velocity and angle, 72 collision scenarios are modeled: impact angles from 0
International standards of safety glass
Several international standards are available for the evaluation of glass performance under impact loading. The main collision against glass panels for the structural cladding has occurred by accidental human impacts, and therefore, soft body impactors (e.g., a shot bag, a leather bag, or a twin tire) have been recommended for use in pendulum impact tests. The safety levels of glasses are classified by their performance in the impact test in which the impactor is lifted at a selected drop height (the point of release from the centerline of the impactor at rest) and is released to collide with glasses. Various levels of classification have been developed to help stakeholders define the level of safety and protect the selected safety glass at a specific location. The followings are the international standards for the safety glasses against impacts:
ANSI Z97.1-2015:
18
The American National Standard prescribes a leather bag filled with 2.4 mm-diameter lead shots as the impactor of the impact test. A total mass of 45 kg is dropped from different heights. Glass products are classified depending on the maximum drop height they can withstand without breaking. The drop heights for Classes A, B, and C are 1.22 m to 1.23 m, 0.46 m to 0.47 m, and 0.31 m to 0.32 m, respectively. BS EN 12600:2002:
19
The European Standard specifies a twin-tire impact test. In this test, the soft impactor of 50 kg is dropped from each drop height. The drop heights for Classes 1, 2, and 3 are 1.2 m, 0.45 m, and 0.19 m, respectively. ISO 29584:2015:
20
The International Organization for Standardization incorporates both of the aforementioned standards but prescribes different drop heights. A shot bag or a twin tire is used as the soft body impactor in the pendulum impact test.
It should be noted that such standards are limited in terms of impactor types because only soft impactors are utilized. The available standards hardly explore high stiffness impactors such as UAVs.
Collision behavior of UAV
The impact velocity and impact angle are decisive factors to determine the collision mechanism of UAV which is characterized by the extremely high impact loading and corresponding local high-stress by the rotors. In this study, the impact angle is defined as the pitch angle that means the angle at which the UAV is inclined with respect to the ground.
Unlike the impactors (i.e., a shot bag or twin tire) used in the glass impact tests, the UAV exhibits a more complicated collision mechanism due to multiple thrusts generated by the four rotors (two front rotors and two rear rotors). If the impact angle is 0

Collision sequence in order (a) to (c): (a) UAV with constant velocity and angle under force balance state just before collision, (b) the first collision by front rotors, and (c) the second collision by rear rotors.
By these consecutive impacts of the front and rear rotors, the kinetic energy of the UAV is transmitted to the target structure. Figure 1(b) shows the first collision by the front rotors: Some portion of the kinetic energy is stored into strain energy of the frame arms because the frame arms are bent in the elastic behavior. In Figure 1(c), following the first collision, the second collision by the rear rotors occurs: the stored strain energy in the frame arms as well as the kinetic energy of the rear rotors is transferred to the target structure.
Figure 1(a) shows the UAV right before the collision. With a constant velocity, the force equilibrium in the vertical direction considering the gravity and the rotor thrusts is expressed as


In the numerical simulation, the angular acceleration is reproduced by imposing the acceleration on the two rear rotors of the finite element model. By substituting multiplication of the rotor mass

Airborne collision tests
Experimental procedures
The DJI-F450 quadcopter was used as the collision source, and Figure 2 shows the assembly and components of the DJI F450. The UAV hardware was configured by assembling the kit of DJI F450 consisting of four frame arms, two frame boards, four rotors, four propellers, and four electronic speed controllers (ESC). On the bottom-frame-board, DJI Naza-M Lite flight controller and a TAROT 8-channel signal receiver in charge of control and communication of the UAV were installed. The GPS module is a device that maintains the altitude and position of the UAV and was installed on the frame arm to ensure good signal reception. A Lithium polymer battery, 14.8 V with a capacity of 1,550 mAh, was mounted on the top-frame-board. Each collision test requires a short flight time. Therefore, a battery with a relatively small capacity was used.

DJI-F450 quadcopter: (a) assembly and (b) its components.
The target structure, comprised of a single glass panel, two square-shaped steel frames, and a support structure, was designed and fabricated, as shown in Figure 3(a). The glass panel (1240 mm

(a) Target structure and (b) detail of glass panel assemblage.
Airborne collision tests between a UAV (Flame Wheel F450, DJI) and heat-strengthened glass panels (3 mm, 5 mm, and 8 mm of thickness) were performed, using the test apparatus shown in Figure 4. DJI F450 quadcopters weighing 0.903 kg were flown into the glass panel (C in Figure 4) inserted between two steel frames (B and D in Figure 4). The steel frames were fabricated to grasp the glass panel during the collision and to resist the large impact force from the UAV.

Schematic diagram of the UAV collision test apparatus: (A) six poles at intervals of 1 m to measure the impact velocity; (B) front steel frame; (C) glass panel with three different thicknesses; (D) rear steel frame; (E) dynamic force sensors at four corners; and (F) jig structure.
A high-speed camera (Phantom V611) was installed to record the collision behaviors between the UAVs and the targets at 6,900 frames per second (fps), and a digital camera was set up to measure the impact velocity and angle of the UAV by recording from the lateral side. The impact velocity was calculated by measuring the times at which the UAV flies over the six poles (A in Figure 4) separated by 1 m in front of the target.
Dynamic force sensors (PCB208C05, PCB Piezotronics, E in Figure 4) with a compressional force capacity of 22.24 kN were installed at the four corners between the rear steel frame (D in Figure 4) and the jig structure (F in Figure 4) as shown in Figure 5. When the force sensors were pressed by the transient impact load during the collision, an electrostatic charge proportional to the external force was generated yielding the voltage signal. This signal was transmitted to the dynamic data logger with a sampling rate of 5 kHz. A series of 65 collision behaviors between the UAV and the glass panels were recorded by the high-speed camera, and the time histories of the impact forces were obtained from the force sensors.
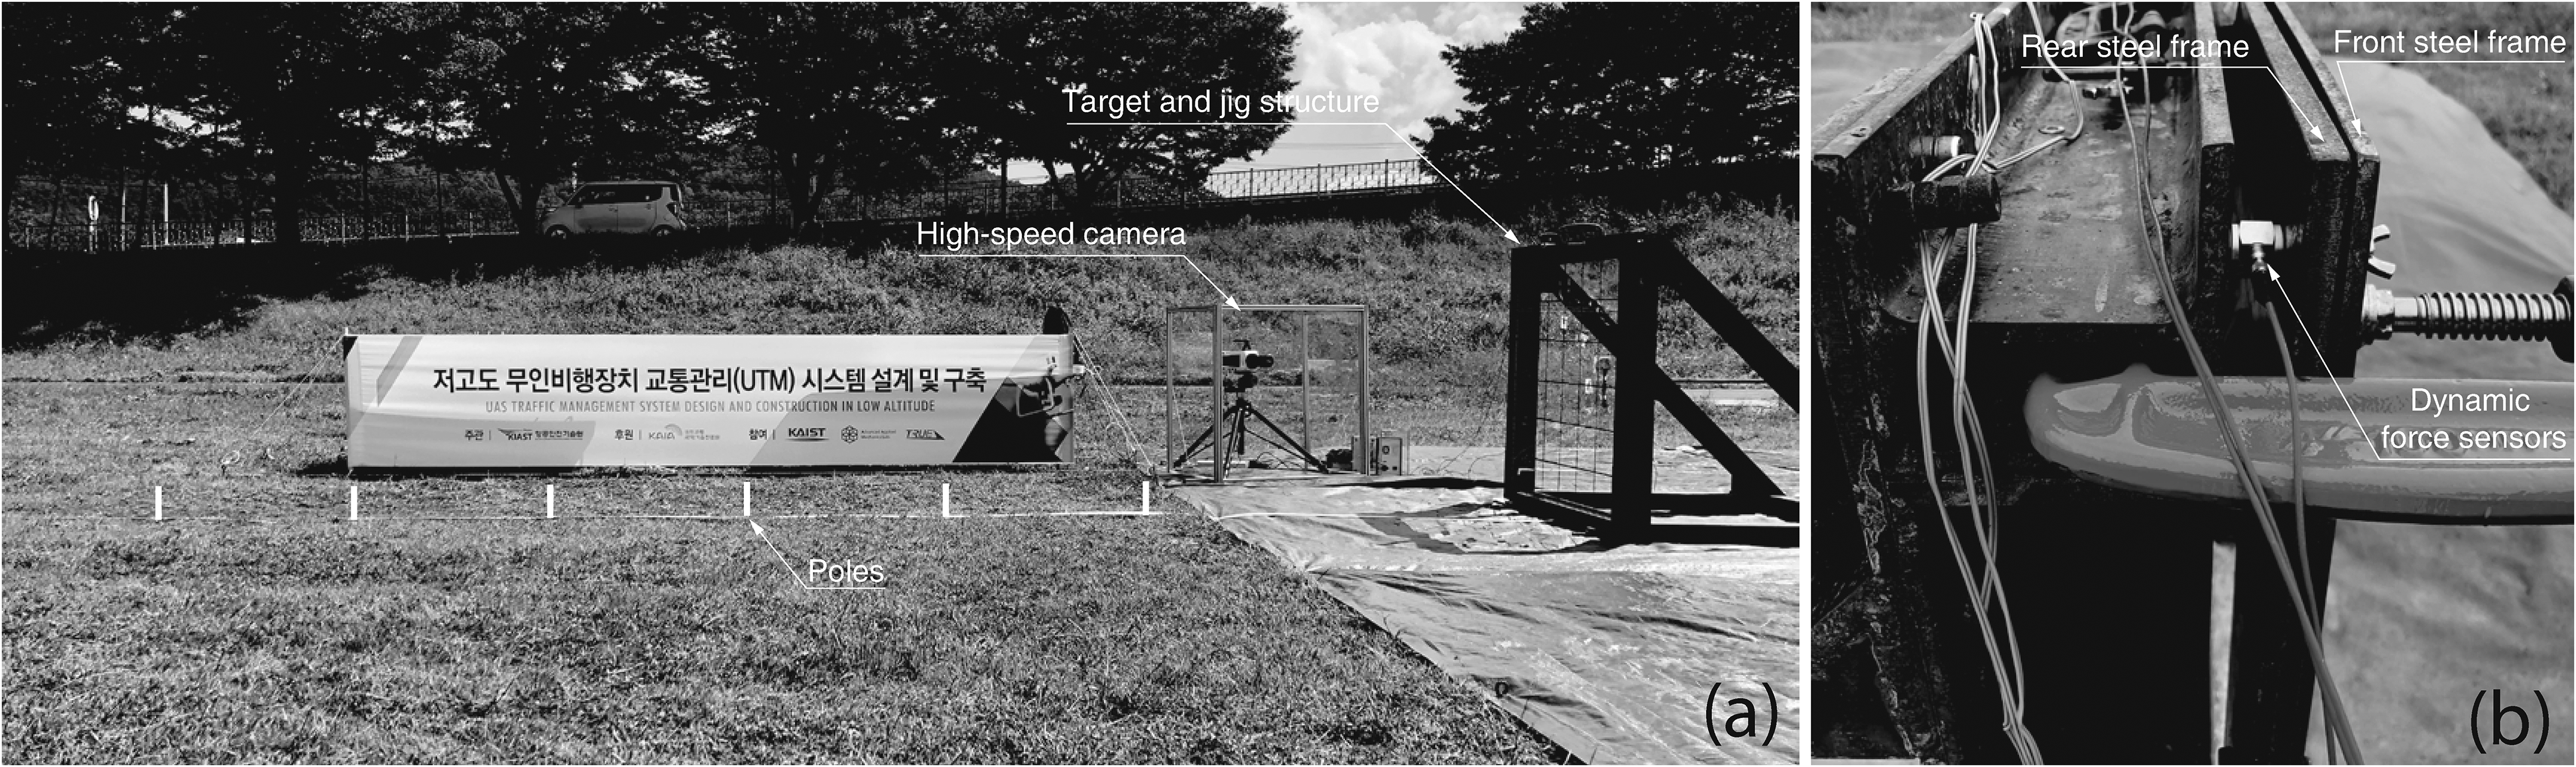
Experimental setup of the UAV collision test: (a) lateral view captured by the digital camera to measure the impact velocity and angle of the UAV; and (b) installation of dynamic force sensors at the four corners.
Collision experiments of UAVs on glass panels
The impact forces in the time domain were measured by changing the impact velocity of the UAV and the thickness of the glass panel, and then the peak impact forces were obtained through the measured impact forces in the time domain. Overall, the proportional relationship between the peak impact force and the impact velocity is observed as shown in Figure 6. The slight variations of the glass strength (e.g., by the temperature and humidity) and the fixity by the joints between the jig structure and the steel frames might have caused some difference in the peak impact forces at similar impact velocities. Particularly, in the case of 5 mm thickness glass with the impact velocities ranging from 8 m/s to 10 m/s, the deviation is wider than others.

Experimental results of the relationship between peak impact force and impact velocity for three types of glass (3 mm, 5 mm, and 8 mm). The blue squares and red circles denote selected experimental glasses for numerical verification and broken glasses, respectively. 16
When the glass was broken by the collision, the peak impact force is much smaller than others at similar impact velocities because a significant amount of the impact energy is dissipated into the fracture energy of the glass and kinetic energy of the fragments. In our previous study, 16 a function of the probability of glass breakage by using those broken cases has been derived with considering the breakage threshold velocity, the weight of the UAV, and the dimensions (width, height, and thickness) of the glass panel. However, the impact angle was not independently considered because the angle is automatically controlled according to a velocity in the GPS mode that makes the UAV is restricted from exceeding a specific angle during flights. By automatically controlling the angle, the UAV did not flip over and allowed stable flight, driving it to collide near the center of the glass panel. As shown in Figure 7, the impact angle is proportional to the impact velocity under the GPS mode. However, in fact, the impact angle might be an independent variable from the impact velocity because the sudden change in the flight direction can vary the impact angle.
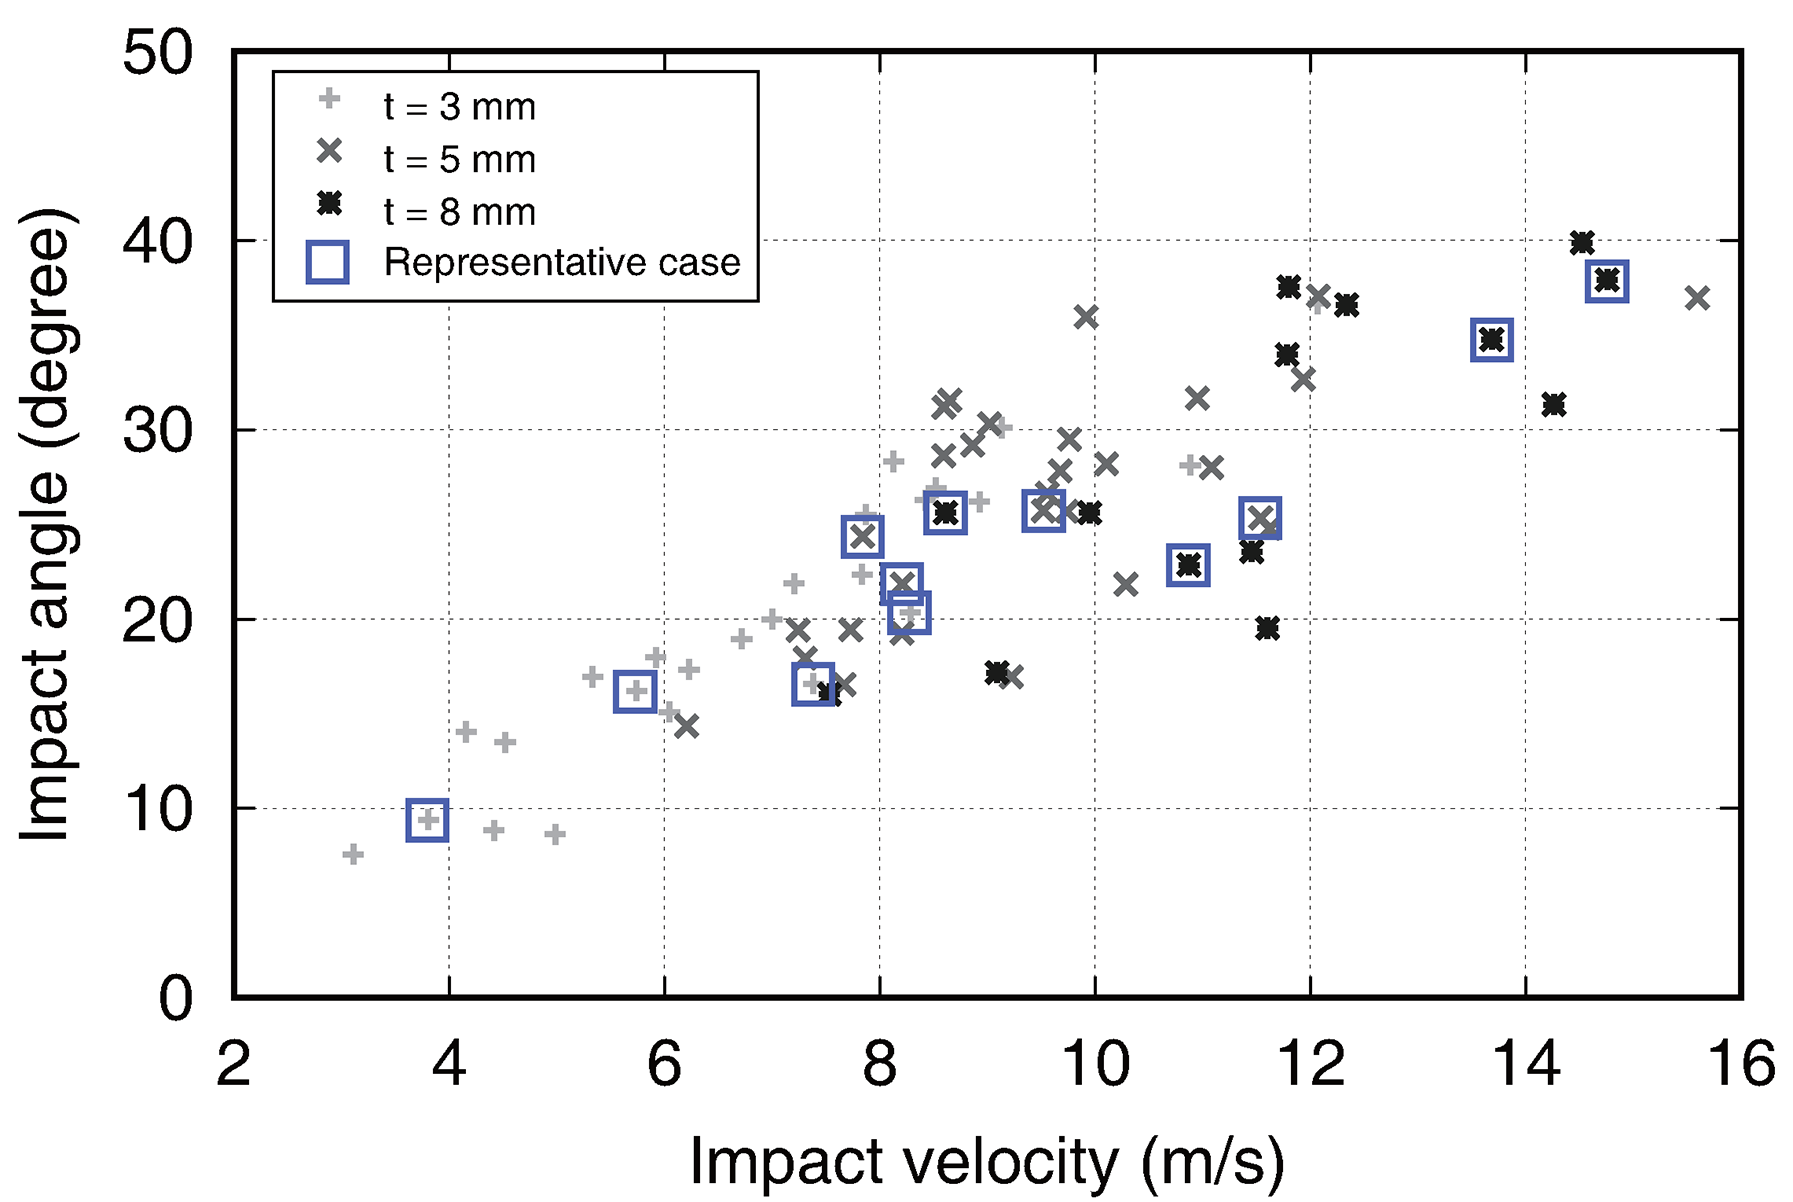
Proportional correlation of the impact angle and impact velocity obtained through UAV airborne collision tests. The blue squares denote selected experimental cases for numerical verification. 16
Through numerical modeling, desired collision conditions can be simulated by independently changing the variables (the impact velocity and angle). To verify the simulation results, the collision processes and the resultant force obtained in the collision tests are compared with those calculated in the simulations.
Glass failure by UAV collision
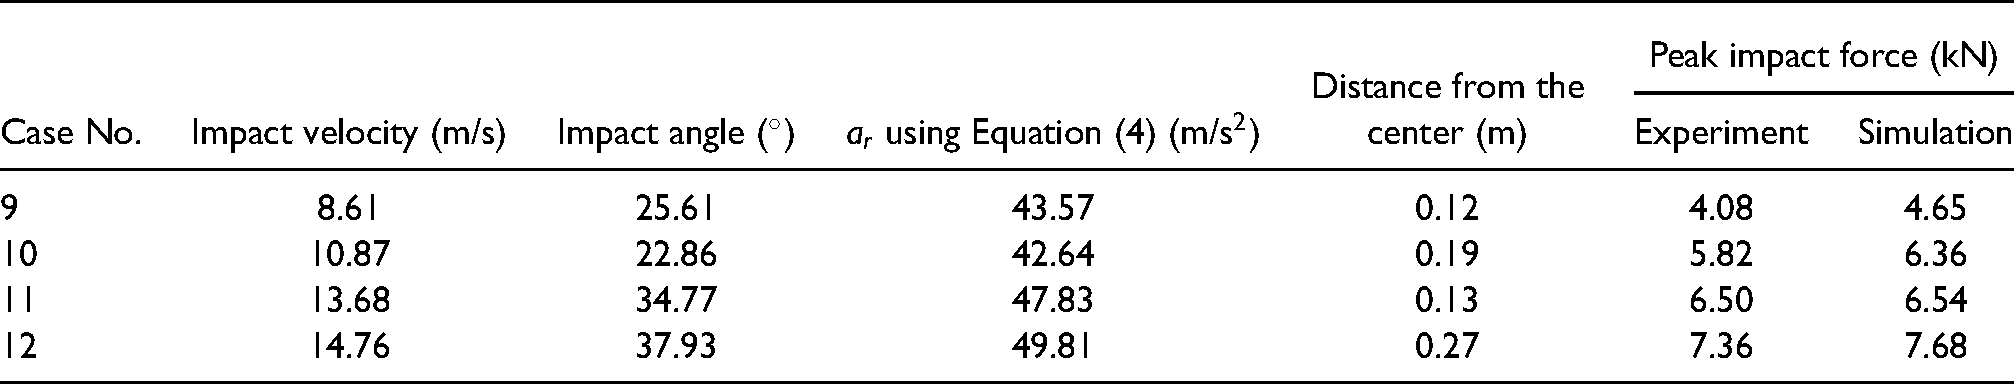
Glass panels were broken in 8 cases among a total of 65 collision cases. The glass breakage was caused by the impact of the front rotors or rear rotors. Figure 8 shows the high-speed images of glass breakage by the front and the rear rotors. Table 1 lists the details of the 8 broken cases including the impact velocity, the rotor inducing the breakage, and the glass thickness. The cases are numbered in order of the impact velocity, and the breakage occurred at the 3 mm and 5 mm-thick glass panels, except for the 8 mm-thick glass panel.

Examples of glass breakage by (a) the front rotors and (b) the rear rotors. Those case numbers are B-1 and B-6, respectively.
Details of glass breakage cases.

When the impact velocity was slower than 11 m/s (cases B-1 to B-4), either the front or rear rotors broke the glass randomly without any tendency: the rear rotors broke the glass in cases B-1 and B-4, but the front rotors broke the glass in cases B-2 and B-3. As the impact velocity was faster than 11 m/s (cases B-5 to B-8), only the rear rotors broke the glass, which also indicated that the glass panels withstood the impact of the front rotors. Through this observation, it should be noted that as the impact velocity increases, the impact force by the front rotors decreases, while the impact force by the rear rotors increases.
To clarify this finding, cases B-1 and B-6 with the same glass thickness of 3 mm but different impact velocities were compared. In case B-6, although the collision of the front rotors occurred, the rear rotors broke the glass panel at the impact velocity of 12.07 m/s. This indicates that the impact force by the front rotors was not large enough to break the glass. on the other hand, in case B-1, the glass was broken by the front rotors at the impact velocity of 8.93 m/s. Despite the lower impact velocity of case B-1 than case B-6, the impact force by the front rotors was larger in case B-1 than the force in case B-6.
Selection of experimental cases
The experimental data with high reliability and reproducibility was selected to verify numerical model because the experimental force data had a large deviation due to the variations of the glass strength and of the fixity by the joints. The impact velocity, collision coordinates on the glass panel, and glass thicknesses were considered simultaneously to select experimental cases.
First, we excluded 8 broken cases out of 65 cases prior to the selection because the impact energy of the UAV was incompletely transferred to the force sensors if the glass panel broke, and thus the impact force was underestimated, as shown in Figure 6. Therefore, the remaining 57 cases were eligible to be selected.
The numerical model should be verified for a wide variety of impact velocities. Thus, we selected impact velocities about 4, 6, 8, 10, 12, 14 m/s. Those velocities are listed in Table 2 and marked in Figure 6.
Selected experimental cases to verify numerical model.

The collision coordinates on the target were also considered in the selection. As the UAVs were manually controlled using a remote controller, it was difficult to make the UAVs hit into the exact center of the glass panel. Using the high-speed camera, the precise impact locations were identified for all cases, as shown in Figure 9, and the cases of which the impact locations were away from the center were excluded. Consequently, the distances between the center of the target and the impact locations within 0.2 m in each coordinate were selected and are listed in the fourth column of Table 2.
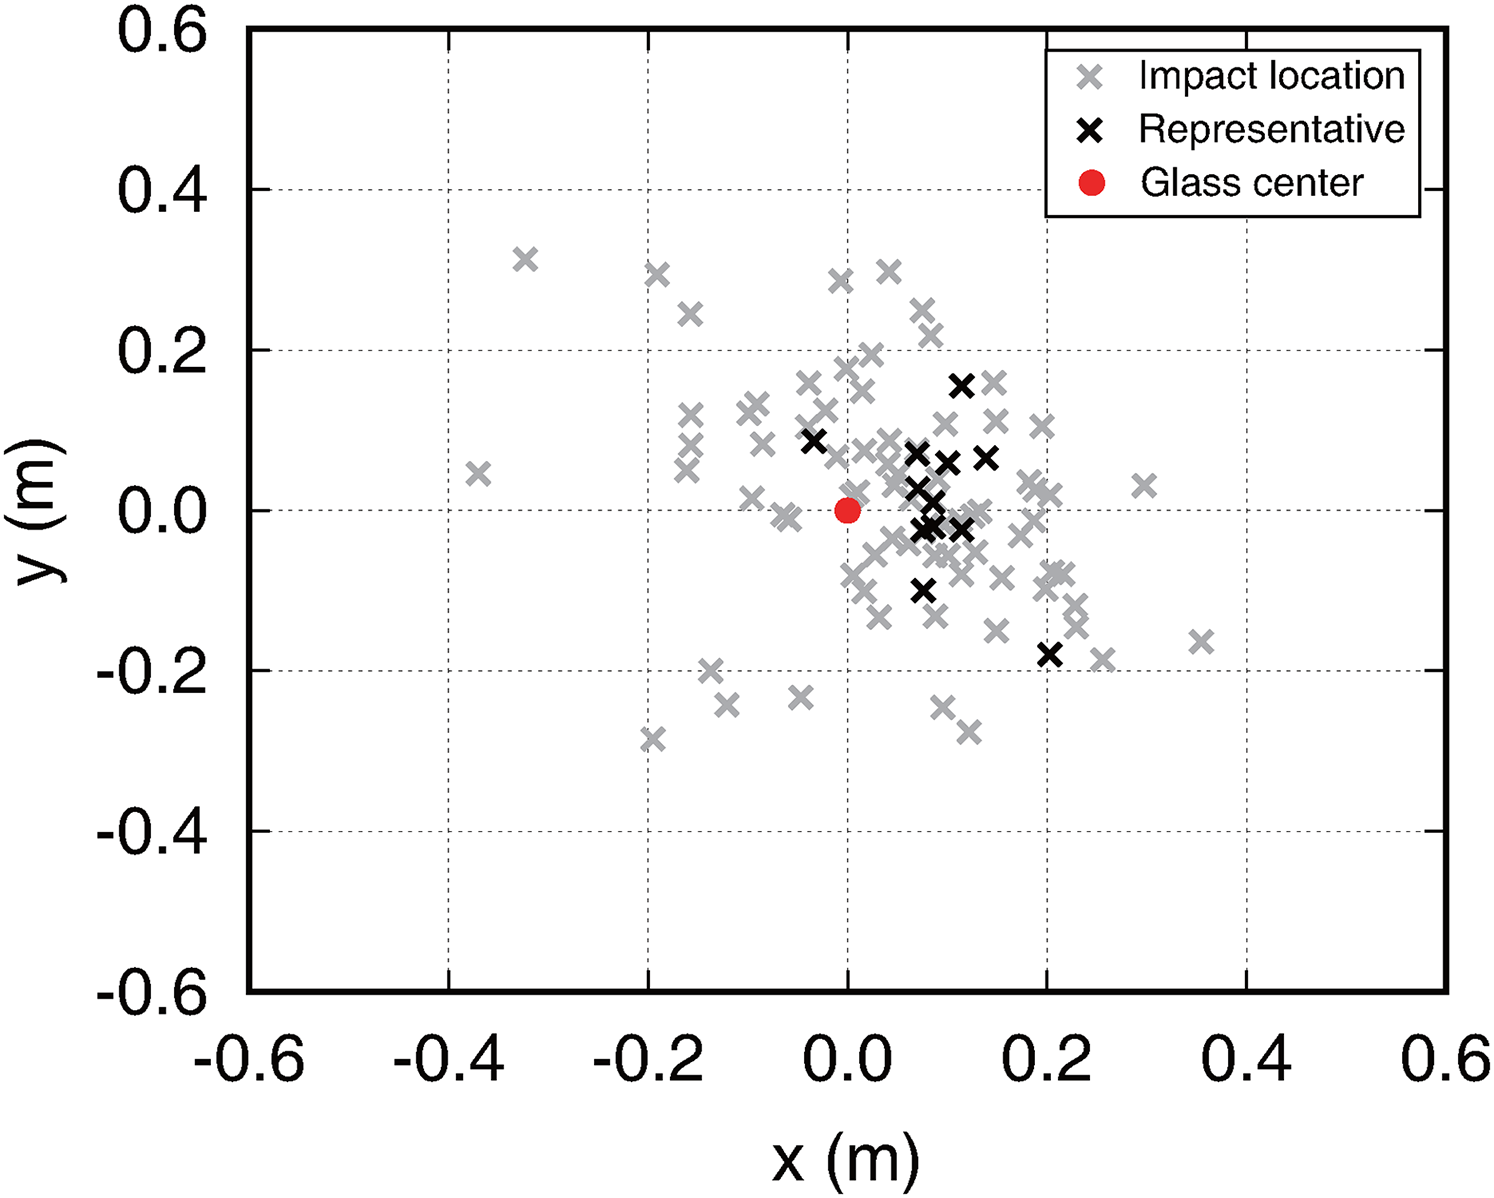
Coordinates of impact by UAVs on glass panels (1.24 m
For each thickness of the glass panel, four cases were evenly selected: cases 1 to 4 for the 3 mm, cases 5 to 8 for the 5 mm, and cases 9 to 12 for the 8 mm, as listed in Table 2. A wide range of the impact velocity was considered to the selection for each thickness, and velocities close to 4, 6, 8, 10, 12, 14 m/s were chosen.
By the selecting procedures aforementioned, 12 experimental cases were selected from 65 collision tests. The results of these cases were compared with the results of finite element simulations.
Finite element modeling
Numerical simulation has an advantage in the variable (the impact velocity and angle) control, and the influence of each variable on the collision threat can be investigated from the numerical results. Therefore, we conduct simulations under the different collision conditions using a commercial finite element analysis package LS-DYNA.
The geometric models of the UAV and the target structures are generated by using a computer-aided design software Solidworks. Some negligible components and trivial geometric parts of the UAV are modeled by adding the corresponding masses to the battery load in order to conserve the total mass and the location of the center of gravity, as shown in Figures 10(a) and 10(b). The trivial geometric parts are the signal receiver, GPS, NAZA-M Lite flight controller, four electronic speed controllers (ESC), as shown in Figure 2(b). The actual weights of the trivial parts are listed in Table 3. Instead of modeling the trivial parts, those corresponding weights are added to the battery weight. Therefore, the battery weight in the numerical model is increased by 112 g compared to the actual weight.

Finite element model of the UAV and target structure. (a) UAV discretized with 2-3 mm solid hexahedral elements; (b) four propellers discretized with 2 mm solid tetrahedral elements; (c) rear view of the target (glass panel and steel frames) discretized with 5 mm solid hexahedral elements and its boundary condition (BC); and (d) lateral view of both the UAV and target model with fixed BC.
Weights of UAV components.

The target models are also simplified by fixing the four nodes where the forces were measured rather than modeling the force sensors, as shown in Figures 10(c) and 10(d). The geometric models are then discretized into finite element models using a multi-disciplinary finite element pre-processor, Hypermesh. For the UAV model, the battery, frame arms, frame boards, and rotors are discretized with solid hexahedral elements, and the propellers are discretized with solid tetrahedral elements. Because the curved shape of propellers is challenging to discretize with hexahedral elements, the propellers are only part discretized with tetrahedral elements. The blade thickness of the propeller varies from 4 mm to 0.7 mm and becomes thinner from the center to the edge. Through the thickness, one element is used, so the length of the tetrahedral element also changes according to the thickness. The use of one element through the thickness is advantageous in terms of computational efficiency, but it is limited to accurately simulate the actual behavior such as bending and shear failure. As for the impact forces by the propellers, the effect on the collision is small and negligible. The rotational motion of the propellers is not simulated in the numerical models because the impact forces by the rotating propellers were approximately 50 N to 150 N, significantly smaller than the impact forces by the front and the rear rotors.
The target structure comprised of a front steel frame (1400 mm
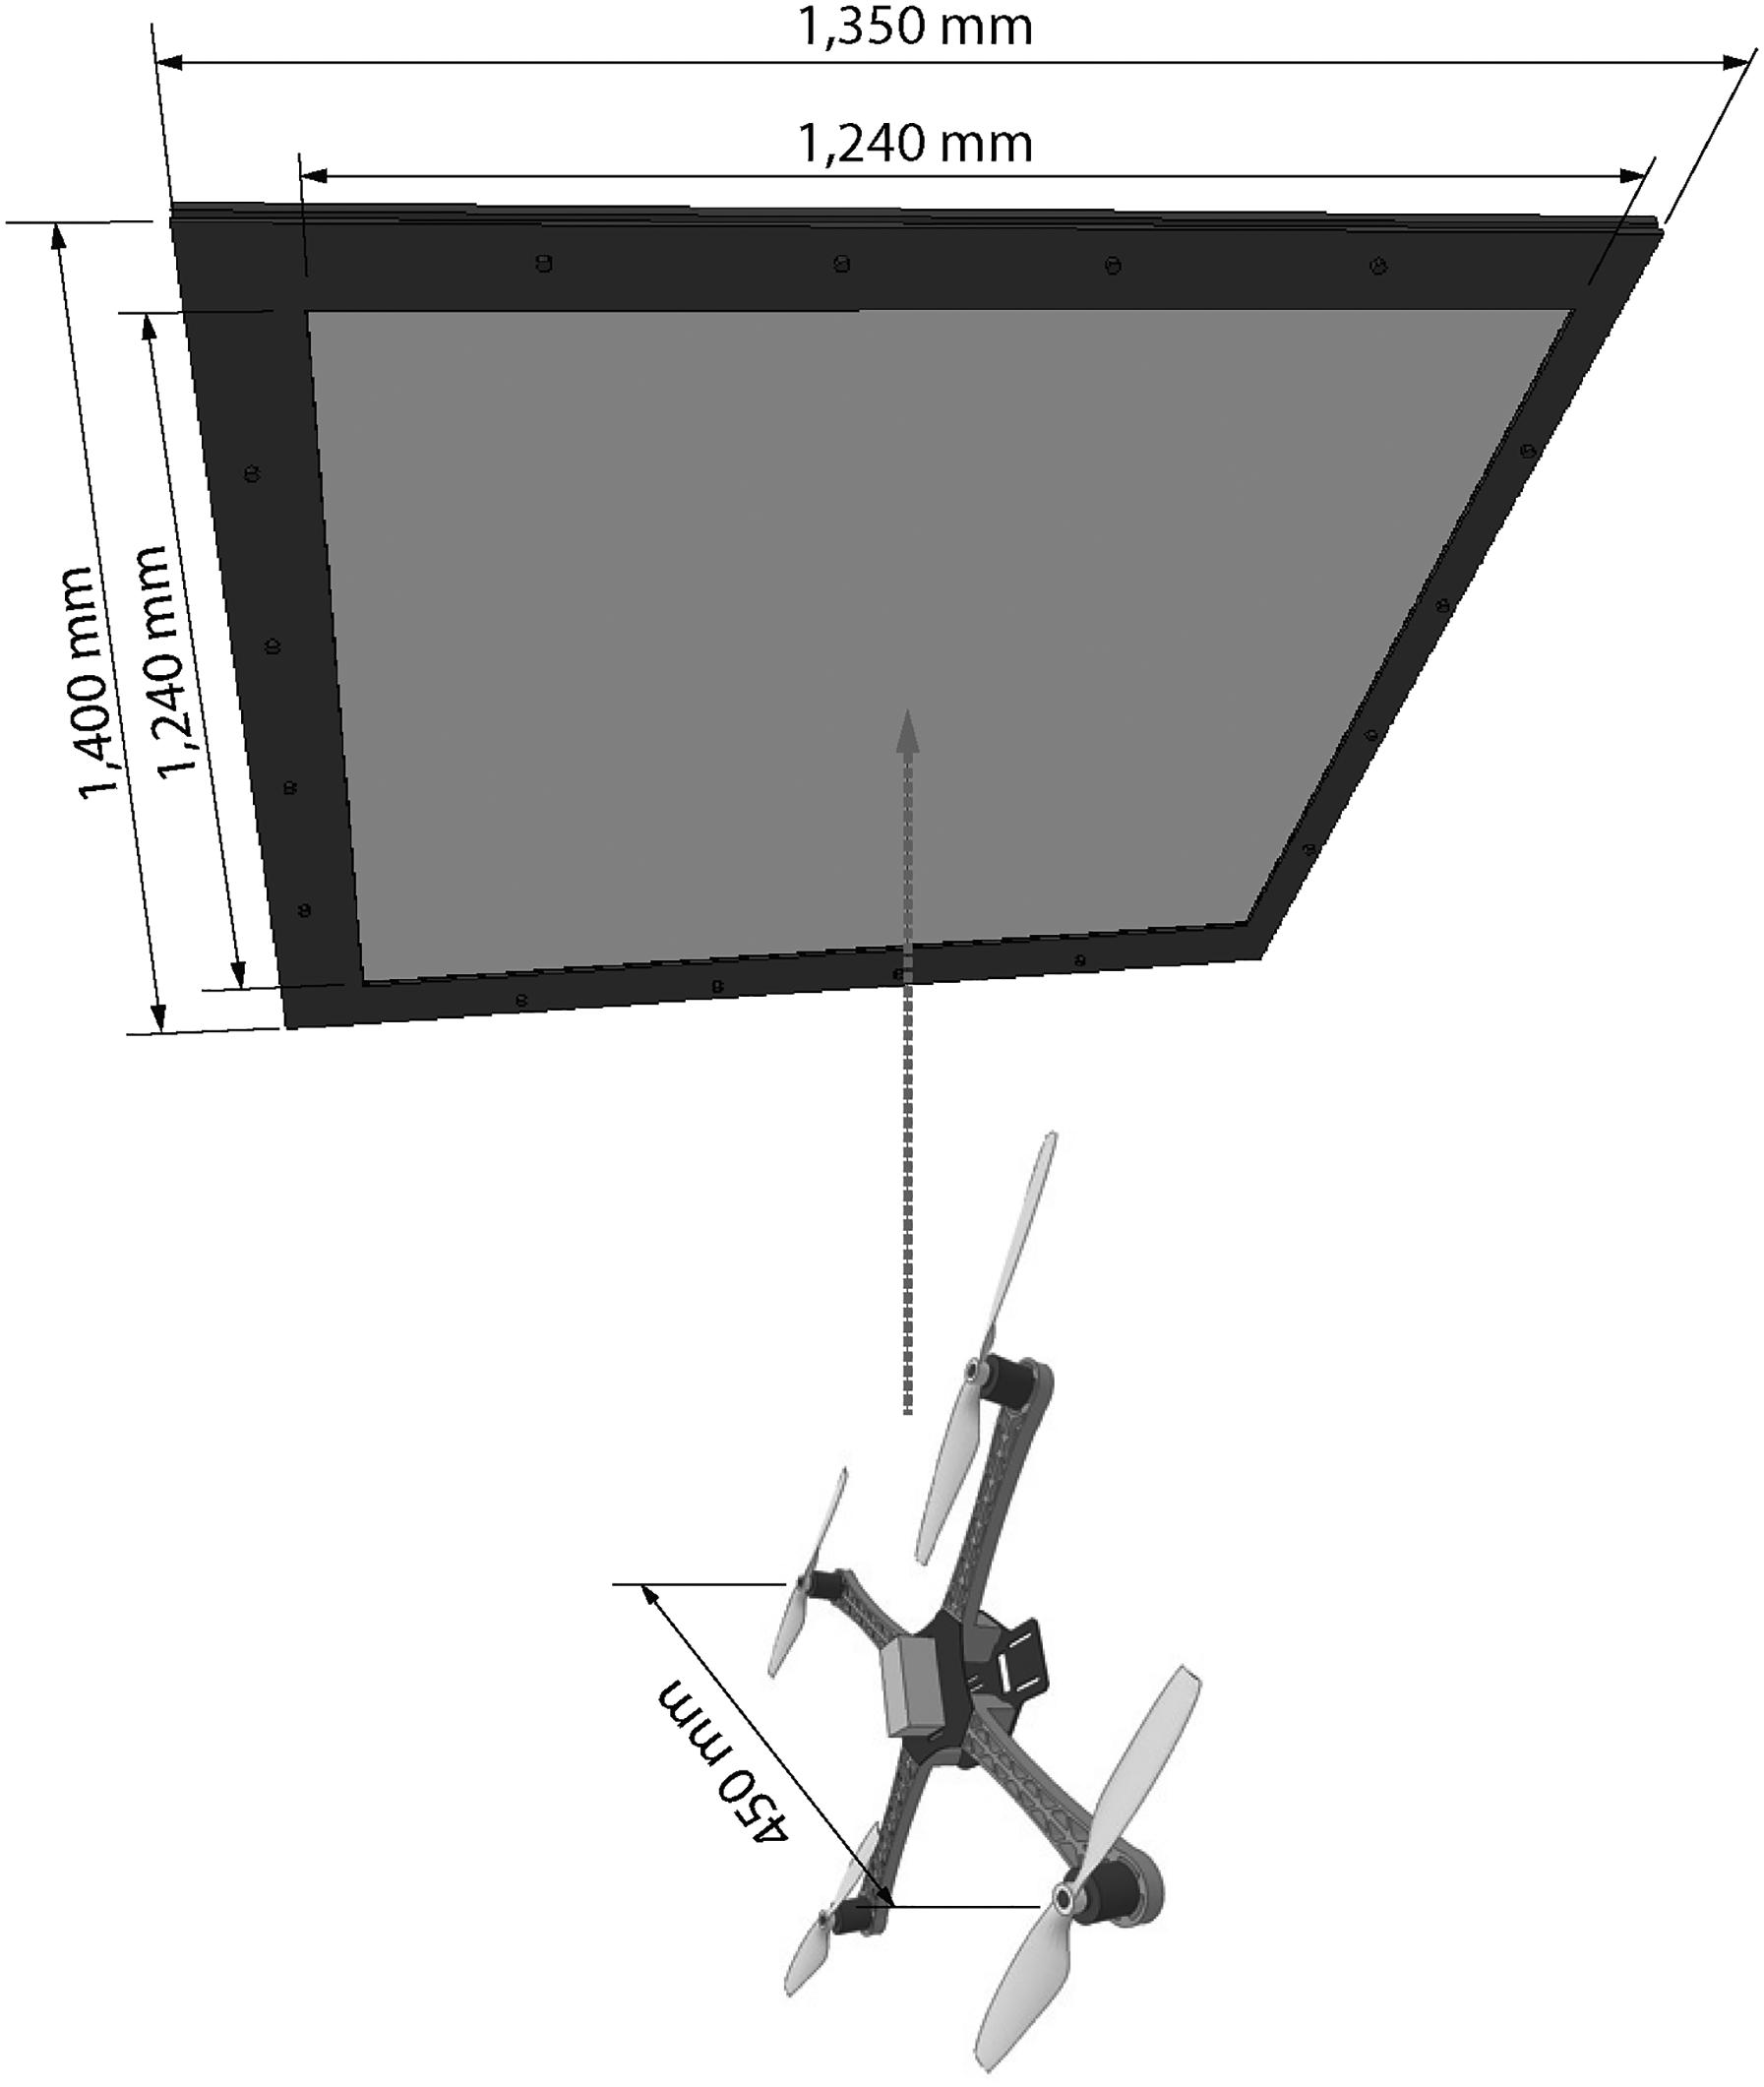
Dimensions of the UAV (wheelbase length = 450 mm) and the target structure comprised of front and rear steel frames (1,400 mm
Through the mesh sensitivity study by Meng et al., 15 it is proved that the average element dimension of 5 mm gives accurate results for modeling UAVs. Therefore, we generate a finite element model of UAV with elements that have an average dimension of 2–3 mm. The target structures are modeled with the elements of 5 mm in dimension.
As summarized in Table 4, the material models of UAV and target glass are assumed to be bilinear kinematic. However, for the steel frames in the target structure, an elastic material model is used because the material resists against the impact force and behaves within the elastic range. There are various parametric studies that predict glass failure. 23 The glass panel deforms according to the bilinear elasto-plastic constitutive relationship with an infinitesimally small plastic region in the stress-strain curve, and the ultimate tensile stress is very close to the yield stress under the impact loading. 26 The standards of material densities, Young’s moduli, and Poisson’s ratios of glasses are available in the literature, but the yield strength and failure strain are not standardized in the references. In this study, the widely used values of the yield strength and failure strain are used for glass models.21,22 In brittle materials, the tensile strengths might change more than Young’s moduli by the strain-rate effect.27,28 However, in this research, the strain rate is not large enough to alter the tensile strength. Therefore, constant Young’s modulus and tensile strength are used.
Material properties of the numerical model.

To calculate the total impact forces exerted on the target in the simulations, the nodal forces measured at the four fixed nodes are summed up together, instead of modeling the force sensors. The contact interaction between the UAV and the glass panel is imposed by the node-to-surface contact using the segment-based penalty method. 29 The collision simulations are performed by varying initial velocity and angle on the UAV model which is placed right in front of the target structure to reduce the computational time. For accurate simulation, the rear rotor’s thrust influenced by the impact angle is calculated by Equation (4) and is then imposed on the nodes corresponding to the two rear rotors.
Comparison of experimental and numerical results
The impact velocity and angle of the selected experimental cases are imposed as the initial velocity and tilt angle of the UAV numerical model, respectively. The UAV collisions are simulated against three types of glass panels with different thicknesses. Through the simulations, the collision processes are observed, and the impact forces in the time domain are measured to compare with those from experiments.
Figure 12 presents the collision processes captured in the numerical simulation and the experiment. The collision mechanism for both the simulation and the experiment is in general as follows: the front propellers and rotors firstly collide, and then the flip motion occurs; this flip motion causes the collision of rear propellers or rotors against the glass panel. The consecutive collisions of the front and rear rotors make impact loadings.

Images of the UAV colliding into the glass panel from the simulation and the experiment.
Figure 13(a) shows the stress distributions when the front rotors collide at t = 8 ms in Figure 12. By the front rotors’ collision, the two front-frame-arms are bent to the out-of-plane direction of the frame arms. This causes a strong tension along the top edges of front-frame-arms. Figure 13(b) shows the stress distribution at the rear rotors’ collision after the flip motion of the UAV at t = 31 ms in Figure 12. Because the rear rotors collide in the out-of-plane direction of frame arms, the bending behavior of the rear-frame-arms occurs in the out-of-plane direction, resulting in the high stress near the connection to the frame boards (the fixed end).
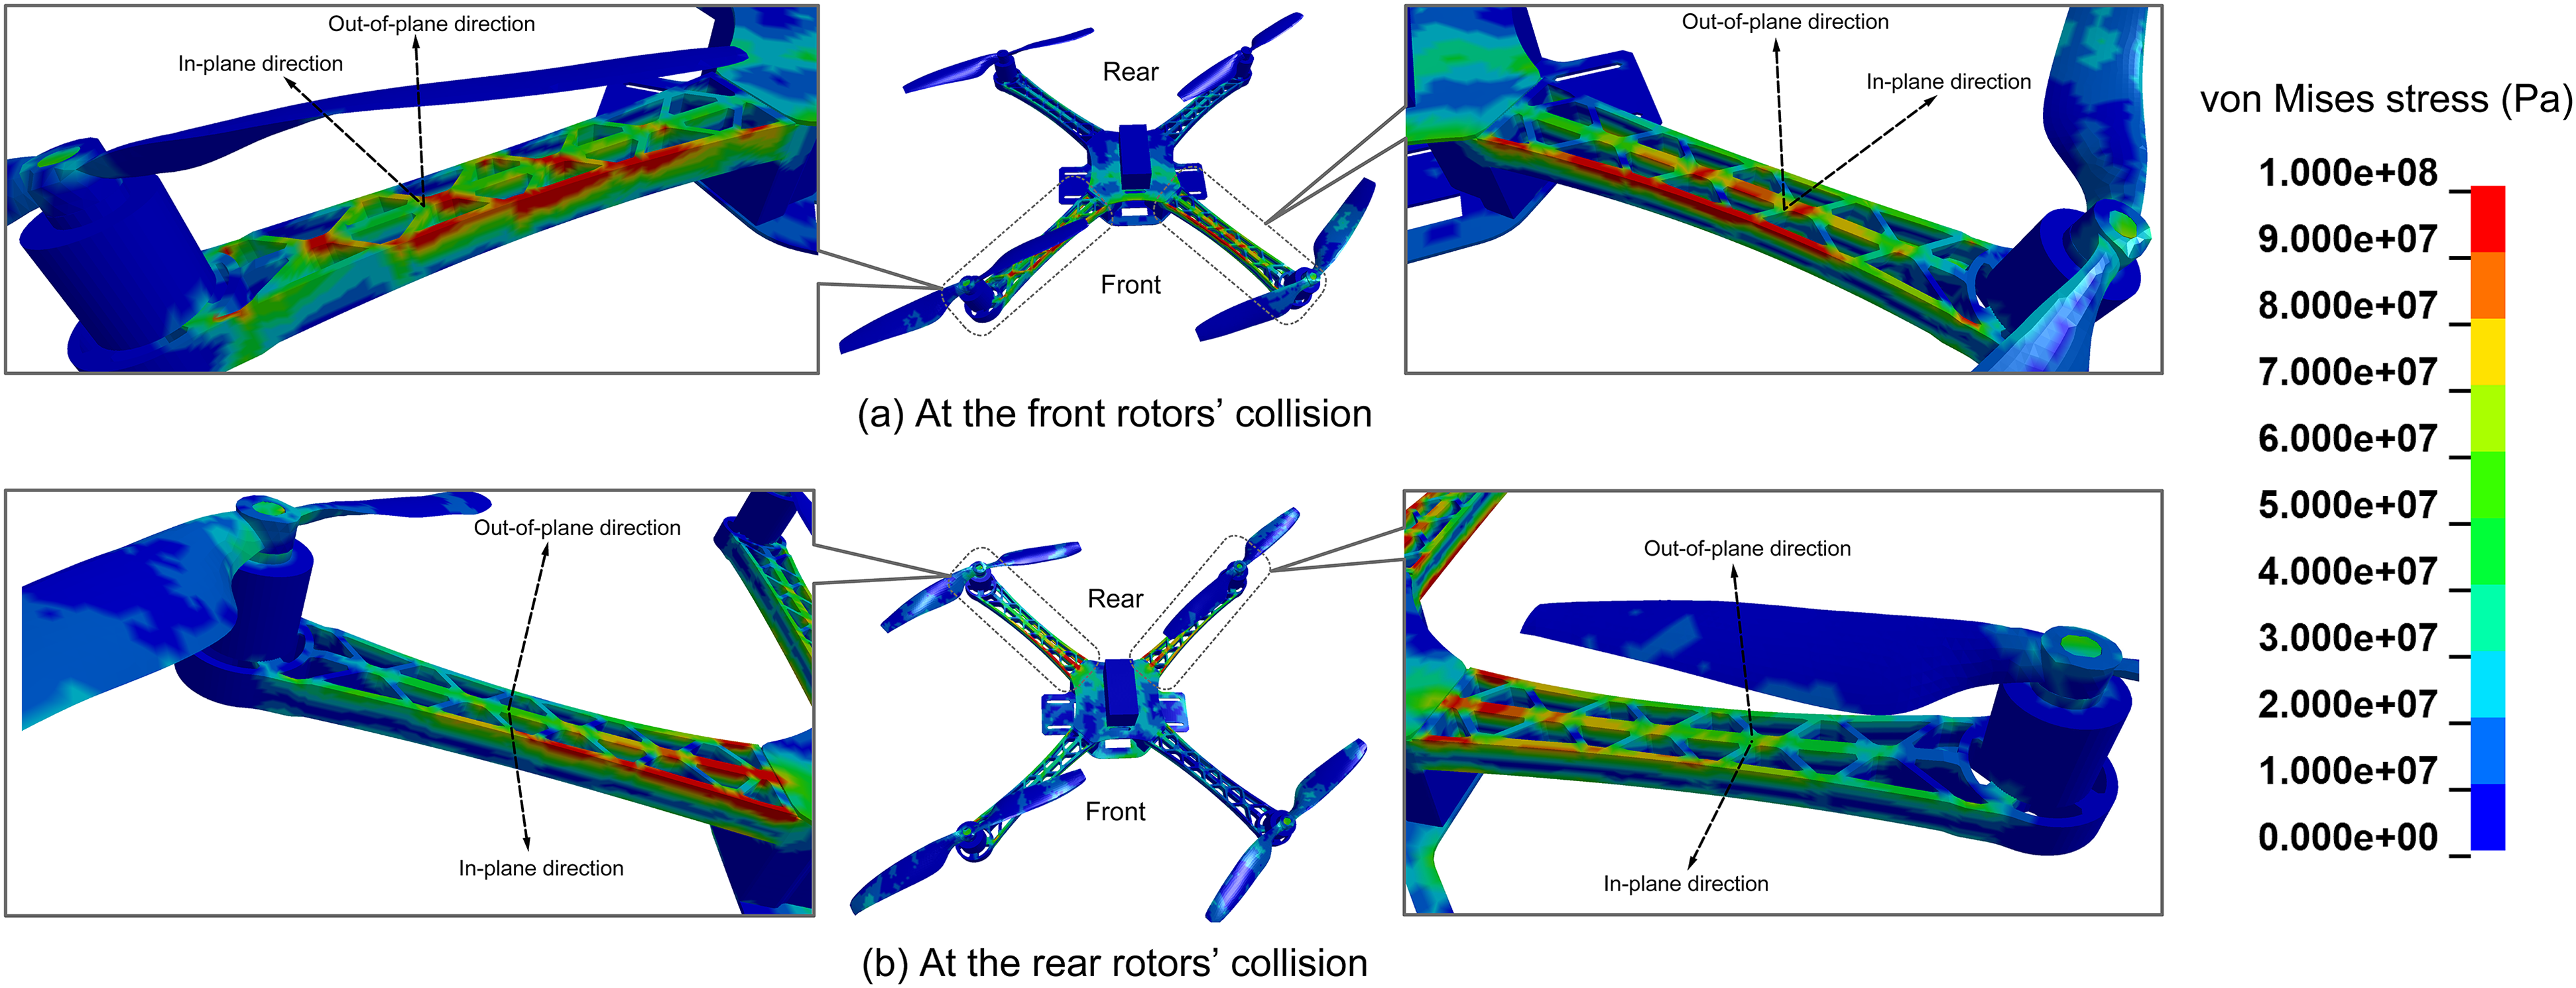
Stress distribution in numerical simulations: (a) at the front rotors’ collision and (b) at the rear rotors’ collision.
Figures 14 to 16 show the comparison of impact force-time histories from the experiments and the numerical simulations for 3 mm, 5 mm, and 8 mm-thick glass panels, respectively. The symbol
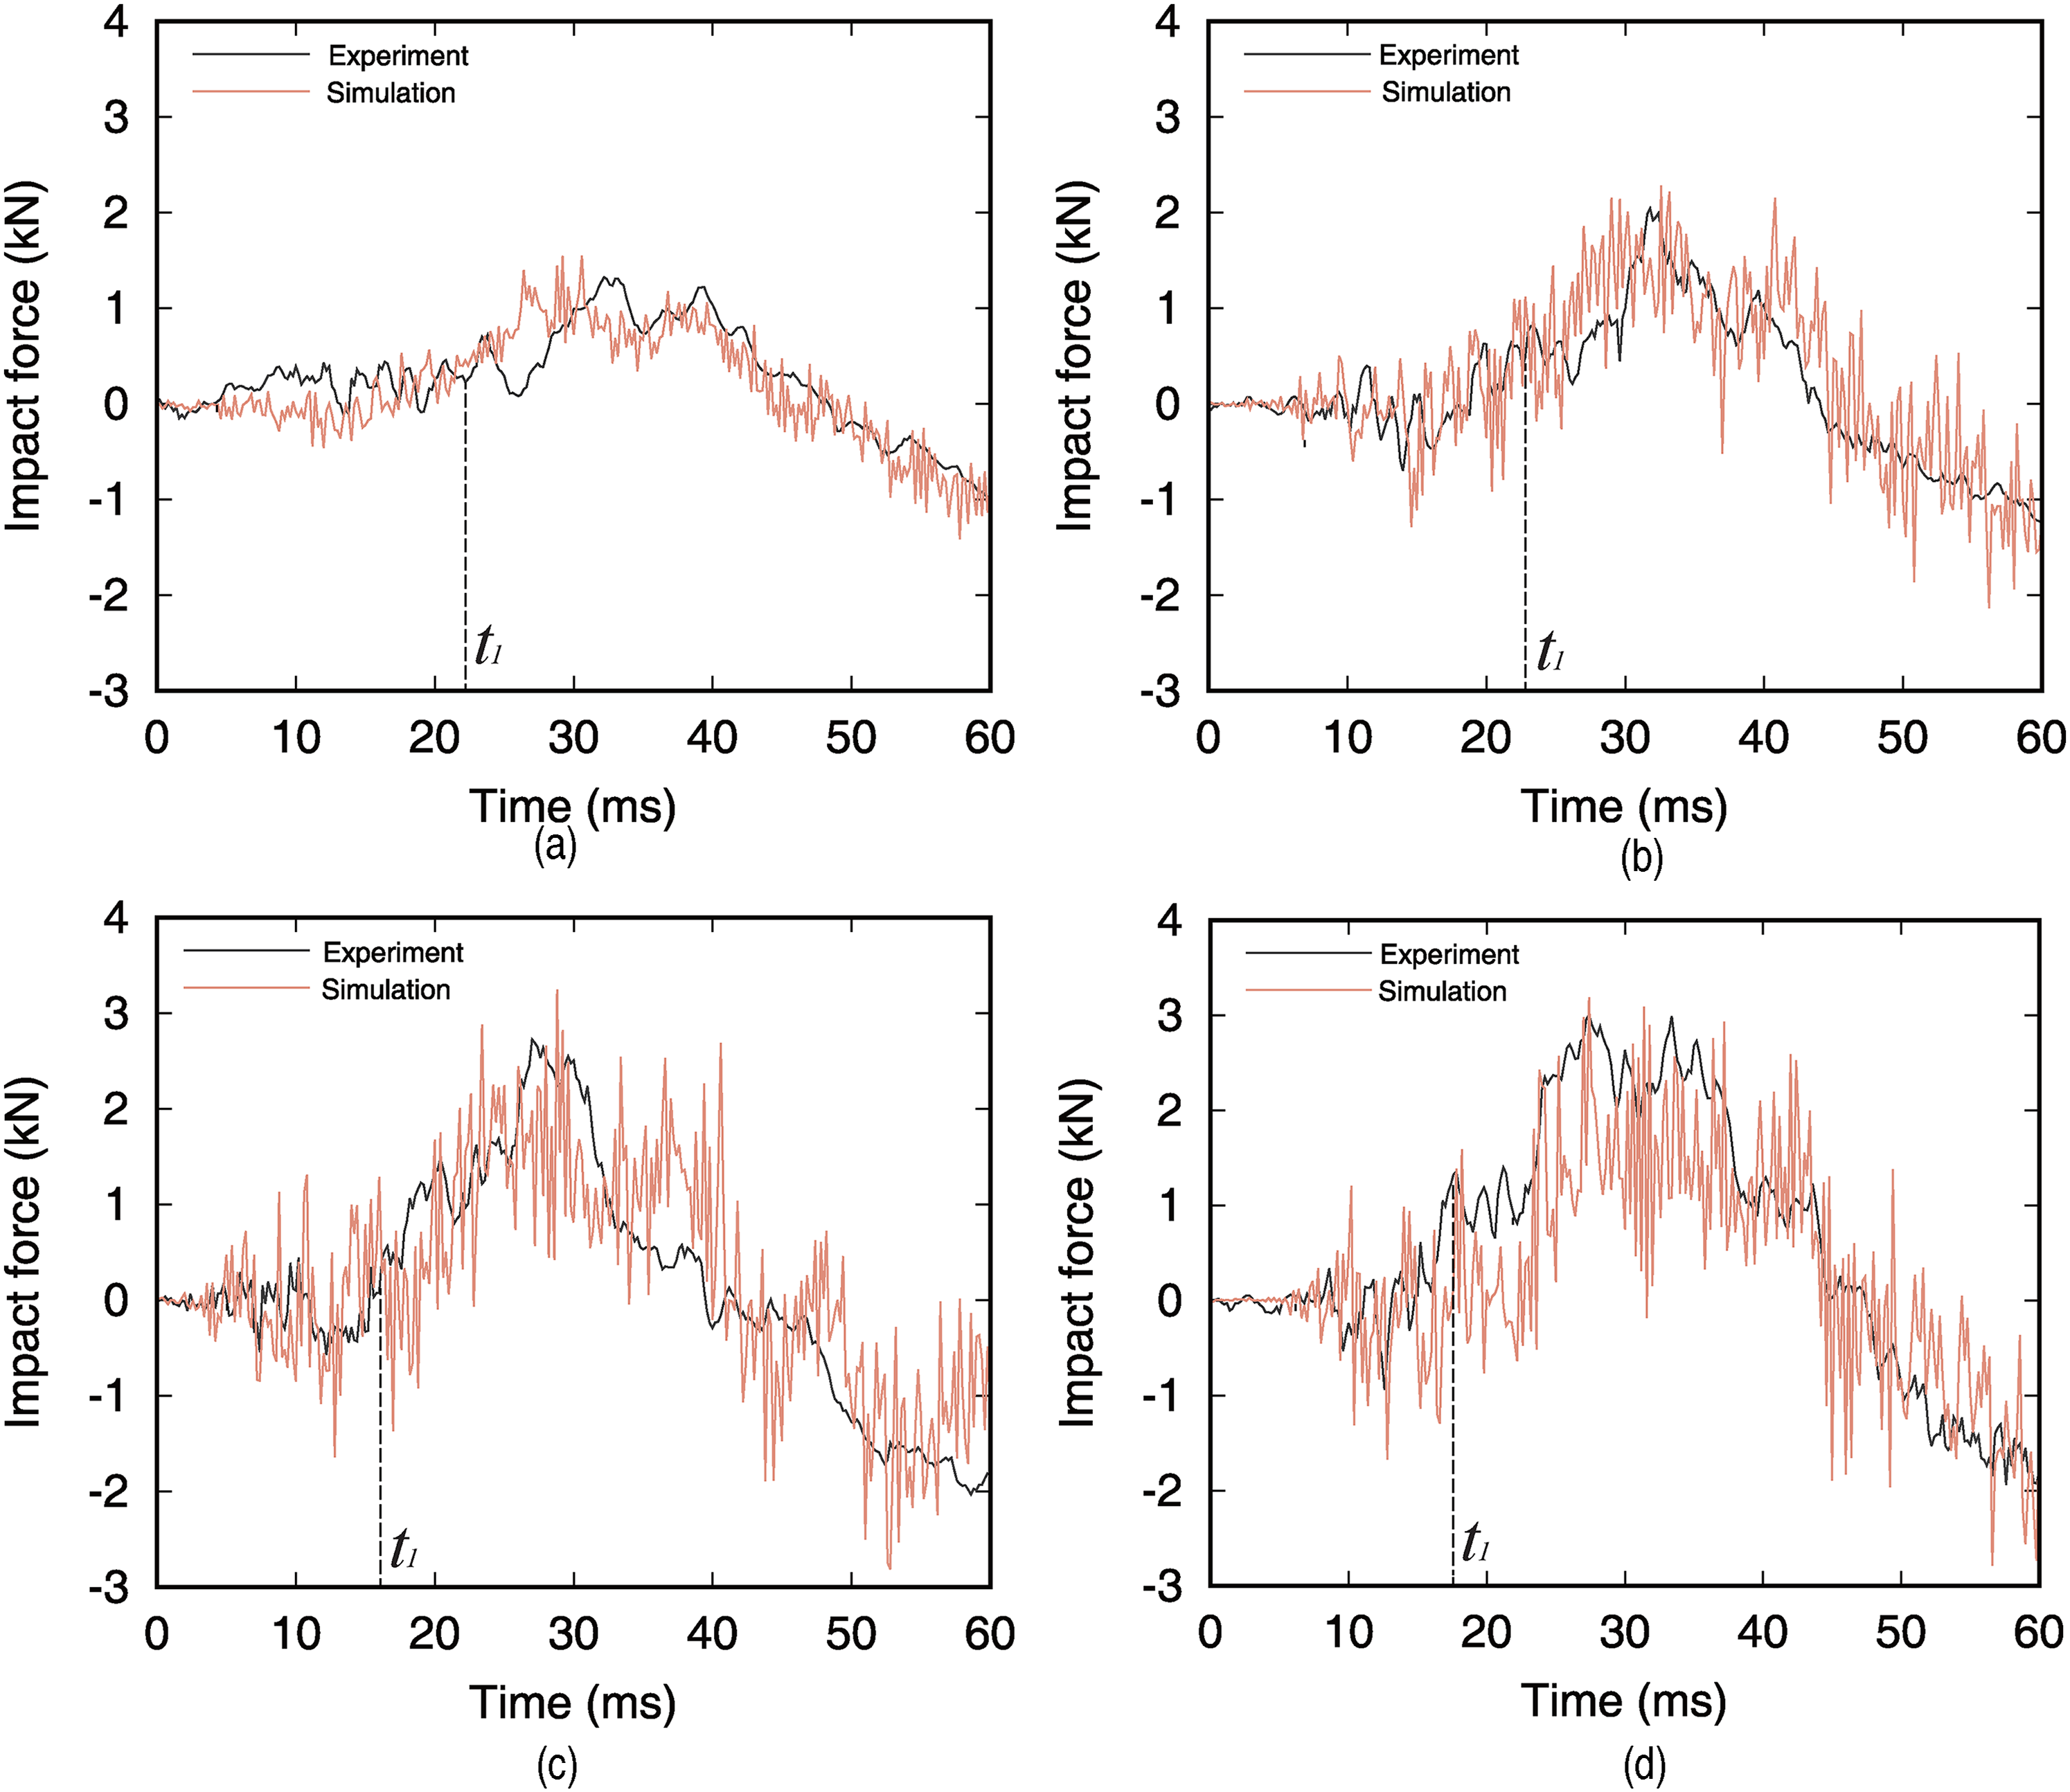
Time history of impact force in 3 mm-thick glass in order of impact velocity. The time
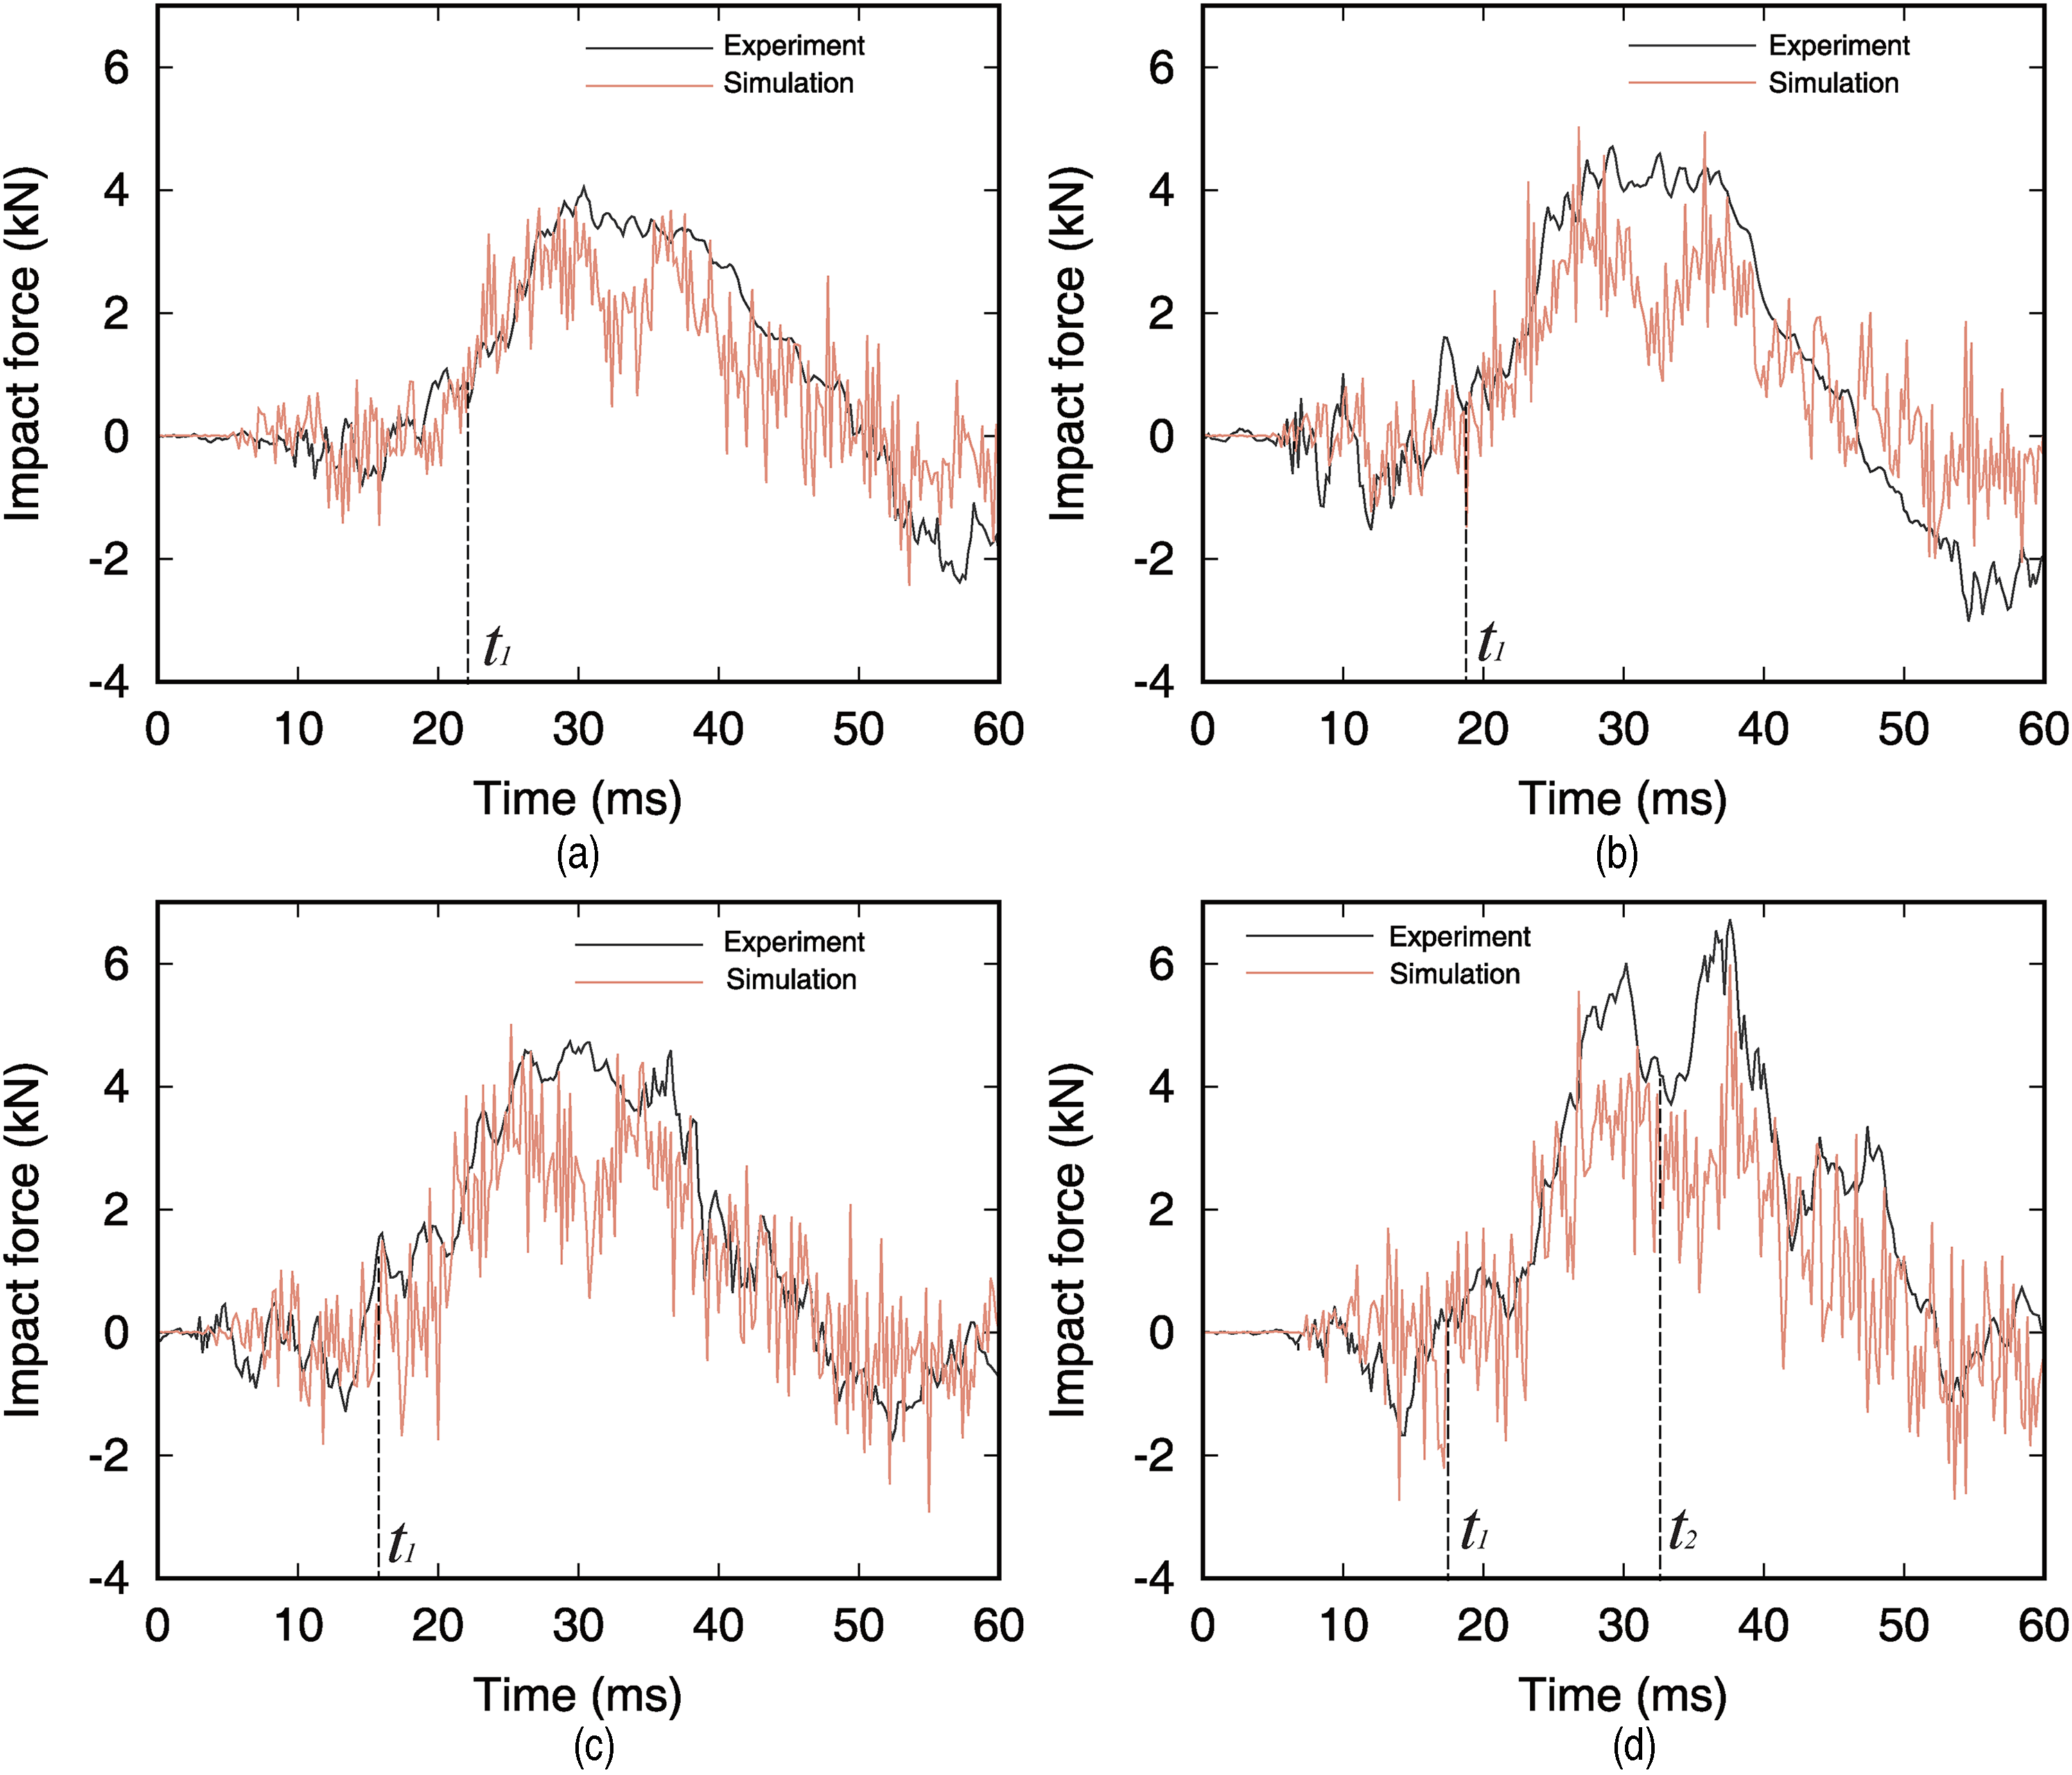
Time history of impact force for the 5 mm-thick glass in the order of impact velocity.
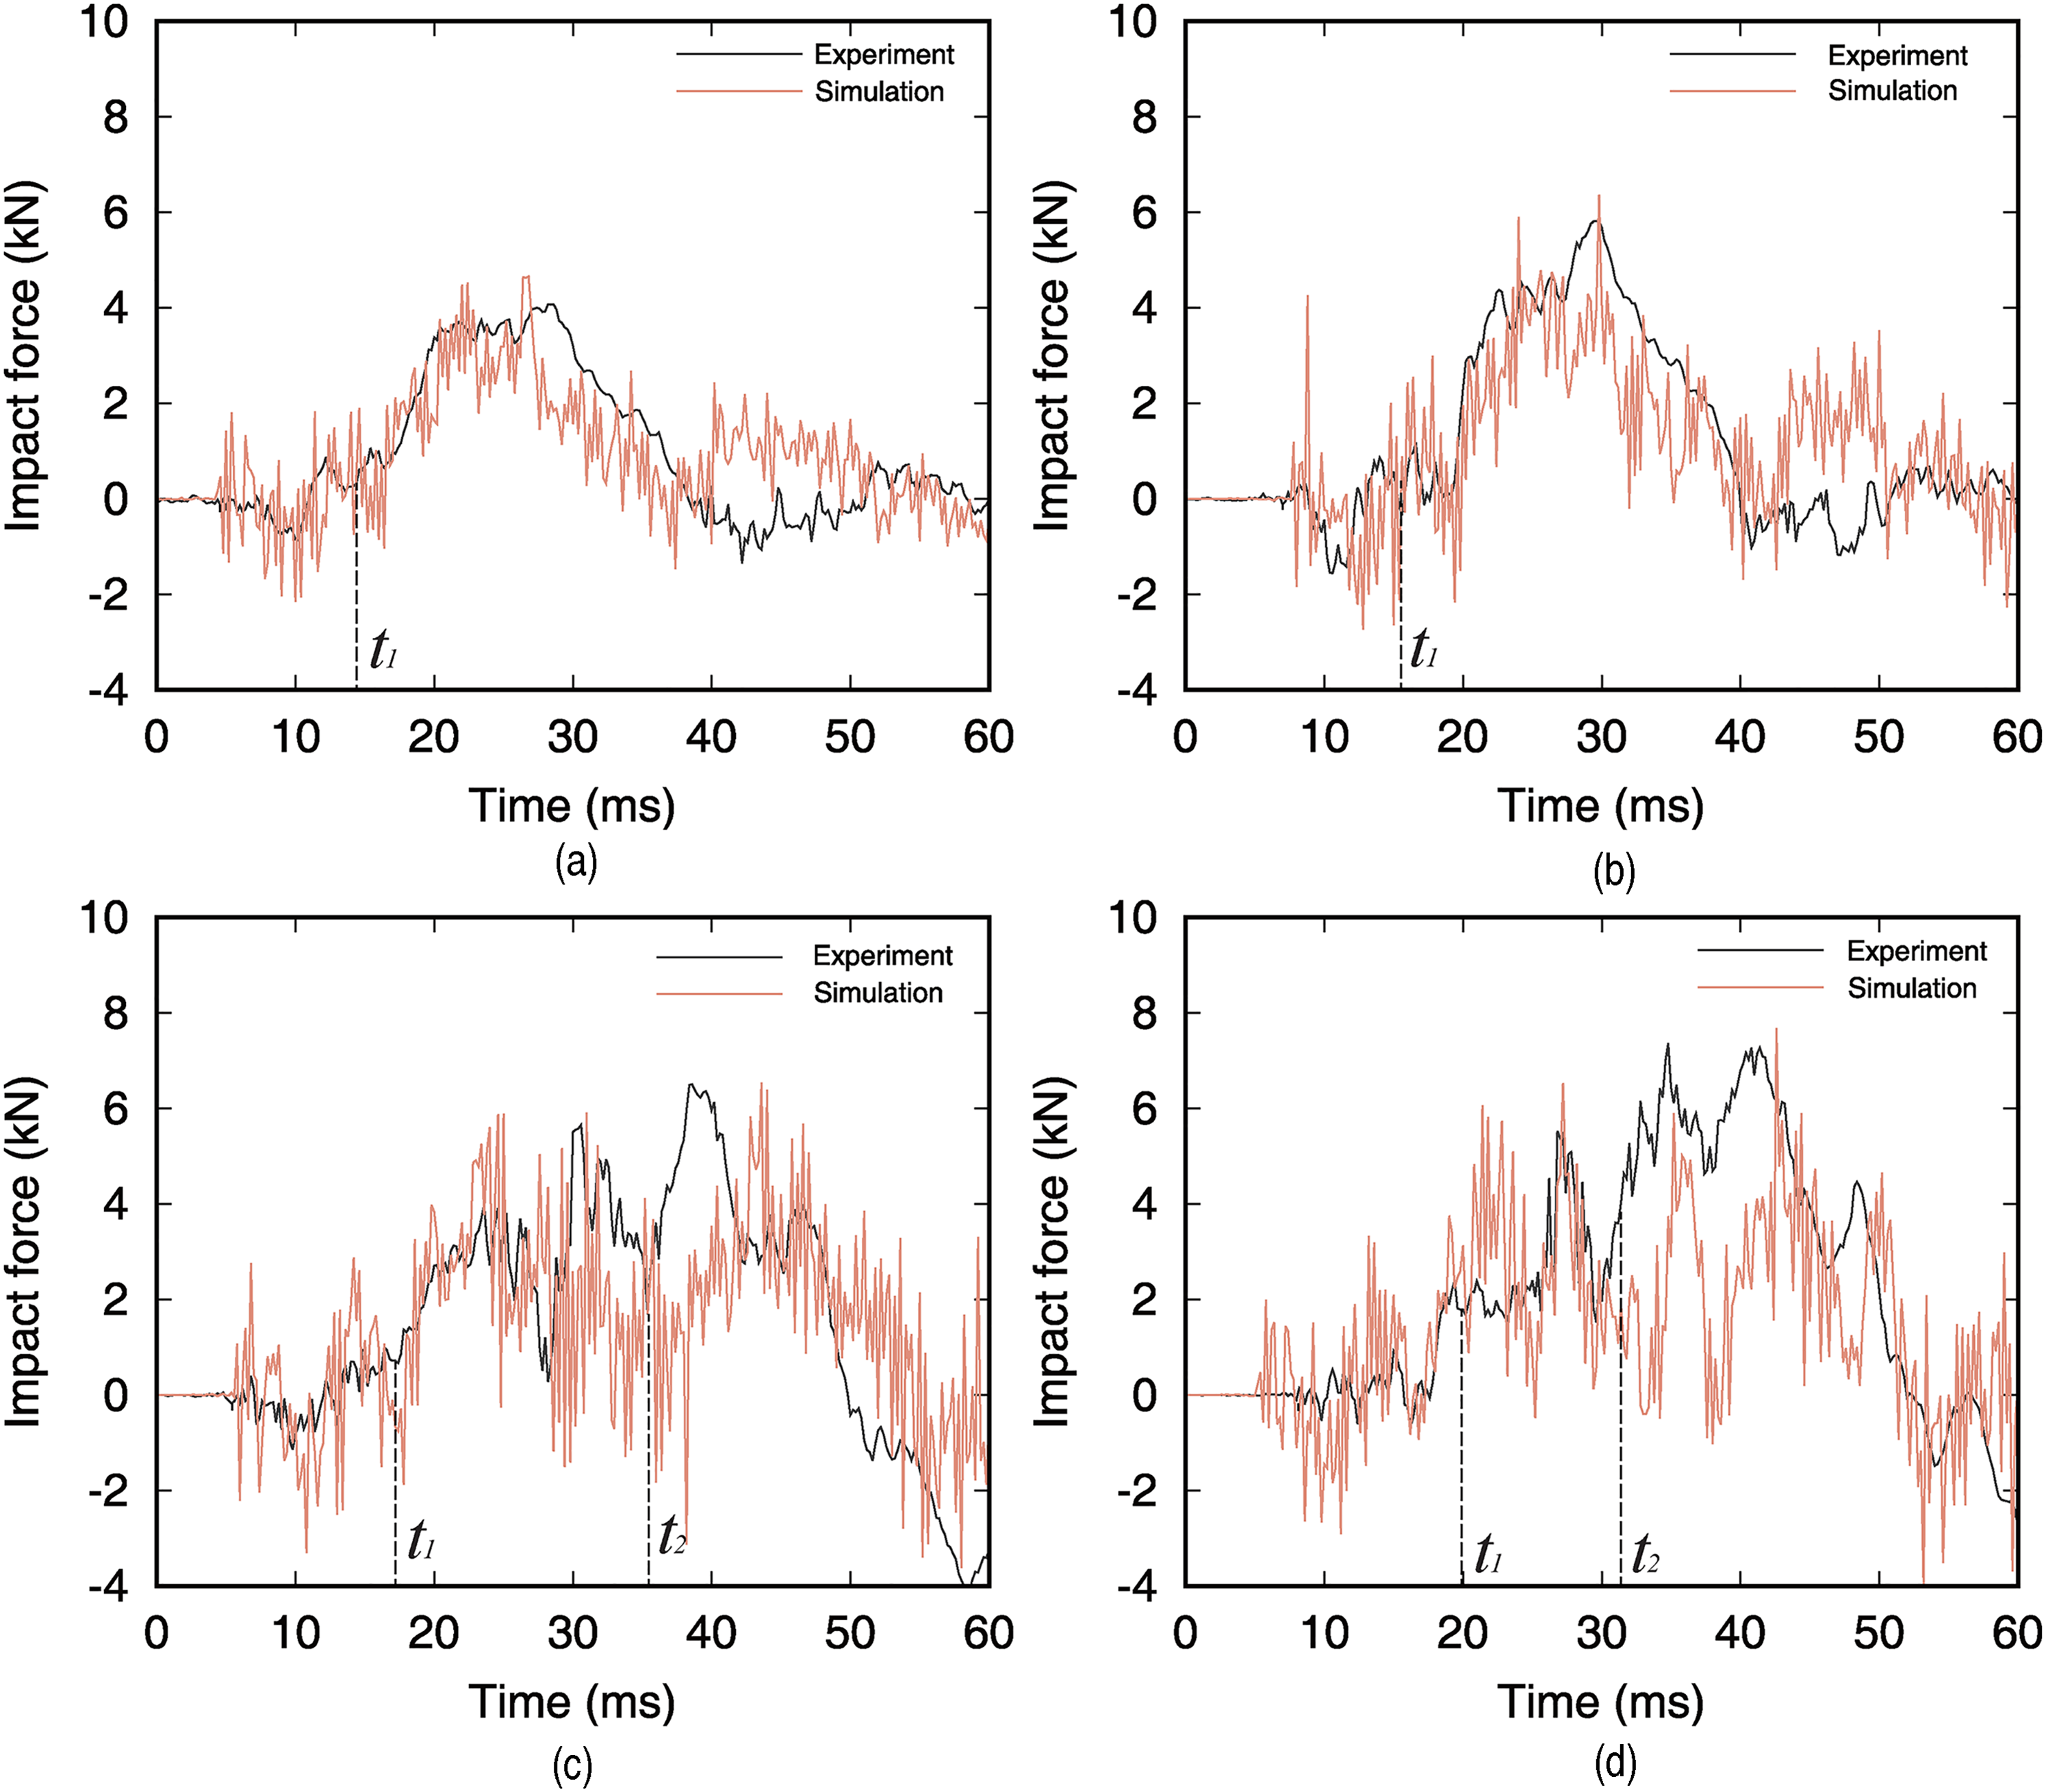
Time history of impact force on the 8 mm-thick glass in the order of impact velocity.
The front rotors fail after hitting the glass panel, but the rear rotors still make propulsion, ending up with flipping of the UAV. It can be simulated by adding acceleration calculated by Equation (4) to the finite element model of the rear rotors. This modeling improves the simulation of the collision responses of UAVs and enhances the accuracy of the time history of the impact force, compared with the experimental results.
The impact forces against 3 mm-thick glass panels by experiments and numerical simulations are compared in Figure 14. The front rotors collide with the panel at
The impact forces of the numerical simulations show a similar trend when superimposed on those of experiments based on
Comparison of experimental and numerical results for the 3 mm-thick glass panel.
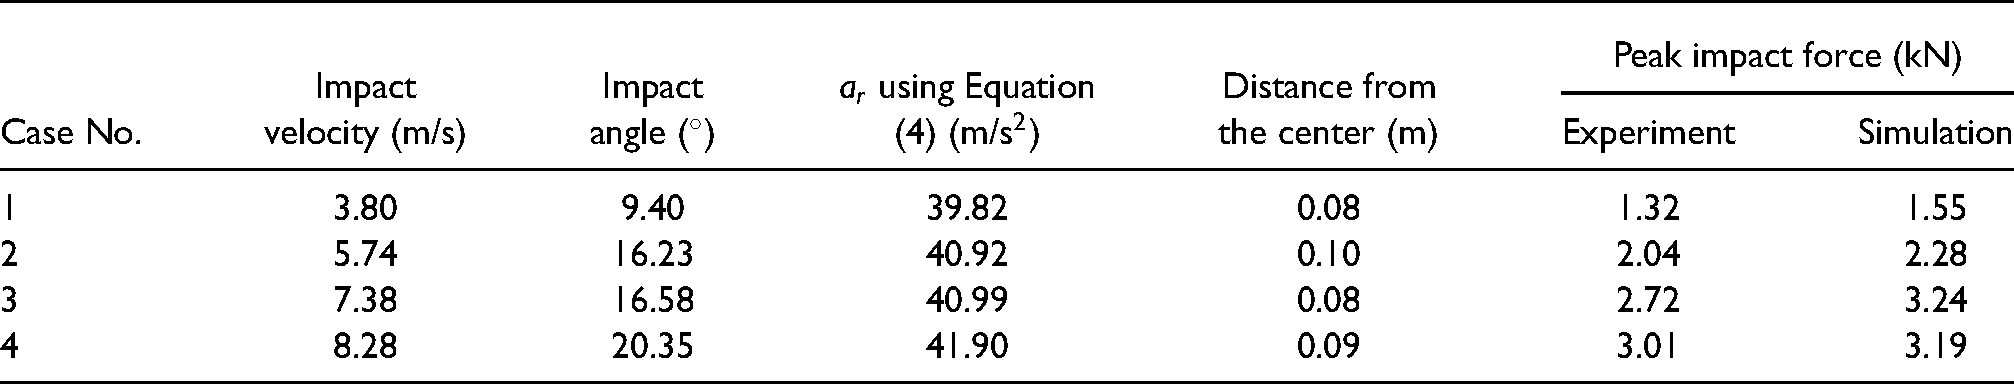
Figure 15 shows the time history of impact force in 5 mm-thick glass panels. In the same manner with the 3 mm-thick glass panel, the time
In Table 6, the peak impact forces of cases 5 to 7 are induced by the collision of the front rotors. On the other hand, the peak impact force of case 8 is induced by the collision of the rear rotors. The peak impact forces of the experiments and the simulations are also summarized with the other details. Compared to the peak impact forces of the 3 mm-thick glass panels (cases 1 to 4), the peak impact force of 5 mm-thick glass is higher at a similar impact velocity. For example, when comparing case 4 from the 3 mm-thick glass and case 6 from the 5 mm-thick glass, the peak impact force in case 6 is larger despite the similar impact velocity. It is because that the stiffness of the glass panel increases as the thickness increases. Therefore, the impact energy converted to strain energy of the glass panel decreases, and the rest of the impact energy transferred to the force sensors increases.
Comparison of experimental and numerical results for the 5 mm-thick glass panel.

Figure 16 shows the time histories of impact forces for 8 mm-thick glass panels. In the same manner with the 5 mm-thick glass panel, the time
Comparison of experimental and numerical results in the 8 mm-thick glass panel.
From the results of the 12 cases above, it is found that the rear rotor collision occurs when impact velocity exceeds a certain level. Except the case 8, cases 1 to 10 whose impact velocities less than 10.87 m/s show only the collision of the front rotors, and this collision induces the peak impact force. However, in case 8 (
The rear rotor acceleration
In outdoor environments, UAVs might collide into structures under unpredictable collision conditions because of extreme weather or malfunctioning of some electrical components. However, it is very hard to reproduce those cases in experiments. The numerical simulation, on the other hand, is capable of varying those collision conditions conveniently. By using this advantage, the simulation enables the comprehensive investigation of the impact force by changing the impact velocity and angle, individually. The following section explains the characteristic collision behavior of a UAV under various collision conditions by the numerical simulation verified in this section.
Parametric study of collision responses of UAVs
A variety of collision scenarios is simulated by using the developed numerical model. Figure 6 shows the relationship between the peak impact force and the impact velocity from the results of collision tests, and the collision data is scattered over a wide range of impact velocity from 3.11 m/s to 15.60 m/s. In the preliminary tests to measure the maximum velocity of the UAV, the highest velocity was about 16 m/s. Therefore, we determine the range of impact velocity from 2 m/s to 16 m/s and evenly distributed the target velocities within the range. An impact velocity is changed from 2 m/s to 16 m/s with an interval of 2 m/s, and an impact angle is changed gradually from 0

Schematic diagram of numerical simulations performed with a combination of impact velocities (from 2 to 16 m/s in intervals of 2 m/s) and impact angles (from 0
As a result, Figure 18 shows the trend of the peak impact force that changes depending on the collision conditions. Under the same impact velocity, the peak impact forces by sphere-shaped objects might be similar in all cases because they have identical kinetic energy. However, as for the UAV, the peak impact forces change depending on the impact angle even if the UAVs have the same velocity.
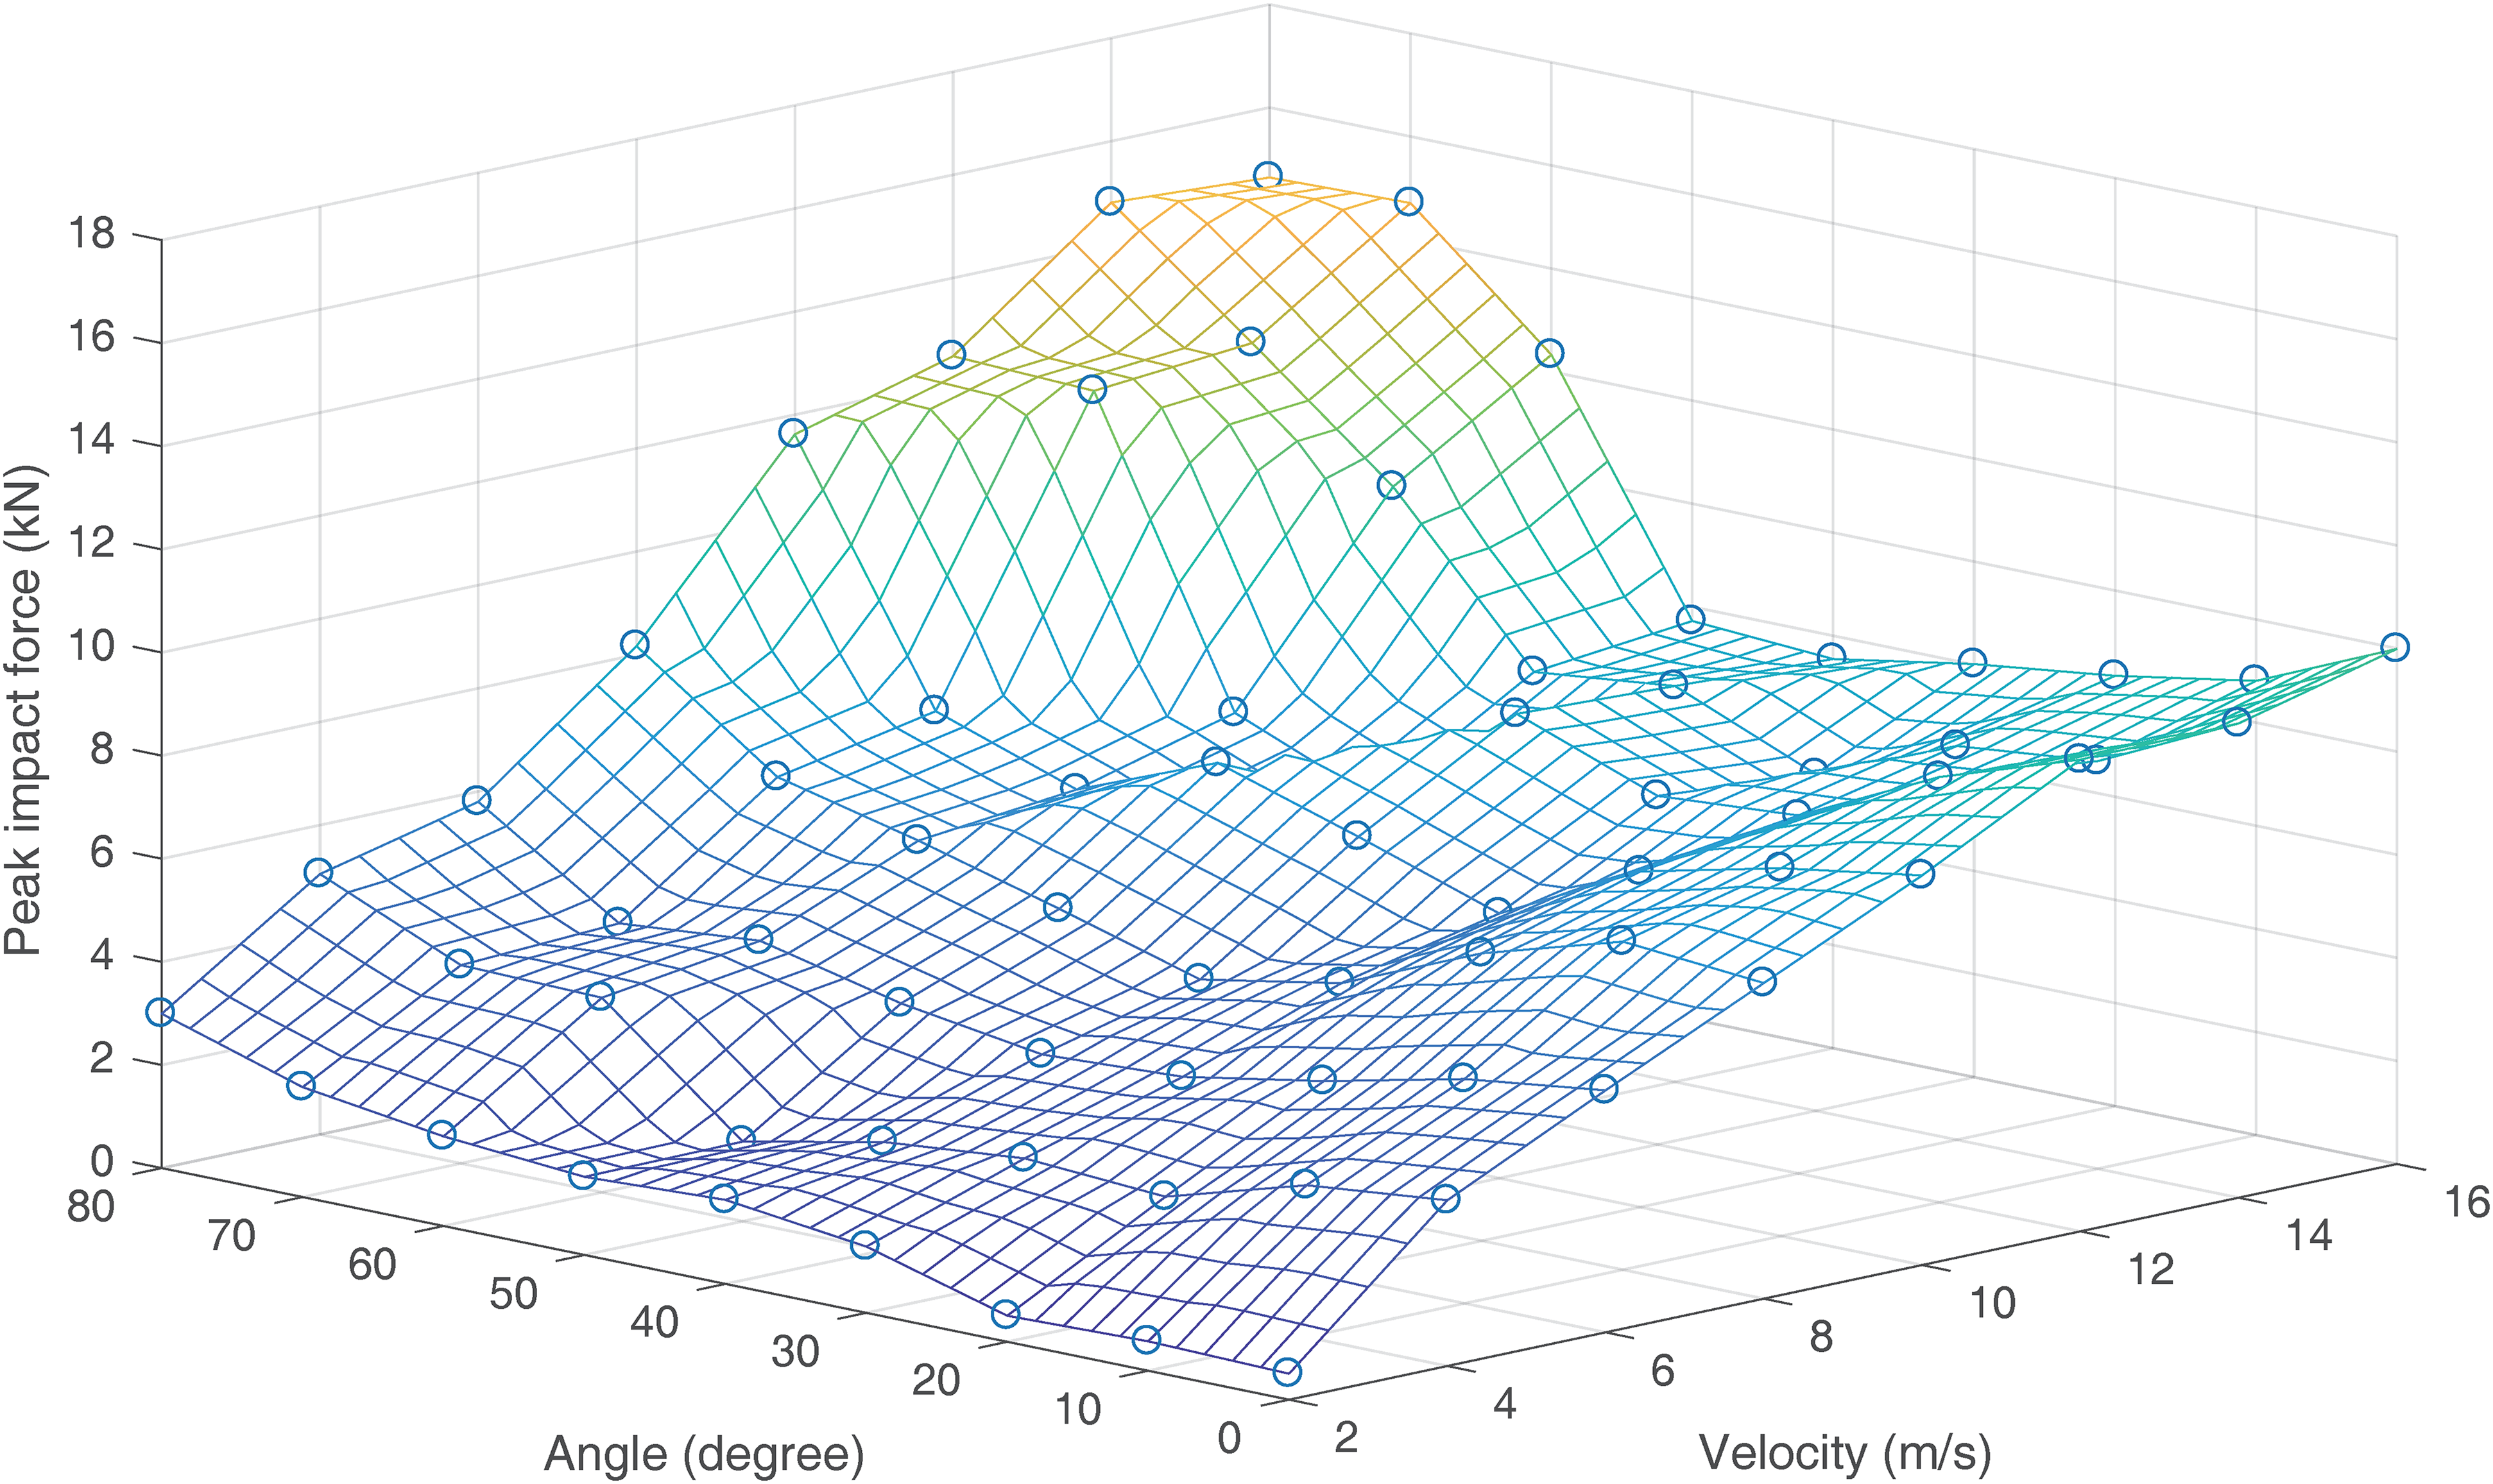
Interrelation between the peak impact force, impact velocity, and impact angle.
In order to analyze the effects on the peak impact force by the impact velocity and angle, we investigate the impact force by increasing the velocity and angle independently.
Peak impact force vs. impact velocity
Figure 19 shows the relationship between the peak impact force and the impact velocity. For each of the 8 impact velocities on the horizontal axis of the graph, numerical simulations are performed by changing the impact angle from 0

Correlation between the peak impact force and the impact velocity at constant impact angles.
The standard deviation is an indicator of the degree to which the variation of the impact angle influences the peak impact force. A large standard deviation indicates that the peak impact forces vary over a wider range by the change of the impact angle, even at a constant impact velocity. In other words, the peak impact force is sensitive to the variation of impact angle. On the contrary, the small standard deviation indicates that the effect of the variation of impact angle on the peak impact force is insignificant. The standard deviation increases as the impact velocity increase, ending up with the highest value in the 16 m/s. Therefore, it is difficult to accurately predict the peak impact force if a UAV collides at a high velocity with an uncertain impact angle that might be observed in extreme weather conditions.
The values of standard deviations, means, minimums, and maximums are listed in Table 8. For the minimum and the maximum, the corresponding impact angle and the rotors are written down, respectively. Typically, the minimums are measured when the UAV collides at the angle between 30
Details of correlation between the peak impact force and impact velocity.

The maximum values are caused by the rear rotors and are mostly measured at the highest impact angle, see the eighth and ninth columns. In the collision process, by the front rotor’s collision, the front arms deform within the elastic range without physical damage, as shown in Figure 1(b). Then, the impact energy is stored as the strain energy in the frame arms. During the second collision by the rear rotors, the stored strain energy is transferred and added to the impact energy on the glass panel, which results in the peak impact force.
Peak impact force vs. impact angle
Figure 20 shows the relationship between peak impact force and the impact angle. For the 9 distinct impact angles, numerical simulations are carried out by changing the impact velocity from 2 m/s to 16 m/s by 2 m/s interval. Therefore, 8 peak impact forces are obtained for each impact angle.

Correlation between the peak impact force and the impact angle under constant impact velocities.
Mean, minimum, and maximum values among the 8 peak impact forces are plotted in Figure 20, and the means are connected with a solid line. The standard deviations (
Details of correlation between the peak impact force and impact angle.

At low impact angles ranging from 0
At mid-impact angles in the so-called transition zone from 30
After the transition zone, which ranges from 50
The standard deviation shows a similar trend as the mean of the peak impact force does. In specific, the standard deviation decreases until the transition zone and increases thereafter. A large standard deviation indicates that the peak impact forces are distributed over a wider range according to the variation of impact velocity at a constant impact angle, in which the peak impact force is sensitive to the variation of impact velocity. However, a small standard deviation indicates that the effect of the variation of impact velocity on the peak impact force is not significant. In the transition zone, the standard deviations are smaller than those in the high and the low impact angles. The lowest standard deviation of 2.18 kN, as well as the lowest mean of the peak impact force, is observed, which indicates that the influence of the variation of the impact velocity on the peak impact force is not significant with a relatively low threat of UAV.
From the numerical results, smaller peak forces and lower standard deviations are found in the transition zone than other angles and indicate the minimum threat of UAV and the narrow range of peak force variation, thus reducing the risk in the event of a UAV accident and predicting the risk with high reliability. Therefore, the tilt angle of a UAV should be regulated to the transition zone ranging from 30
Summary and conclusions
In this paper, the collision mechanism of the unmanned aerial vehicle (UAV) against the glass panel is elucidated, and the collision impact force representing the collision threat by the UAV is investigated through experiments and numerical simulations. In the experiments, collision tests were conducted flying UAVs (DJI F450) against glass panels of different thicknesses. The collisions were recorded by a high-speed camera, and the impact forces in the time domain were measured using dynamic force sensors.
The numerical model was verified by comparing the collision tests results (collision processes and the impact forces) with the calculated results from the numerical simulation. After verification, a total of 72 numerical simulations were performed for a combination of 8 impact angles and 9 impact velocities, including the extreme collision conditions that cannot be experimentally reproduced.
In the low angle collisions ranging from 0
Practically, the research results are applicable to advance the understanding of the collision mechanism for UAVs onto structural glasses. Through experiments, we found that the interactions of UAVs against the structural glasses have complicated variations according to the impact velocity and angle, respectively. To improve the safety of structural cladding glass, the pitch angles of UAVs during flights might need to be constrained to be in the mid-angles (the transition zone) from 30
We believe that our study makes a significant contribution to elucidate the collision responses of UAVs onto structural walls, and these results might be useful to devise the standard impact force evaluation procedures for UAVs which will be developed and used for surveillance, delivery, and so forth.
Footnotes
Acknowledgements
This work was supported by the Korea Agency for Infrastructure Technology Advancement (KAIA) grant funded by the Ministry of Land, Infrastructure and Transport (Grant 21CTAP-C163758-01).
Declaration of conflicting interests
The author(s) declared no potential conflicts of interest with respect to the research, authorship, and/or publication of this article.
Funding
The authors received no financial support for the research, authorship and/or publication of this article.