
Abstract
Long flight durations are highly desirable to expand mission capabilities for unmanned air systems and autonomous applications in particular. Flapping wing aerial vehicles are unmanned air system platforms offering several performance advantages over fixed wing and rotorcraft platforms, but are unable to reach comparable flight times when powered by batteries. One solution to this problem has been to integrate energy harvesting technologies in components, such as wings. To this end, a framework for designing flapping wing aerial vehicle using multifunctional wings using solar cells is described. This framework consists of: (1) modeling solar energy harvesting while flying, (2) determining the number of solar cells that meet flight power requirements, and (3) determining appropriate locations to accommodate the desired number of solar cells. A system model for flapping flight was also developed to predict payload capacity for carrying batteries to provide energy only for power spikes and to enable time-to-land safely in an area where batteries can recharge when the sun sets. The design framework was applied to a case study using flexible high-efficiency (>24%) solar cells on a flapping wing aerial vehicle platform, known as Robo Raven IIIv5, with the caveat that a powertrain with 81% efficiency is used in place of the current servos. A key finding was the fraction of solar flux incident on the wings during flapping was 0.63 at the lowest solar altitude. Using a 1.25 safety factor, the lowest value for the purposes of design will be 0.51. Wind tunnel measurements and aerodynamic modeling of the platform determined integrating solar cells in the wings resulted in a loss of thrust and greater drag, but the resulting payload capacity was unaffected because of a higher lift coefficient. A time-to-land of 2500 s was predicted, and the flight capability of the platform was validated in a netted test facility.
Keywords
Introduction
Avian systems can generate and control airflow mechanics1–4 to achieve impressive aerodynamic performance through various wing motions (variations in anhedral, dihedral, platform, camber, aspect ratio) and body motions.1,3,5–12 There are also numerous examples of mammalian flight,4,13 and at smaller scales with insect flight.14–17 A number of bio-inspired flapping wing air vehicles (FWAVs) have been developed in pursuit of desirable flight characteristics, including research platforms exploring warping wing flight and University of Maryland’s Robo Raven series.9,18–31 As a means of reducing system complexity and weight, many successful flapping wing platforms rely on a single actuator32–34 to drive one degree of freedom while other degrees of freedom are generated using passive means to achieve complex kinematics.9,13,27,34–40 One such approach is the usage of flexible membranes mylar, latex, or fabric, which passively deform and are lightweight.35,40,41 Usage and benefits of flexible membranes are not limited to just flapping wing flight.42,43
A key constraint with FWAVs is their lift-limited weight, which is dependent on coupling between the actuators and deformations of the wings. Due to these limitations, the energy source used to power the vehicle—often a battery for electrical systems—must remain low mass, which limits energy availability and provides shorter flight times as a result. Shorter flights restrict the overall mission capabilities for any unmanned air system (UAS) and is highly undesirable for pursuing autonomous applications in particular.
If UAS platforms can harvest energy while in flight, such as capturing energy via vibrations, 44 they can potentially have longer flight times. Extending this concept, energy sources outside of the platform, such as solar power, have been explored to harvest energy while in flight, as well as on the ground in order to recharge batteries. 45 If power requirements for flight are either met or exceeded, then endless flight time should be possible, assuming there are no other hardware restrictions. There are already a number of examples of the usage of energy harvesting and storage in fixed wing aircraft systems in the research community,44,46–50 including harvesting of vibrational energy and solar energy and integration of battery systems into the wing designs of unmanned systems. There are a number of commercial and government agency platforms, which use solar cells to gather solar energy and company initiatives to utilize solar energy to provide longer flight times. These include but are not limited to Solar Impulse I and II, Facebook’s UAS-based Internet platform, National Aeronautics and Space Administration’s (NASA) Pathfinder and AeroVironment’s Helios aircraft, and Boeing’s SolarEagle.51–54 The advantages of these systems are to provide station keeping 51 and to reduce the environmental impact. 54
Gathering solar energy via photovoltaics can be more efficient than other energy harvesting technologies, if they are used in conjunction with optimized energy transfer techniques, such as maximum power point tracking (MPPT).48,55 For example, it has been noted in Shiau et al. 48 that using incremental conductance algorithm, as reported by Hohm and Ropp, 55 enables MPPT technologies to exceed 97% efficiency. Additionally, flight endurance can also be increased by using energy consumption reducing techniques, such as utilizing thermal updrafts in flight, which is the aim of the Navel Research Lab’s ALOFT glider algorithm 56 or AutoSoar. 57 Notably, amongst the research work considering solar cell integration, Zhang and Hu 58 considered the integration of solar cells into flapping wing platforms, specifically the effects of scaling on the performance of the platforms. The scaling effects were studied using a power generation model for flapping wings where the incident solar flux was assumed to be perpendicular to the surface of the wing.
In this paper, a general framework is developed to design and assess using solar cells to realize multifunctional wings for FWAVS that can harvest energy from nonplanar body poses where the wings are not perpendicular to the incident flux. A design case is presented using the University of Maryland’s Robo Raven platform considering integration of high-efficiency (HE) gallium arsenide (GaAs) solar cells into the wings, body, and tail. The effects of the solar cell integration on the aerodynamic performance of the FWAV are characterized on a test stand in a wind tunnel and in flight, while models are developed and used to understand the effects on the potential payload capacity and subsequent flight time. The electrical performance was also characterized to confirm the energy harvesting capabilities. Taking into consideration the potential powertrain effects on the power requirements for flight, the framework is used to predict the ability to achieve flight using batteries to provide energy only for power spikes and for additional time to achieve a safe landing when the sun sets.
Multifunctional wing design framework
Overview
Flapping wing flight is also unique for UAS platforms in that control, lift and thrust force generation are coupled to the deformation of the wings, which are in turn coupled together or individually to an actuator.
Given system weight, actuator restrictions, and current understanding of how to design for flapping wing flight aerodynamics, identifying a functional wing design, particularly with integrated solar cells, can be difficult. While successful airflow characteristics may be identified, achieving these characteristics is less straightforward. In light of this, identifying a functional wing design is often a trial-and-error process. Consequently, when a successful wing is identified, it is often favorable to make small variations in order to maintain performance. Given the reliance on deformation, stiffness and location of stiffness must be considered (though many modeling approaches for flapping wings assume homogeneous properties in the wings because of the high complexity of modeling aeroelastic effects). Thicker solar cell materials, which have a higher bending stiffness, which potentially reduces deformation and the subsequent lift and thrust generation. Although lift and thrust generation does not monotonically change with respect to wing deformation in many cases. 59 Higher mass solar cell materials will also affect the weight contribution of the wings to the total mass and the loading on the actuators, which potentially alters wing velocities and the subsequent lift and thrust generation as well.
Rigorous analytical formulations can be used to accurately describe mature designs and to predict performance. In the face of large uncertainty, as is the case with major design revisions or creation of new designs, rigorous analytical formulations may not allow designers to make intuitive design decisions. Knowing which factors to tune can become unclear given modeling complexity. Inputs for such formulations may not be available in design infancy without inquiry, which can be both time and resource demanding. Additionally, for independent systems computational overhead becomes a challenge for control when complex models are used. In contrast, simplified models can be useful for allowing design decisions and controller design but lack predictive accuracy. In order to bracket errors, worst case analysis and safety factors can provide performance assurances. Ultimately, one may want to have both capabilities during design. The first capability should offer superior accuracy, assuming underlying assumptions are valid. The second capability provides design alacrity because design choices can be made in the face of otherwise overwhelming uncertainty.
If inadequate power is provided to an aerial vehicle (be it a power loss or fluctuation), a resulting loss of control risks harm to both the vehicle and anything below it. A vehicle that is dependent on harvesting energy for flight should be designed to tolerate power fluctuations due to changes in the amount of incident solar flux received or due to surges in the electrical system. Aerial vehicles will also execute various headings and altitude changes relative to the sun to achieve a desired flight path, which affects power generation. For example, a high pitch may be required to climb to altitude, or a roll maneuver is executed in order to turn. These maneuvers will subsequently affect the energy harvesting performance of solar cells integrated into flapping wings, because the solar cells move relative to the body while the body itself changes relative to the incident solar flux. Additionally, power consumption can vary under different flight conditions such as different angles of attack, flapping frequency, as well as wing configurations such as wing area and mass due to installation of solar cells. From a platform design perspective, determining the number of solar cells required to provide system power is of utmost importance, so all of these factors need to be taken into account in designing components with integrated solar cells.
As part of the design process for integrating solar cells into FWAV wings, the following topics are considered.
The solar energy harvesting is modeled to predict the energy generation considering various attitudes achievable by a flapping wing aerial vehicle, as well as the effects of flapping on orientation relative to the incident solar flux. The number of solar cells required to meet operational power requirements is determined by considering candidate solar cell technologies and accounting for sensitives to the orientation of the solar cells relative to the solar flux. Determining appropriate location of solar cells in components, such as the wings, to accommodate the desired number of solar cells.
Solar energy harvesting model
The incident solar flux on the solar cells varies as a function of the position of the solar cell area and the sun’s azimuth, which is the angle along the horizon, and altitude, the angle from horizon, 60 as well as the solar spectrum over the day.61–63 The altitude and azimuth angles vary with location, time of the day, and time of the year. The position of the solar cell area is dependent on the platform heading, pitch, yaw, roll, and angle of solar cells relative to the platform body. Findings by King et al. 61 and Clifford and Eastwood 62 affirm power generation via solar cells varies with the angle of incidence via experimental testing. This relationship is the basis for the framework for flapping wing power generation presented in Zhang and Hu 58 and will be assumed here. To approach this problem, a generic case is considered assuming a cosine relationship. Based on the findings by King et al. 61 and studies on other photo sensors, 64 actual performance tends to be better than predicted by a strict cosine approximation. In light of this, using a cosine approximation should be sufficient, as it is likely underpredictive.
An area, A1, in the world frame with an efficiency of η, with a unit normal,

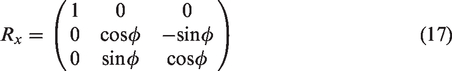
The unit vector

where α and β are shown in Figure 1.

Incident solar flux shown in the world reference frame.
To be generic, bearing in mind that various solar cell technologies could cover multiple areas, the total power generated, Pgen, would then be a sum of the product of the solar cell efficiencies and portion of solar flux incident on multiple areas.

If the efficiencies of solar cells are the same (ηi = η), then this simplifies as follows

The maximum power that can be generated, Pgen,
max
, would occur when all the solar cells are perpendicular to the solar flux such that the dot product of the unit vectors is equal to one.

To apply this to the flapping wing aerial vehicle case, there are two areas of primary interest: the left and right wing areas occupied with solar cells. At a given body attitude, a wing position relative to the body (by an angle, ϕi) and the incident angle of the sun defined in the world frame

If the left wing and the right wing are of same size and account for half the total solar cell area, A, then

An efficiency can be defined as follows

Rewriting equation (7)

When each dot product is equal to one (such that the sum is equal to two, and ηf is therefore one), which occurs when the solar flux and the area are aligned, the resulting maximum power will be as follows

It is assumed that the wings’ surfaces go through a sinusoidal flapping cycle


Flapping wing normal vectors (platform nose coming out of the page): (a) Robo Raven III v1; (b) Robo Raven III v2; (c) Robo Raven III v3; (d) Robo Raven III v4.
During symmetric flapping, ϕl is equal to −ϕr such that they have equal amplitudes and opposite directions as shown in Figure 2.
In order to compute the dot product, the unit vectors must be rotated into the world frame from the body frame. In order to do so, rotation matrices are employed as follows


Yaw rotation

Pitch rotation

Roll rotation
The fraction of solar flux incident on the wings varies as a function of the azimuth, which is the angle along the horizon and altitude, which, in this case, is the degree from the vertical axis (not distance from the surface of the earth). These angles, which are converted into the world axis provided and used for calculation, vary with location, time of the day, and time of the year. A resource for such information is provided by the US Navy (http://aa.usno.navy.mil/data/docs/AltAz.php#Notes).
An assumption in the calculation is that the wings are rigid and do not balloon outwardly during the flapping cycle. Without a priori knowledge of the wing deformation, which is a function of the flapping speed, force, and wing stiffness, it is difficult to assess the wing camber achieved while flapping. In future iteration, it would be possible to add an additional rotation (or rotations) if a model for the wing deformation is available. Additionally, this analysis does not consider blocking and shading effects where one wing covers the other. Shading is unlikely to be a large contributing factor as it would only occur when the sun is at low angles relative to the horizon (dusk or dawn). We assumed that only 80% of the flux is available and therefore we used a factor of safety of 1.25 to address wing deformations, changes in flapping amplitude, and pitch variations. A method to address flapping amplitude and pitch variability sensitivity is discussed in further detail in the next section and results are shown in section “Estimation of available solar flux”.
Determination of the number of solar cells required
Given that the incident solar flux varies as a function of day of the year, time of the day, and location, these parameters should be identified. Knowledge of the seasons can be helpful for picking favorable times of year at the designer’s discretion.
An aerial vehicle may fly at various body positions (pitch and roll dependent) and may not fly in an ideal heading for power generation. For example, all possible headings are executed as the platform yaws to complete a circular trajectory. In light of this, it is important to do worst case analysis such that the heading with the lowest power generated is identified because a failure due to loss of power could result in the system shutdown, which can cause a crash. As a means of doing this, numerous headings can be sampled to span 360º of possible headings by incrementing the yaw value. At each sampled heading, the fraction of solar flux incident on each wing should be evaluated independently, such that the variation during the flapping cycle is captured, and summed to compute the total. Finally, time averaging the fraction of solar flux incident on the wing results will allow comparisons between different headings and conditions to locate the lowest value. While it is possible that an instantaneous value may be lower than required to provide power, it is assumed that power smoothing via the usage of storage devices and changes are shorter than system response time such that flight will be maintained.
Assuming the goal is to provide the entirety of the platform power, P, the power generated must be greater or equal to that value

The safety factor is introduced to account for variations in flapping amplitude, angle of attack (angle of pitch measured from the azimuth), or other factors such as partial shading and the reduction in power generation due to wing deformations that we have previously reported for multifunctional wings with integrated solar cells for FWAVs.
45
Shading is unlikely to be a large contributing factor as it would only occur when the sun is at low angles relative to the horizon (dusk or dawn). To inform the factor of safety, sensitivity analysis considering angle of attack and flapping amplitude (in the case of a flapping wing aerial vehicle) is prescribed.
In this work, a factor of safety of 1.25 was applied by assuming that only 80% of the calculated flux (λ = 0.8) is available. Sensitivity analysis is conducted as described in the section “Estimation of available solar flux” to inform this factor of safety.
Using equation (18), it is possible to determine the requirements for the number of solar cell modules, Nmodules, needed to meet the platform power requirements, as follows

The number of solar cell modules therefore represents the maximum power required for the worst case divided by the power generated by each cell rounded up to the next whole number because they are discrete. It will also dictate the total area of solar cells in a wing, AT, which can be determined from equation (19) and the area of an individual solar cell module, Amodule, can be given as follows
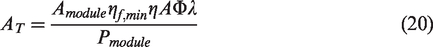
This area is limited by the total available wing area, and the effects that the stiffer solar cells will have on the wing deformations as the percentage of coverage increases, which could change the platform power requirements.
Solar cell integration location
As noted previously, changing wing designs can be difficult, which makes using the functional wing design favorable. Deformation and wing flexibility are important, thus stiffness and location of stiffness are of importance. Thicker solar cell materials which have a higher bending stiffness can reduce deformation of the multifunctional wings while flapping, thus reducing the lift and thrust generation. Given the research findings,2,65 it is recommended that solar cells be integrated closer to the leading edge of the wing such that the trailing edge is unaffected. Additionally, the mass also can influence placement. Placing additional mass close to the motor minimizes the moment of inertia on the wing. Solar cells can also be integrated into static components of the platform, such as the body and tail to increase the energy harvesting capability. The approach used in this work was to add solar cells by the leading edge close to the body first and work towards the wingtips. A new row was created upon reaching the wingtips. This was repeated until half the chord of the wing (as measured from the semi span) was reached at which point solar cells were integrated into the tail and body.
Time-to-land predictions using aerodynamic performance modeling
To predict the available time-to-land for the FWAV, it is necessary to determine the payload capacity available to carry the batteries required to power the bird when the sun sets. This can be ascertained by modeling the aerodynamic performance of the platform to determine factors influencing the payload capacity that can be characterized through experiments. During flapping flight, aerodynamic thrust and lift forces undergo periodic variations. A common modeling approach is to use a quasi-steady-state assumption i.e.3,39,66 “quasi-steady-state wing theory assumes that the forces on a moving wing are equivalent to the sum of the forces on a fixed wing over a sequence of attitudes that track the wing motion”. 4 A detailed modeling framework for flapping wings is presented by DeLaurier. 66 As noted previously, having all the inputs for a model may be difficult to identify. Most notably, thin membrane wings present challenges as identifying airfoil factors required for the model may not be as straightforward compared to a known airfoil executing a flapping motion. In light of this, a simplified model is presented.
In very small intervals of time, the flight is considered level with no acceleration. This implies that the forces in all directions must be equal during the steady-state flight, assuming no change in mass. Therefore, in the horizontal direction, thrust, FT, must be equal to the drag, FD, during the steady-state flight.
67
The average thrust generated using the flapping wings should be equal to drag, as follows


We previously proposed a flapping wing model for the thrust taking into account the compliance of the wing as follows
68

Due to the global stiffness of the wing, c, the associated wing deformations caused by the drag force acting on the wing during flapping, Df, will effectively reduce the velocity as follows

Substituting equation (24) as the thrust term in equation (21) yields

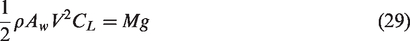
For steady flight with no acceleration in the vertical direction, forces must also add up to zero. Assuming no loss of mass or body forces aside from gravity, for steady-state flight conditions, the lift force, FL must offset the takeoff weight, Mg
67

The aerodynamic lift is given by
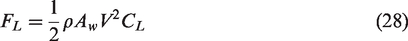
It is possible to relate thrust to lift using the velocity. Rearranging equation (23) and solving for V2 yields

Substituting equation (30) into equation (28) results in the conventional relationship

Substituting the thrust generated by flapping (equation (24)) into equation (31) results in

Substituting this lift into equation (29) enables the maximum takeoff weight to be determined as follows
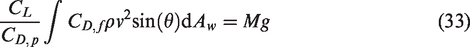
The maximum takeoff mass, Mmax, occurs at the maximum total lift that can be generated.

The payload, Mpl, is the difference between the base platform mass, MFWAV, and the maximum flight mass, MMax, as follows

The payload is the upper limit of the onboard energy storage mass

Energy available, Ea, is a function of the battery mass, Mb, and its energy density, ξ, is as follows

Considering a complete loss of solar power contribution and a fully charged battery onboard, the flight time, tf, assuming an averaged power draw, is as the following

If the entirety of the payload is occupied with battery mass, Mb = Mpl, the flight time before landing then becomes

Result
Design case study
In previous work, solar cells were integrated into an independent wing-controlled Robo Raven FWAV platform developed at the University of Maryland, College Park where each wing is powered by a commercially available high speed and torque servo. An exploratory study was conducted to consider integration of low-efficiency flexible amorphous silicon (A-Si) solar cells into the leading edge of the wings (Figure 3(a)). After successful results and flight viability, the entirety of the wing was occupied with solar cells while maintaining the original wing design. This platform was unable to fly with an unmodified wing; however, flight was possible after modification of the wing by increasing the area trailing edge of the wing with the addition of a tear drop as seen in Figure 3(b). The wing was tracked using digital image correlation to characterize the deformation of the wing, which quantified the findings obtained via visual inspection of the high-speed video footage. It was determined that the wings move out of phase with the leading edge of the wing as the wing surface experiences torsion, which was consistent with other findings.69,70 Additionally, both mechanical and electrical testing were performed. It was previously found that the bi-axial strain in the wing as well as the instantaneous thrust profile can be correlated with the percent change in power generated by wing-integrated solar cells. 45

Versions 1–4 of the Robo Raven III platform with multifunctional wings using low efficiency amorphous silicon (A-Si) integrated solar cells: (a) Robo Raven III v1, (b) Robo Raven III v2, (c) Robo Raven III v3 and (d) Robo Raven III v4.
To improve power generation, the tear drop wings were used in conjunction with solar cells integrated into the rear tail and tail assembly as seen in Figure 3(c). Finally, drawing on scaling studies, 20 the wing size was increased by 66% to provide additional payload capacity and area for solar cell integration. The tear drop was removed and the wing was returned to the original wing design but scaled to increase the area. This platform (Figure 3(d)) was successfully flown. Details of the previously described platforms are provided in Table 1.
Robo Raven I and Robo Raven III platforms.

There are limits to increasing wing size to integrate solar cells as the added mass has a detrimental effect on motors as they are moved out of performance regimes both electrically and mechanically. Given the limited motor torque, flapping amplitude decreases with wing mass at given speeds resulting in reduced force generation, which is a problem unique to servo-actuated wings. In a fixed amplitude system, the angular rate of the wing movement would decrease. In light of reductions in actuator performance due to mass, increasing the efficiency of system components is a means of surpassing limitations.
Estimation of available solar flux
The design goal is to have a Robo Raven III-based FWAV platform flown in an unrestricted area around Los Angeles (LA), CA, USA for roughly six months out of the year. At minimum, there should be a 20-min window of time where flight should be possible with consistent solar flux across six months of the year between 11:00 (11 AM) and 15:00 (3 PM) (when it would be reasonable for the sun to be available).
Given the knowledge of the seasons, the best case conditions for six months of the year would roughly cover the trailing end of spring, the entirety of the summer, and the beginning of autumn.
Yaw headings were varied in increments of 18º (π/10 rad) such that there are 20 unique headings considered to sample the 360º of available headings. Along each sampled heading, one representative flapping cycle was considered to capture the variability of the wing position through the full range of motion. The fraction of solar flux incident on each wing was calculated at 50 different points of the flapping cycle. The flux on each wing was computed independently and summed. The 50 values were then time averaged using numerical integration to generate an aggregate number for each heading. Although the angle of attack varies in flight, the angle of attack is fixed at 20º with no roll. A flapping range of 60º, 30º amplitude, is used in calculations and should be physically feasible based on previous findings.
The results for each wing normalized to half of the maximum and the sum total of both wings were graphed. The results for 21 June 2017 at 11 AM PST are shown in Figure 4. In each graph, straight up indicates north, down is south, right is east, and left is west, therefore each wedge represents a heading. The projection of the incident solar flux vector is shown by the red vector in each graph. The radius represents the time along that heading, where 0.25 s represents a complete flapping cycle at 4 Hz. The variations along a heading are due to the fact that the wings start straight outward, move upward first, then downward, and return to the starting position. Therefore, the time-averaged incident solar flux for each heading was also calculated via numerical integration as shown in Figure 4(d).

Incident solar flux incident on the (a) left and (b) right multifunctional wings and (c) total incident solar flux calculated using energy harvesting model for 21 June 2017 at 11:00 AM PST. The projected incident direction is denoted by the red vector, and the heading is denoted by angle, where North is in the upward vertical direction of the graph. The radius denotes the time along that heading, where 0.25 s represents a complete flapping cycle at 4 Hz. The resulting time-averaged incident solar flux over each heading in (c) can be seen (d).
The results, considering no roll, show that the lowest value of total flux always occurs when the heading is opposite to the incident flux as defined by the azimuth. This occurs when the flux and attitude of the body given the angle of attack are nearly parallel. The best heading occurs when the heading is along the same direction of azimuth because surface of the wings at a given angle of attack and the solar flux are nearly perpendicular. Shading, though disregarded in this study, would occur when the heading and the incident solar flux are perpendicular and altitude is less than or equal to the flapping amplitude. Given that the worst heading will always be considered and it occurs opposite to the direction defined by azimuth when roll is negligible, the altitude angle is the determining factor for design when searching for the data.
On 21 June 2017, the lowest value of 0.6406 occurs at 11 AM. A generic 20% safety factor for variations in the angle of attack and flapping range would reduce this value to 0.51. From this value, a minimum altitude angle of 52.4º was found. Using this value, an incremental search was used to find viable days of the year using values generated in 10-min increments using the US Navy resource indicated above. It was determined that the times of year that provided at least a 20-min window of time when flying in Los Angeles, CA were between the dates of 11 March 2017 and 30 September 2017. Additionally, it was found that 21 June provides a larger span of time for flight beyond the time specified of 11:00 to 15:00, specifically between 10:10 AM and 3:40 PM (15:40). To gain insight into the coverage of the generic safety factor, sensitivity analysis for the angle of attack and flapping range were conducted.
To address potential sensitivity to the angle of attack, the angle of attack was varied between 15º, 20º, and 25º at multiple times of the day.
The results of this sensitivity analysis are shown in Figure 5. The highest variability of 9.82% occurred between the baseline data at 20º and 25º at 11 AM, which indicates that the safety factor should be adequate if this effect is not compounded upon by another one. There may also be sensitivity to flapping range. For a fixed value of 20º angle of attack, the flapping amplitude was varied between 20º, 25º, 27.5º, and 30º. These results are shown in Figure 6. At most, the highest variation from the original value was 3.9%, which improves as the flapping range is lowered. These findings suggest that a value of 0.51, representative of an 80% reduction to provide a factor of safety, should be adequate to satisfy the design criteria.

Sensitivity of the solar flux incident on the multifunctional wing for various angles of attack prior to a safety factor (legend is in degrees).

Sensitivity of solar flux incident on the multifunctional wings at a 20° angle of attack for various flapping amplitudes prior to a safety factor (legend is in degrees).
Motor power estimation
The original Robo Raven was designed to work with low-cost servo motors. These low-cost motors tend to have poor efficiency. The servos currently used for the Robo Raven platform are Futaba S93572HV sBus servos (specifications are provided in Table 2). Two servos are employed, one for each wing, in order to obtain independent wing control. Based on the electrical consumption and the operating point of the motors, using value of 41 W (5 A at 8.2 V), the efficiency of motors was determined to be 45%, meaning the peak power output requirement to flap is 18.5 W, which we have also previously confirmed using dynamometer measurements. 20
Futaba S93572HV sBus servo specifications.

Designing wings with integrated solar cells for these motors with such low efficiency will put unnecessary design constraints on the system. Therefore, we want to first estimate the realistic efficiency for the powertrain. We have used a single high-efficiency DC electric motor and gear train with previous FWAV platforms. 71 High-efficiency motors (>90%) and high-efficiency gear trains are available from vendors, such as Maxon, which use an ironless rotor and stronger NdFe magnets to reduce eddy current losses. Therefore, this drive train can be configured with a motor and gear train combination, which are each capable of 90% efficiency, resulting in a combined efficiency of 81% when properly matched. Therefore, this configuration requires only 22.8 W to be provided by the solar cells.
Since high efficiency, lightweight motors meeting FWAV requirements are currently very expensive, the possibility of a crash during flight test or overheating of the motor in a wind tunnel makes it cost prohibitive to use them for actual testing purposes. Therefore, all flight tests and wind tunnel characterization to validate the modeling and performance of wings with integrated HE solar cells were only conducted with the Futaba S93572HV sBus servos currently employed on the Robo Raven platform.
Prediction of solar cell requirements
A flexible HE gallium arsenide (GaAs) solar cell was identified. These flexible HE cells are manufactured by Alta Devices (Sunnyvale, CA) using a metalorganic chemical vapor deposition process to grow a thin layer of GaAs. This layer of GaAs is coated with metal, which provides electrical contact and light reflection. The combination is removed via an epitaxial lift-off (ELO) process, which leaves a thin, flexible, and lightweight solar cell. These thin film flexible solar cells can be up to 30.8% efficient if they are dual junction, while the single junction cell are observed to be 24% efficient. A solar cell configuration capable of delivering 1.5 W of power was chosen.
Through previous investigations, the effects of integrating the A-Si cells are well known; however, integrating other solar cell materials may change their behavior due to differences in mass and stiffness. Comparison of the properties of the A-Si and GaAs solar cell modules can also be seen in Table 3. Mass values reported in Table 3 were obtained from measurements via a scale with 0.1 g resolution. Voltage and current values were provided by the manufacture specifications, validated, in part by measurement using digital multimeters when exposed to sunlight in College Park, MD, USA The A-Si modules came in encapsulation that needed to be removed to reduce the module’s stiffness and mass. In the case of GaAs modules, they were provided without encapsulation.
Comparison of A-Si and high-efficiency (HE) GaAs solar cell modules (measured and calculated from measurements).

Given that a high-efficiency motor and gear train combination will require 22.8 W, it is possible to determine the number of solar cells required to provide power under the condition of the sun being at its lowest solar altitude. Using the value for the solar flux incident on the wings during flapping determined from our modeling, which was 0.51, the corresponding power requirement would be 44.7 W. At 1.5 W per HE solar cell, a total of 30 solar cells will meet the power requirements. It is important to note that if cells are placed on the body and tail, the orientation at those positions and the fact that they are not changing position means the incident value is increased to 0.76. For Robo Raven IIIv5, up to six cells can be integrated into the tail and body, which would add an additional 2.25 W of power generation. This means that only 12 GaAs modules will be needed to be integrated into each wing for a total of 24.
Configuration of solar cells in wings and wind tunnel measurements
A test stand design was developed and utilized in previous flapping flight work. 68 Similar approaches with load cells have been used in other flapping research work. 72 This design was modified to provide variable pitch capability to investigate different pitches. This modified design was used to characterize Robo Raven in previous works.18,21,22,73 The test stand was equipped with the same model of servos used in flight, Futaba high-speed and high-torque actuators. The servos motors were powered by a DC power supply with motor control signal provided by an Arduino Nano, and the same microcontroller used in flight. The left wing was instrumented with an American Digital E5 optical encoder to record the wing positions and flapping amplitude. An ATI Mini40 six-axis transducer was utilized to record forces and moments. The force transducer is capable of independently measuring all six components of force and torque using a Cartesian coordinate system and was calibrated by ATI to measure up to 40 N in the X and Y directions with a resolution of 1/100 N (1.02 g) and 120 N in the Z direction with a resolution of 1/50 N (2.04 g). Data were recorded using a LabView VI interfaced with a National Instruments data acquisition system. During operation, data were gathered for 5 s at 1000 samples per second to constitute one trail. Flapping was started and stopped before and after each capture window to ensure that the data were indicative of steady-state operation. Forces were determined by averaging trail data over multiple flapping cycles inside of that 5-s capture window. Six trials were recorded for a given flapping frequency, from 1 Hz, 2 Hz, 3 Hz, and 4 Hz (for a total of 24 trials). The average of the six trials for a respective flapping frequency was then calculated. Testing was conducted with and without airflow. When data were recorded in airflow, measurements were recorded at 5 m/s air speed (as measured by a pitot tube) in a wind tunnel, which is similar to the air speed experienced during flight. 18 A schematic of the testing setup is shown in Figure 7. To prevent issues with motor heating, which could skew the results, the motors were cooled between trials.

Testing setup schematic.
Both regular wings and solar cell wings were tested. From Robo Raven IIIv4, it was determined that placing the solar cells in the same location along the front spar would achieve similar coverage as that of the lower efficiency solar cells. Therefore, a solar cell configuration of three rows of HE solar cells oriented lengthwise parallel to the front spar with four solar cells in each row was adopted for wind tunnel and flight testing. This design can be seen in Figure 8 with design details provided in Table 4.
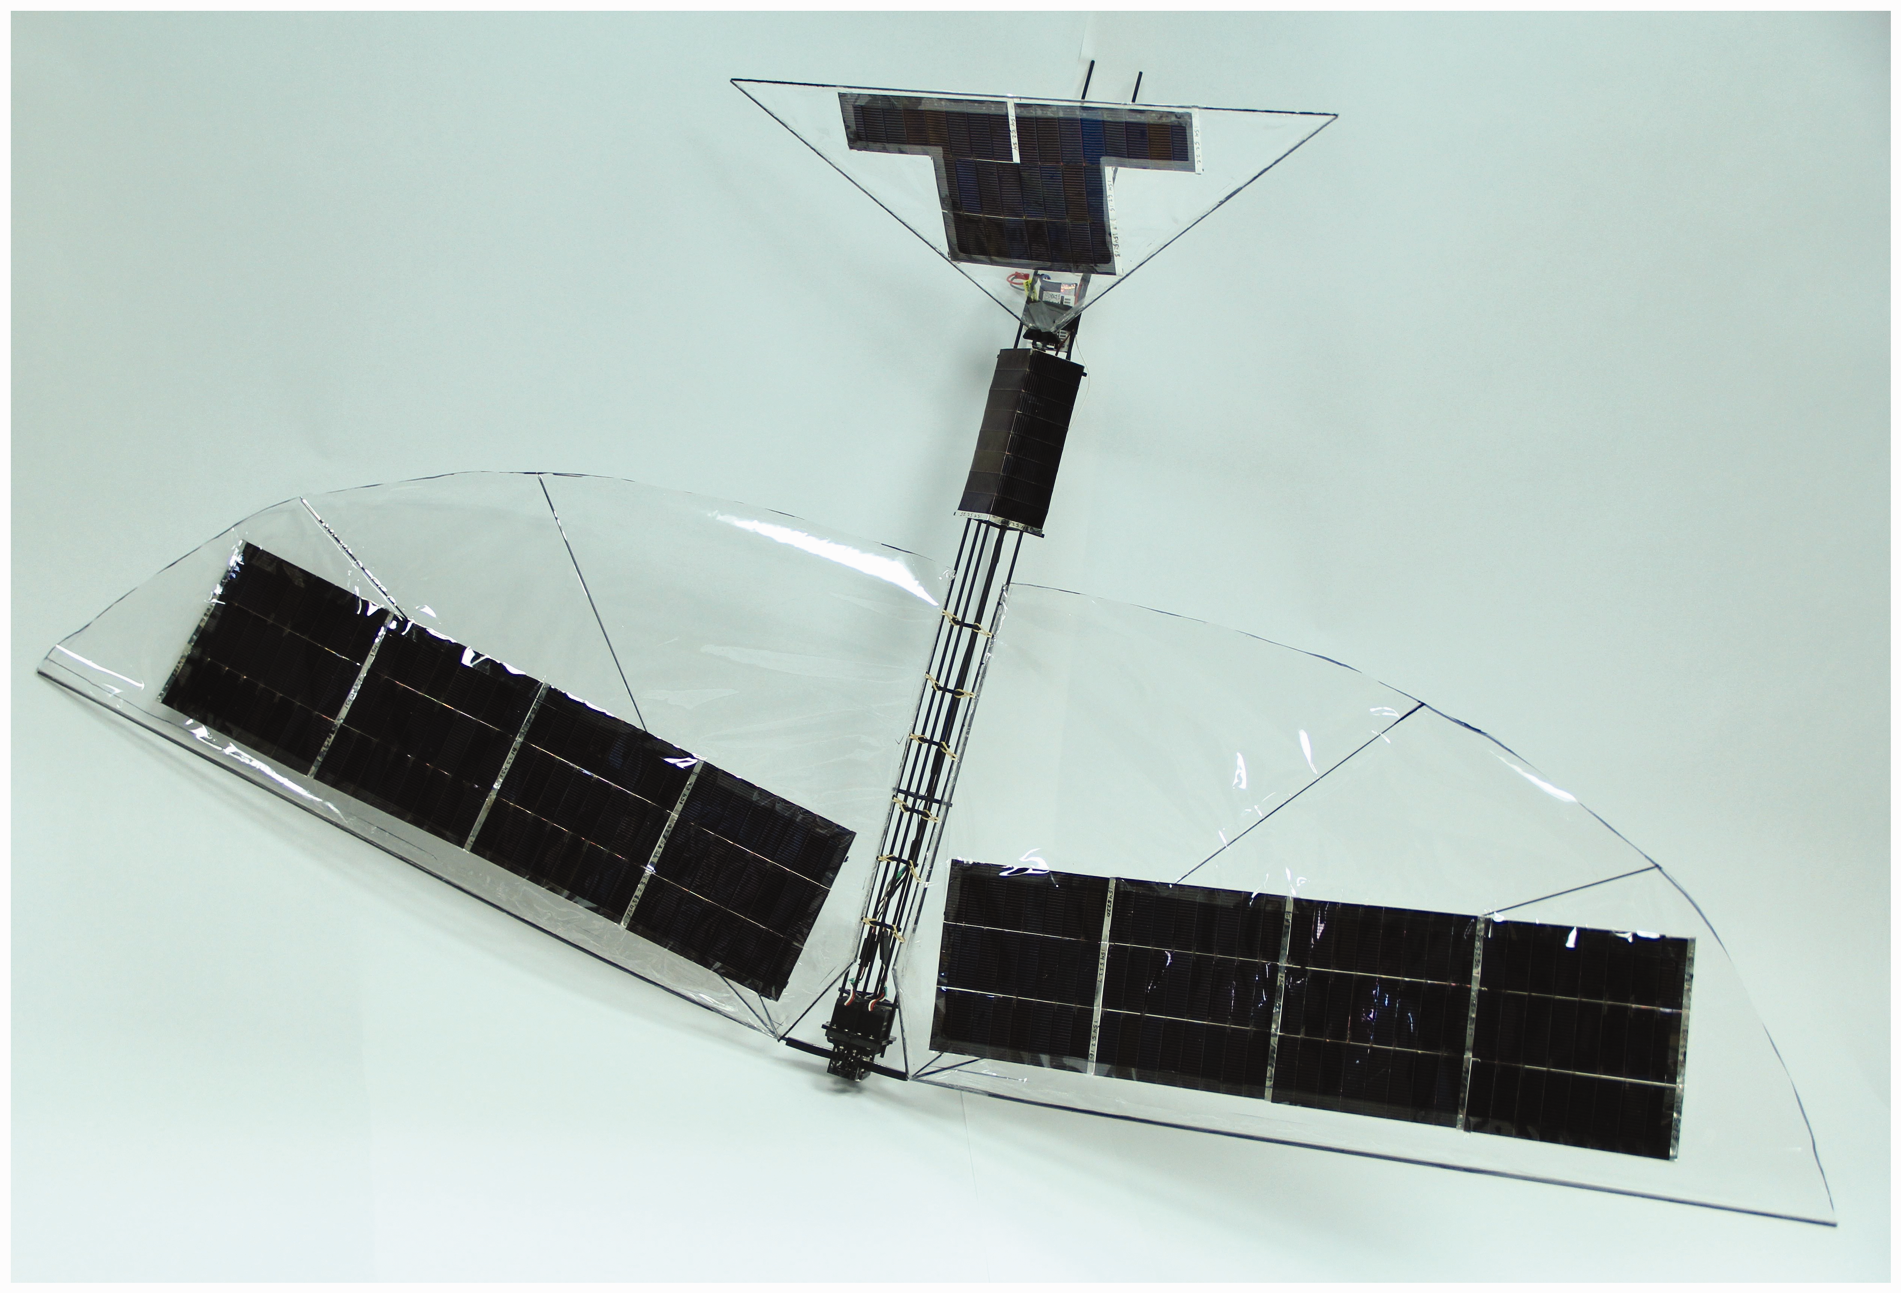
Robo Raven IIIv5—Flapping wing aerial vehicle with integrated high-efficiency GaAs solar cells.
Specifications for Robo Raven IIIv5 platforms.
Results for the effect of integrating HE solar cells in the wing can be seen in Figure 9. We previously measured and modeled a significant reduction in flapping amplitude with flapping frequency due to torque limitations of the servo motor. 70 The heavier and stiffer wings and greater forces generated by the wings also end up in a higher reduction in flapping amplitude. This can also be seen in the comparison of the thrust model in equations (24) and (25) with the test stand measurements, seen in Figure 10. The integration of HE solar cells decreases thrust by 15% at flapping frequencies of 2 Hz, which corresponds to a wing stiffness increase of approximately 50%, consistent with the measured stiffness, and a drag increase of 60%.

Comparison of the measured and modeled flapping amplitude versus flapping frequency, which exhibit degradation due to torque limitations of the servo motors, at a 0° angle of attack for regular mylar wings and wings with high-efficiency (HE) solar cells.

Comparison of measured and modeled thrust generated at various flapping frequencies between regular wings and wings with high-efficiency (HE) solar cells integrated.
Insight into the parameters in equation (32) can be obtained by running experiments in the wind tunnel with and without air to determine the lift and thrust forces due to flapping, as well as the aerodynamic characteristics of the platform. From these measurements, we can predict the steady-state flight velocity, and the subsequent total lift of the platform. First, we note that the drag force is directly related to the velocity of air in the wind tunnel, Vwt and the difference in thrust force with and without air (i.e. the residual thrust), 
Next, it is noted that we can also measure the lift force, FL, in a similar manner

For symmetric flapping, FL will be 0. Having determined the coefficients CD,
p
and CL, from equations (40) and (41), it is possible to determine the steady-state velocity, Vss, of the platform during flight and the subsequent lift that is generated, as follows


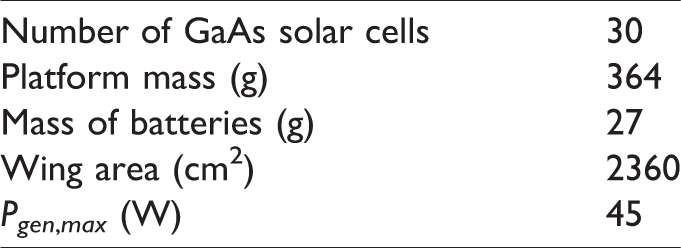
It is interesting to note that the determination of total lift in equation (43) is independent of the wind tunnel velocity, and depends only on the test stand measurements. This is one advantage of using the 6-DOF load cell to determine thrust and lift forces simultaneously. Using the measured platform weights of 364.1 g for wings with HE solar cells and 316.3 g for regular wings, it was possible to subtract the weight from the total lift, calculated using the test stand measurements in equation (43), to determine the payload capacity of both platforms, as seen in Figure 11. It is important to note that at a flapping frequency of 1 Hz, there is insufficient lift for the platform to fly, therefore that payload capacity is not reported. Despite the nearly 50 g greater platform weight and another 50 g lower thrust, the predicted payload capacity was nearly the same at higher flapping frequencies for both platforms. An explanation for this can be obtained by comparing the lift coefficients in Figure 12 between wings with integrated HE solar cells versus regular wings. While at lower flapping frequencies the lift coefficients are similar, producing ratios of nearly 100%, at higher frequencies the ratio increases significantly to 150%, which essentially offsets the lower flight velocity due to the reduced thrust resulting in the similar payload capacity for wings with and without HE solar cells. The improvement in lift coefficients could be due to the ability of the wings with the stiffer HE solar cells better maintaining an aerodynamic profile during flapping.
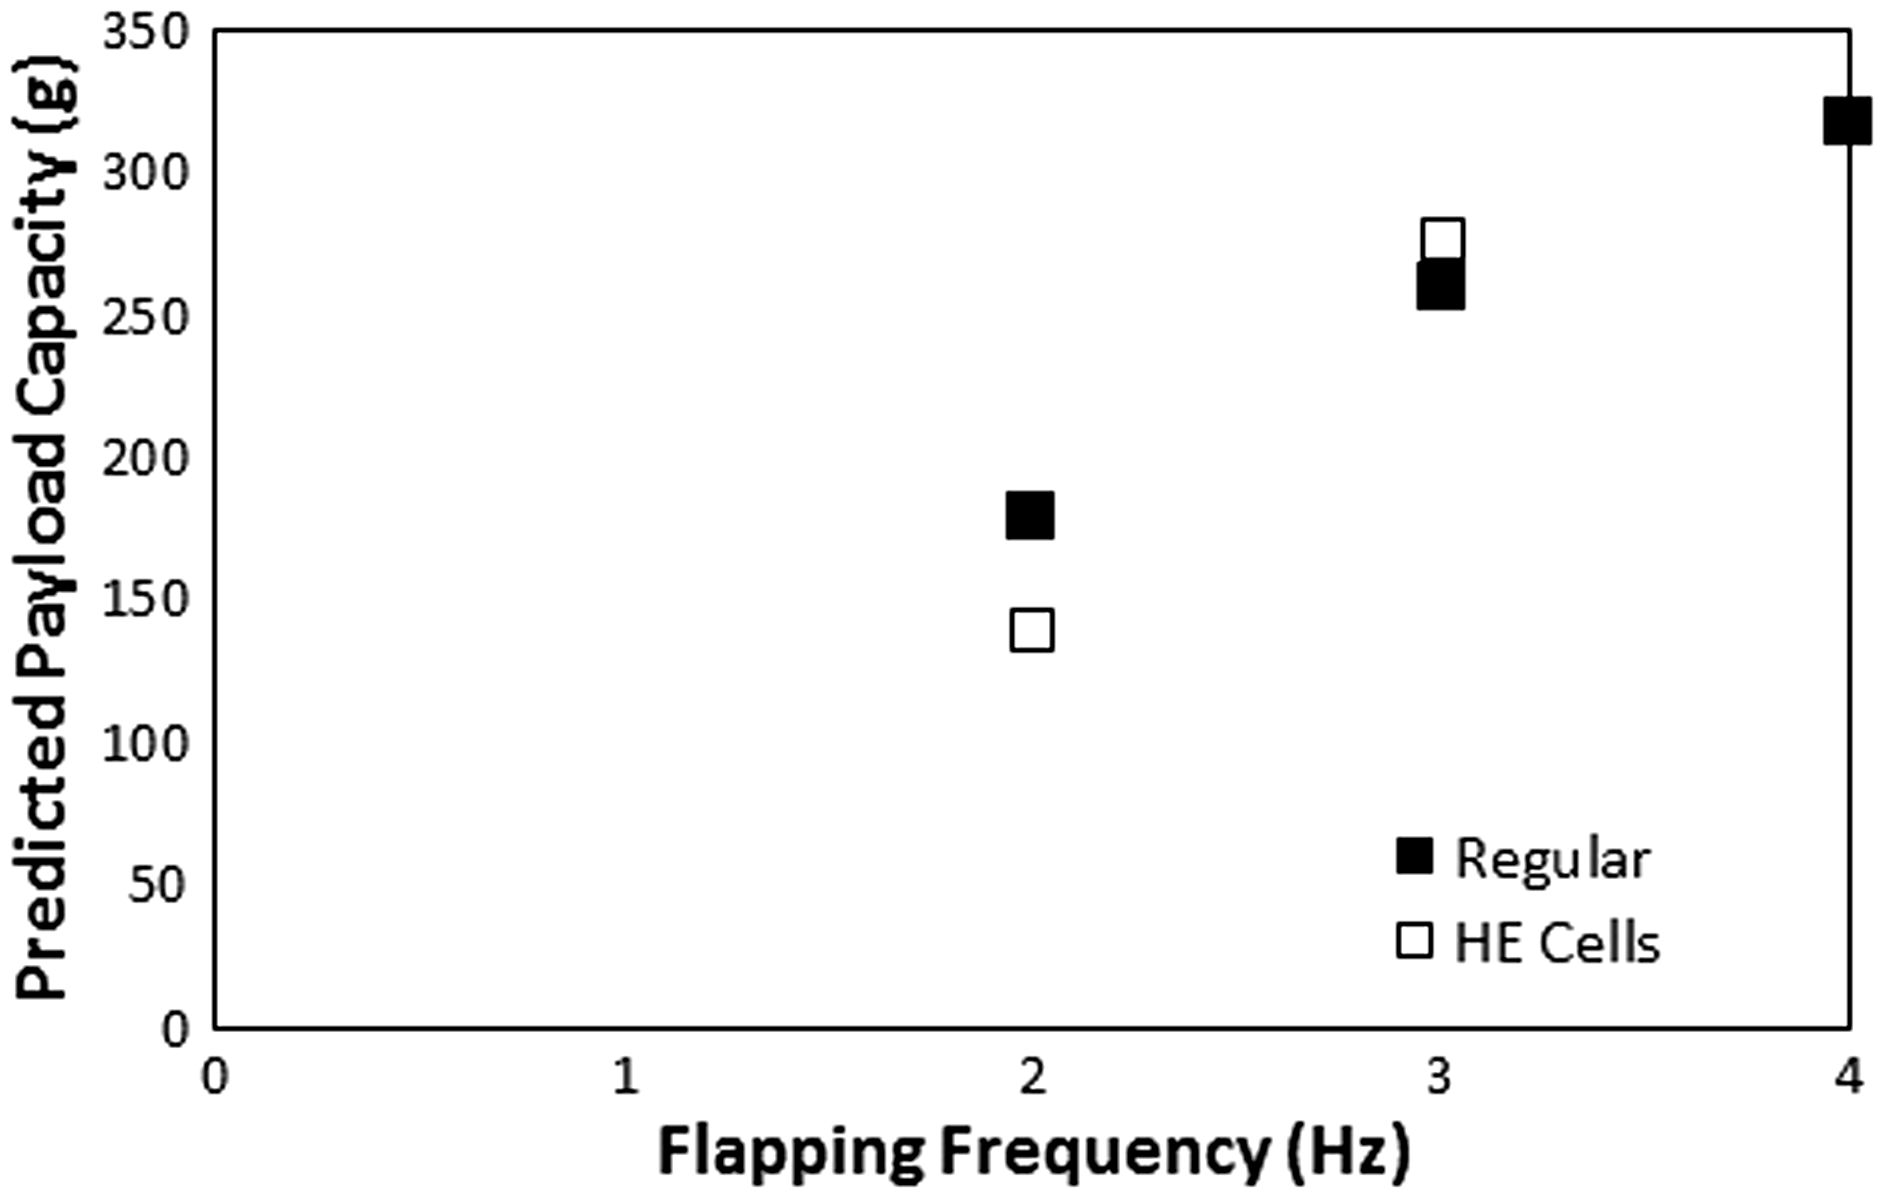
Predicted payload capacity versus the flapping frequency for regular wings and wings with high efficiency (HE) solar cells. At a 1 Hz flapping frequency, there is insufficient lift to fly, therefore those calculations are not reported.

Ratio of lift coefficients for wing with integrated high efficiency (HE) solar cells versus regular wings indicating better lift from the wings with HE cells due to the greater stiffness, which offsets the reduction in thrust producing a similar payload capacity between the wings.
Flight test with high efficiency solar cells
After characterizing forces on the test stand, the flight platform was taken outdoors to verify flight feasibility. While the load cell measurements provided insight into the effects of integrating HE solar cells into the wings on the subsequent aerodynamic force production, they are still not a completely accurate representative of in-flight performance, since the actual AOA varies during flight due to the oscillations in thrust and lift forces. For this reason, flight testing was critical for determining the basic flight feasibility. Flight tests were conducted inside of the University of Maryland Fearless Flight Facility (F3), a netting enclosed outdoor flight space. Flights tests were conducted on days where the wind speed was below 2 knots (1.03 m/s) using a 7.4 V 470 mAh LiPo battery for power. The platform was hand launched and allowed to reach steady flight. Rudder control was only utilized during the launch period and to avoid obstacles. Sustainable flight was possible. Video frames of the flight footage are shown in Figure 13 with successive (nonconsecutive) frames going from top to bottom from left to right. It can clearly be seen that the results were able to translate into a flight-capable platform with sufficient battery capacity for enabling the desired landing time.

Video frames from the flight of Robo Raven IIIv5.
Electrical performance
To ascertain that HE solar cells are capable of generating substantially more power than previous versions of Robo Raven III, electrical tests were conducted on the actual HE solar cells. Voltage for an array of GaAs solar cells was measured outside under sunlight in College Park, MD. On the day of testing, the peak altitude was at 71.2º and 176.9 east of north as provided by the previously noted reference. Solar cells have a characteristic I–V curve between the open circuit voltage and short circuit current where current and voltage are inversely proportional. Since the highest voltage and highest current do not occur simultaneously, resistors were used to load the solar cells and enable measurement. The average of the six I–V curves models based on this experimental data, and the resulting power, is provided in Figure 14. It is important to note that the solar flux varies with location throughout the globe, so knowing the flux at those locations relative to College Park, MD will enable the results to be scaled accordingly.

The average I–V and corresponding power curves measured over six GaAs solar cell modules.
The power draw for one servo driving a HE wing is compared to one servo driving an unmodified mylar wings in Figure 15. Using the analysis in equation (39) and the payload results in Figure 11, it was possible to predict the time-to-land, as seen in Figure 16. A specific energy capacity of 414 J/g for a LiPo battery used for the calculations. The increased payload capacity at the higher flapping frequency does offset the slight increase in power consumption, so that nearly 2500 s of flight time is possible after the sun is lost, which is a significant amount of time to allow the platform to find and locate a location to rest and recharge the next day before resuming flight.

Comparison of measurements of electrical power required to flap a single wing using high torque servo at 8.2 V between regular mylar wings and wings with high-efficiency (HE) solar cells.

Predicted time-to-land for wings with HE solar cells versus frequency based on the predicted payload capacity. Since, as previously stated in Figure 11, the platform is incapable of flight at 1 Hz, those calculations are not reported.
At our location, the measured electrical performance of the HE solar cell modules underperforms the specifications provided by the manufacturer. Testing location, time of day, variation from ideal flux rating, and handling outside of laboratory conditions without encapsulated contribute to the lower performance.
The manufacturer provided calibration information for these solar cells using an artificial light source of 1000 W/m2, which indicated an open circuit voltage of 8.5 V and short circuit current of 200 mA per module prior to shipping. Although the results reported for less than optimal conditions, it is reasonable to make predictions that it is possible to achieve performance closely matching the specifications of the manufacturer, which is a peak output of 1.5 W per module, when in comparable solar flux.
It was also possible to measure the energy generation for the HE cells while a single servo flaps a Robo Raven IIIv5 wing on a test stand placed outside in direct sunlight. The results can be seen for power generation by the HE cells in Figure 17 and the battery voltage in Figure 18. The results for the power generation are consistent with power generation measurements for A-Si solar cells in Robo Raven III previously reported in Perez-Rosado et al. 45 Using the flapping amplitude reported in Figure 9 and the measured I–V curves for the HE cells in Figure 14, it is possible to predict the power generation by the wing, which indicates some deviation attributed to wing deformations that were previously correlated to the level of thrust production by the wings. However, the results do indicate that the average power generation is greater than 92% of the maximum. The effects on the battery discharge can then compared with the Robo Raven I platform in Figure 18. Results are also presented for predictions from a conventional LiPo battery model down to a cutoff voltage of 7.4 V. With just the HE cells in the wing, the flapping time increases from 150 s to 520 s, with an increase of 247%. This further confirms the anticipated improvement in the flight performance using HE cells in Robo Raven IIIv5.

Power generated by HE cells in a Robo Raven IIIv5 wing while flapping at 4 Hz.

Predicted and measured voltage of battery with (Robo Raven IIIv5) and without (Robo Raven I) high efficiency (HE) solar cells discharging while a single servo flaps a wing at 4 Hz.
Conclusions
In this paper, we have presented the following: (1) an enhanced model for energy harvesting of flapping wings that takes into account the orientation of the wings relative to the sun during flapping, (2) the effects of integrating the HE solar cells on the payload capacity of the platform that affects the time-to-land and the power draw used in the design of the platform, and (3) defining the conditions for designing the wings with HE solar cells to match the potential power requirements of the platform. Unlike previous work, with lower efficiency (<6%), flexible A-Si solar cells were incorporated into the wings of a FWAV to allow for the battery to recharge without using a battery charger. The goal of this work was to develop a framework for designing a multifunctional wing with HE (24% efficiency) flexible GaAs solar cells such that the battery can support power spikes or provide backup power when needed. The framework consisted of: (1) predicting the energy generated by the solar cells, (2) predicting the number of solar cells required to meet the power requirements of the FWAV, (3) determining the effects of placing solar cells in the wings on the thrust and lift generated by flapping, and (4) a system model of flapping flight to predict the flight mass and the payload available for carrying components such as batteries to provide additional power in the event of power spikes and in the event that the FWAV needs to land to recharge.
The model for the energy generated by the solar cells considers changes between solar cell area and solar flux incident on the multifunctional wing brought about by various headings and wing position during flapping. A key finding was that the fraction of solar flux incident on the FWAV will be only 0.94 during flight when the sun is at its zenith, and that the fraction of solar flux incident on the solar cells in the wings would be further reduced to 0.88 due to flapping. At the lowest solar altitude, these values will reduce to 0.68 and 0.63, respectively. If a safety factor of 1.25 is employed, then the lowest value for the purposes of design will be 0.51. Flexible GaAs solar cells were integrated into the wings, body, and tail of a FWAV known as Robo Raven IIIv4. The proposed modeling framework showed that a replacement motor and gear train combination with an efficiency of 81% would be capable of matching the power output of the HE solar cell configuration for Robo Raven IIIV4 to achieve flight where batteries are only used in events of power spikes and to provide additional time for the FWAV to land for recharging.
In addition to determining the resulting wing design with integrated HE solar cells capable of meeting the power requirements for flight, the resulting payload capacity for the battery backup was also determined for the wing design. Measurements were made on a test stand in a wind tunnel, and an analysis was developed for predicting the effects of integrating the HE solar cells on the thrust and lift production of the flapping wings, as well as the change in the aerodynamic performance. These predictions were validated with experimental measurements, and it was determined that the integration of solar cells reduced thrust because of the wings being 50% stiffer with a 60% increase in drag during flapping. However, the lift coefficient of wings without HE solar cells was 70% less than those with HE solar cells, which offset the lower steady-state flight velocity associated with the lower thrust, resulting in a similar payload capacity for both wing designs that enables up to 2500 s of time to safely land in an area where the batteries can recharge the next day. Outdoor flights in a netted test facility with a backup battery validated the flight capability of the platform, while electrical performance validation using test stand measurements of the power generation by a Robo Raven IIIv5 wing indicated that HE solar cells improved the battery discharge time by 247% to a cutoff voltage of 7.4 V for a single servo flapping the wing at 4 Hz.
Footnotes
Declaration of conflicting interests
The author(s) declared no potential conflicts of interest with respect to the research, authorship, and/or publication of this article.
Funding
The author(s) disclosed receipt of the following financial support for the research, authorship, and/or publication of this article: This work was supported by Dr Byung-Lip “Les” Lee at the Air Force Office of Scientific Research through grant FA9550-15-1-0350.