
Abstract
High-speed flight in GPS-denied environments is currently an important frontier in the research on autonomous flight of micro air vehicles. Autonomous drone races stimulate the advances in this area by representing a very challenging case with tight turns, texture-less floors, and dynamic spectators around the track. These properties hamper the use of standard visual odometry approaches and imply that the micro air vehicles will have to bridge considerable time intervals without position feedback. To this end, we propose an approach to trajectory estimation for drone racing that is computationally efficient and yet able to accurately estimate a micro air vehicle’s state (including biases) and parameters based on sparse, noisy observations of racing gates. The key concept of the approach is to optimize unknown and difficult-to-observe state variables so that the observations of the racing gates best fit with the known control inputs, estimated attitudes, and the quadrotor dynamics and aerodynamics during a time window. It is shown that a gradient-descent implementation of the proposed approach converges ∼4 times quicker to (approximately) correct bias values than a state-of-the-art 15-state extended Kalman filter. Moreover, it reaches a higher accuracy, as the predicted end-point of an open-loop turn is on average only ∼20 cm away from the actual end-point, while the extended Kalman filter and the gradient descent method with kinematic model only reach an accuracy of ∼50 cm. Although the approach is applied here to drone racing, it generalizes to other settings in which a micro air vehicle may only have sparse access to velocity and/or position measurements.
Introduction
Quadrotors have received considerable attention in recent years, thanks to their mechanical simplicity and good maneuverability combined with hover properties. They have offered new possibilities in a variety of fields like aerial photography, inspection and even transportation. With recent advances in on-board computation and sensor technology, aggressive maneuvering has come within reach of many applications. To further stimulate aggressive and fast flight, autonomous drone racing is gaining interest. The first ever autonomous drone race was held by the International Conference on Intelligent Robots and Systems (IROS) in 2016. 1 A track consisting of gates had to be flown autonomously in a pre-specified order. The robot had to achieve this as fast as possible, while only relying on onboard sensors and processing. Figure 1 illustrates the setup of the 2016 indoor track.

The map of the IROS 2016 drone race. In this drone race, the UAVs have to fly through orange gates in a pre-specified order as fast as possible.
Autonomous indoor drone racing brings many new challenges to the fields of quadrotor navigation and control. One initial challenge is the navigation without any external positioning system like VICON, Optitrack or GPS. Typical approaches to this problem make use of on-board cameras and use Visual Inertial Odometry to integrate position. This type of algorithms rely on integrating inertial information, tracking visual features over several frames and solving an optimization problem to retrieve the most likely solution. In autonomous drone racing, on top of this position estimation algorithm, gate detection is often needed when the position of gates is not precisely known, or when gates contain moving parts—as is the case in the IROS competitions. With the limited computational resources of small indoor drones, to achieve the fast speeds needed in drone racing, this paper proposes a navigation solution based solely on gate detection, augmented with inertial measurements and an aerodynamic model. To cope with the sometimes sparse and noisy non-Gaussian visual observations, we formulate the navigation solution as an optimization problem. We then solve it using a gradient descent method. The resulting method provides online estimation of the quadrotor position, velocity and inertial biases using less computational resources than traditional Visual Inertial Odometry. The proposed approach also estimates aerodynamic properties of the quadcopter—which become increasingly important in the case of fast aggressive control. Finally, the approach scales favorably with increasing flight speeds as it keeps performing well even with very few position updates. As a comparison, we use the Kalman filter, which is currently still the default choice for navigation. Since the extended Kalman filter (EKF) is significantly less computationally complex than the unscented Kalman filter (UKF), 2 in this paper we select the EKF as a benchmark. We compare the results with EKF, which is shown to be much more sensitive to visual outliers or other non-Gaussian effects.
In the section Related work, an overview of studies on aerodynamics modeling and state estimation methods is given. The section Quadrotor model will describe the quadrotor model parameters that will be solved. The section State estimation proposes two different approaches for the visual state estimation. First a classic 15-state EKF is developed as benchmark. Then the novel FMINCON-based gradient descent optimization method is proposed to solve the model parameters and states. In the section Experiment setup and result, both algorithms are compared on flight test data and Conclusion summarizes the conclusions.
Related work
Several researchers have already proposed aerodynamics models for quadrotors.3–7 The main object of their studies is to derive a nonlinear quadrotor aerodynamics model to improve the control performance by compensating for the nonlinear terms. In some studies, a detailed aerodynamic model is analyzed through theory and fitted by experimental data. 3 Simplified aerodynamic models are also established from experiments.5,6 It should be noted that their models are all obtained off-line using external measurements, such as GPS, VICON and thrust test beds. Aerodynamic models can also be combined with on-board measurements, for instance from computer vision, 8 in order to better estimate the velocity of the drone on-line. In this article, we employ a simplified aerodynamic model in the trajectory estimation exactly for this purpose.
Quadrotor control heavily relies on attitude estimation from an attitude and heading reference system (AHRS). This system is typically based on inertial sensors (accelerometers and gyroscopes), but also relies on orientation sensors (magnetometer) and/or positioning sensors (GPS, VICON) to estimate inertial sensor biases and compensating for long term drift. Sensor biases become increasingly important as the drone will have to fly longer or temporarily perform feedforward control maneuvers in the absence of sensor measurements. Hence, for drone racing, it is important to estimate them accurately. Here we briefly discuss the sensors and then the filtering employed in estimating both attitude and position or velocity on micro air vehicles (MAVs).
Most systems intended for outdoor environments utilize the magnetometer and GPS-measurements.9–13 The indoor equivalent is the use of a motion tracking system such as VICON or Optitrack. 14 In many applications—like autonomous drone racing, it is required to have accurate state estimation without the help of external systems. The necessary position or velocity measurements can be obtained from multiple sensors. One early option is to use laser scanners.15,16 But a laser scanner contains sensitive optics and mirrors, which are susceptible to shock and vibration problems. 17 Another choice for on-board navigation is RGB-D devices.18–20 The main drawback of these RGB-D devices is that their maximum depth perception range is limited to a few meters.21,22 This is why light-weight and inexpensive on-board cameras which are more robust to vibration and shock, have attracted interest of researchers for the navigation of drones. Generally, visual odometry (VO) algorithms 23 using a stereo camera or monocular camera are used for estimation of the MAV’s translation and rotation between frames.24–28 However, generic visual odometry approaches necessitate detecting features, matching corresponding features and estimating motions, which leads to a heavy demand for on-board computational resources and low-frequency estimation. In the meantime, aggressive maneuvers may introduce blur into generic visual odometry and seriously affect the accuracy of estimation. Moreover, in complicated environments like drone racing, dynamic spectators may also interfere visual odometry. Less generic but computationally efficient methods are employed in some specific environments, for instance, using detection of known visual markers to determine position.29,30 However, these methods cannot cope with other generic environments.
Concerning filtering, with white-Gaussian position measurement, Kalman filter and its variants are widely used. It is well-known that nonlinearities in the state update or observation equations can be handled by an EKF11,12,22,31 and that heavy nonlinearities are often handled better by a UKF.30,32,33 Also, there are factor graph-based smoothing methods which can handle nonlinearity and allows multi-rate, asynchronous, and possibly delayed measurements, which have similar performance with an EKF.34,35 We hypothesize that when these measurements get sparser, and their noise distribution moves further away from the Gaussian distribution, it will be better to estimate the attitude, heading, and trajectory in general as an optimization problem that uses more data at a time. In particular, we want to optimize the trajectory and parameters such as sensor biases, given a specified time-window with the corresponding sensor measurements, control inputs, and knowledge of the aerodynamic model. Our approach will be explained below, starting with our dynamic quadrotor model.
Quadrotor model
Dynamic model of quadrotor
Before deriving the dynamic model for quadrotor, two reference frames are introduced (Figure 4).
Earth frame E. The origin of the local tangent earth frame is on the ground, the x-axis xE points to north, the y-axis yE points east and the z-axis zE points down. Body frame B. The origin of the body frame is at the center of mass. Its x-axis xB is in the symmetry plane of the drone and points forward. Its z-axis zB also lies in the symmetry plane and points downward. The y-axis yB is directed to the right, perpendicular to the symmetry plane.
The relative relation between two frames can be expressed by three successive rotations along three axes. In this paper, we use z–y–x sequence to rotate one frame to the other. The corresponding angle of rotation is defined by

According to Newton’s laws of motion, the motion of quadrotor can be described as


In equation (2), the specific force

Gravity acting on the center of mass and expressed in Earth frame is

Combining all forces yields the equations of motion in inertial frame
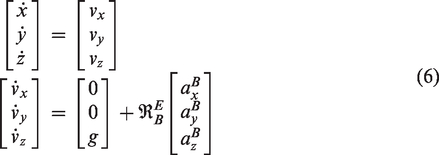

In the system above, we have six states
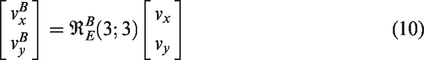
IMU misalignment
Equation (6) reveals that rotation matrix

When a quadrotor hovers, usually the average attitude of the quadrotor and reading of the AHRS are not zero. This is caused by the misalignment of both the IMU and the rotors.
Both factors lead to non-zero required attitude during hover:

Aerodynamic model
There are many factors that can affect the quadrotor’s aerodynamics. Some examples are the quadrotor’s velocity

AHRS bias model
When positioning information is available, the mainstream approach for estimating attitude is merging information from gyro, accelerometer and the positioning system. For instance, the classic 15-state Kalman filter uses accelerometer and gyro measurements to predict states along with GPS measurement updates. It can provide non-biased optimal attitude by estimating the gyro and accelerometer biases as states.
When no continuous external positioning information is available, like in our experiment, a compromise is to neglect kinematic accelerations in the attitude filter. In this case, the biases of accelerometers cannot be estimated.
In the case of attitude determination with constant sensor biases and small angles, the Kalman gain in the Kalman filter typically converges to an almost constant value. To avoid the computational overhead of computing the Kalman gain, complementary filters can be used with very similar results. The structure of the complementary attitude determination filter implemented in this work can be found in Figure 3. In Figure 3,

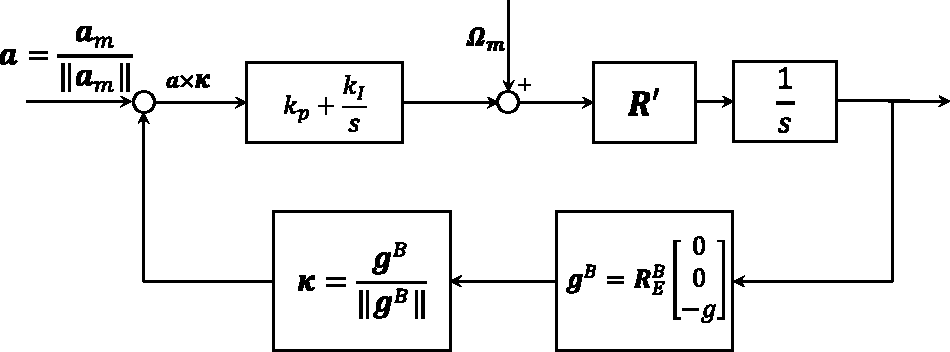
Complementary filter for attitude determination.
Figure 3 shows that the gyroscopes are integrated and the accelerometer is used as feedback to determine attitude. The high-frequency vibrations and centripetal forces which are measured by the accelerometers cancel out on the long term when no constant non-zero accelerations are present. On the long term, the resulting attitude estimation therefore converges to

The gyroscopes measure angular velocity in the three axes of the body frame. Because they are integrated, even small biases cause drift over time, and in this filter the gyro biases
Accelerometers unfortunately also suffer from biases, which is denoted by

AHRS estimation errors can be represented by an erroneous Earth reference frame
The rotation between the real earth E and

With this assumption, on the short term the rotation matrix
Four reference frames have been introduced, namely E,

Full model
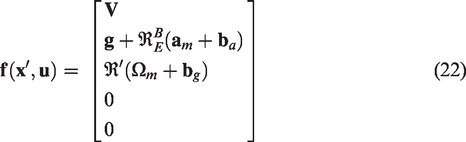
Combining equations (6), (9), and (14), we obtain the full model as


The model in equation (15) contains the following parameters, which are assumed to be constant over short periods of time

State estimation
To estimate the states of the model from the section Quadrotor model, two approaches are derived. As a benchmark, an EKF is developed. Secondly, a novel gradient descent based optimization method to estimate the states is proposed.
Vision-based EKF
The attitude determination Kalman filter uses the inertial sensors as inputs to predict the states of the system, then uses different observations to revise the predictions. When the system is linear, observable and the noise is white Gaussian, then it can be mathematically proven that the Kalman filter provides the optimal solution. If the system is nonlinear, it can be linearized at every time step, which is referred to as the EKF. A classic 15-state EKF is implemented as found in Gross’s work,
2
the difference being that we use vision measurements instead of GPS as positioning information. The following states are used
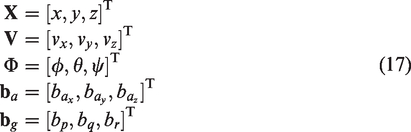


The process equation is

This forms a standard nonlinear system expression

The EKF follows five steps:
(1) Predict the states based on equation (20)

(2) Linearize and discretize the system

(3) Propagate the covariance matrix

(4) Calculate the Kalman gain and update the prediction.

(5) Update the covariance matrix of the state estimation error

Vision-based gradient descent method
According to the gate detection algorithm we used in IROS 2016 autonomous drone race, the vision-based position used as observation in the Kalman filter (equation (19)) has very non-Gausian noise, which can significantly affect the estimation accuracy of Kalman filters. The vision measurement model will be discussed later. Therefore the state prediction is rewritten as a parameter optimization problem in the form of a trajectory matching problem.
Unlike the Kalman filter which estimates continuously varying states like pitch and roll for any moment in time, the proposed gradient descent using the model from equation (15) in essence estimates corrections on top of attitude estimates provided by an external complementary attitude filter.
Since most model parameters like drag and AHRS error are integrated twice to arrive at position, observing the trajectory over a period of time allows for extremely fine observations of these parameters. For instance, a sub-degree attitude error is hard to identify in noisy raw accelerometer measurements. However integrating the consequence of this small angle error, which causes a percentage of gravity to be erroneously double-integrated in the lateral position after several seconds, becomes very easily observable.
The observed trajectory is obtained from the vision pipeline and expressed as a list of n noisy measurements. The predicted trajectory is based on integrating the model presented in equation (15) using attitude from the AHRS and given a set of model parameters
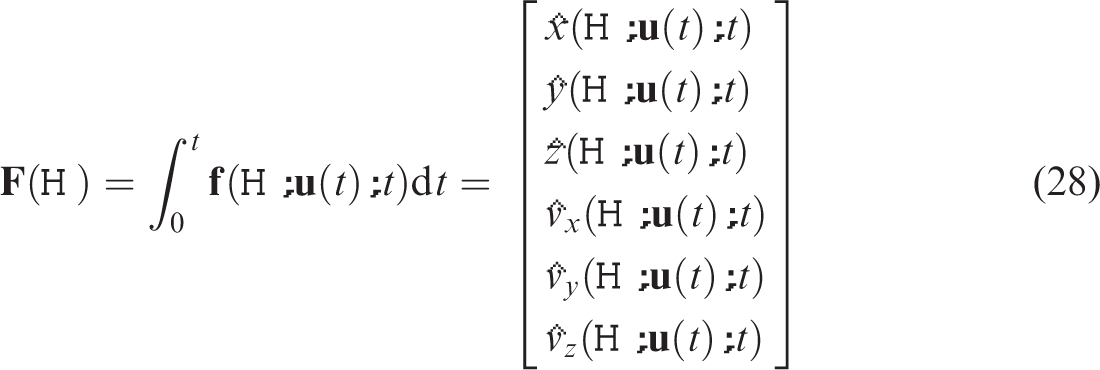
The error between the predicted integrated trajectory and the vision measurements is found as

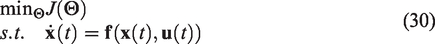
To solve the problem formulated by equation (30), we can apply many types of nonlinear optimization methods to find the optimal parameters


Figure 5 shows an example of the gradient descent approach. The propagation in time of the model from equation (15) for various parameters
A gradient descent method optimizes a set of parameters
Experiment setup and result
Experiment setup
In order to study the performance of state estimation methods, a hippodrome shaped track is used with end circles with radius of 1.5 m and straights of 3 m as shown in Figure 6. Onboard flight data are recorded while flying without computer vision but based on Optitrack position. The data are then analyzed in MATLAB. A Bebop 1 (Figure 7) from Parrot is used as experiment platform. It is equipped with three gyros, three accelerometers, one sonar, one barometer, a front camera and a bottom camera. Only the front camera and IMU are used and the original stock flight-code in the drone is replaced by open-source software from the Paparazzi-UAV project. 39 The AHRS runs on-board and consists of the complementary filter discussed in previous section. The flight time of the test runs is about 100s and the average flight velocity is about 1.8m/s, resulting in about 15 circles of the hippodrome. An overview of data gathered is presented in Table 1.
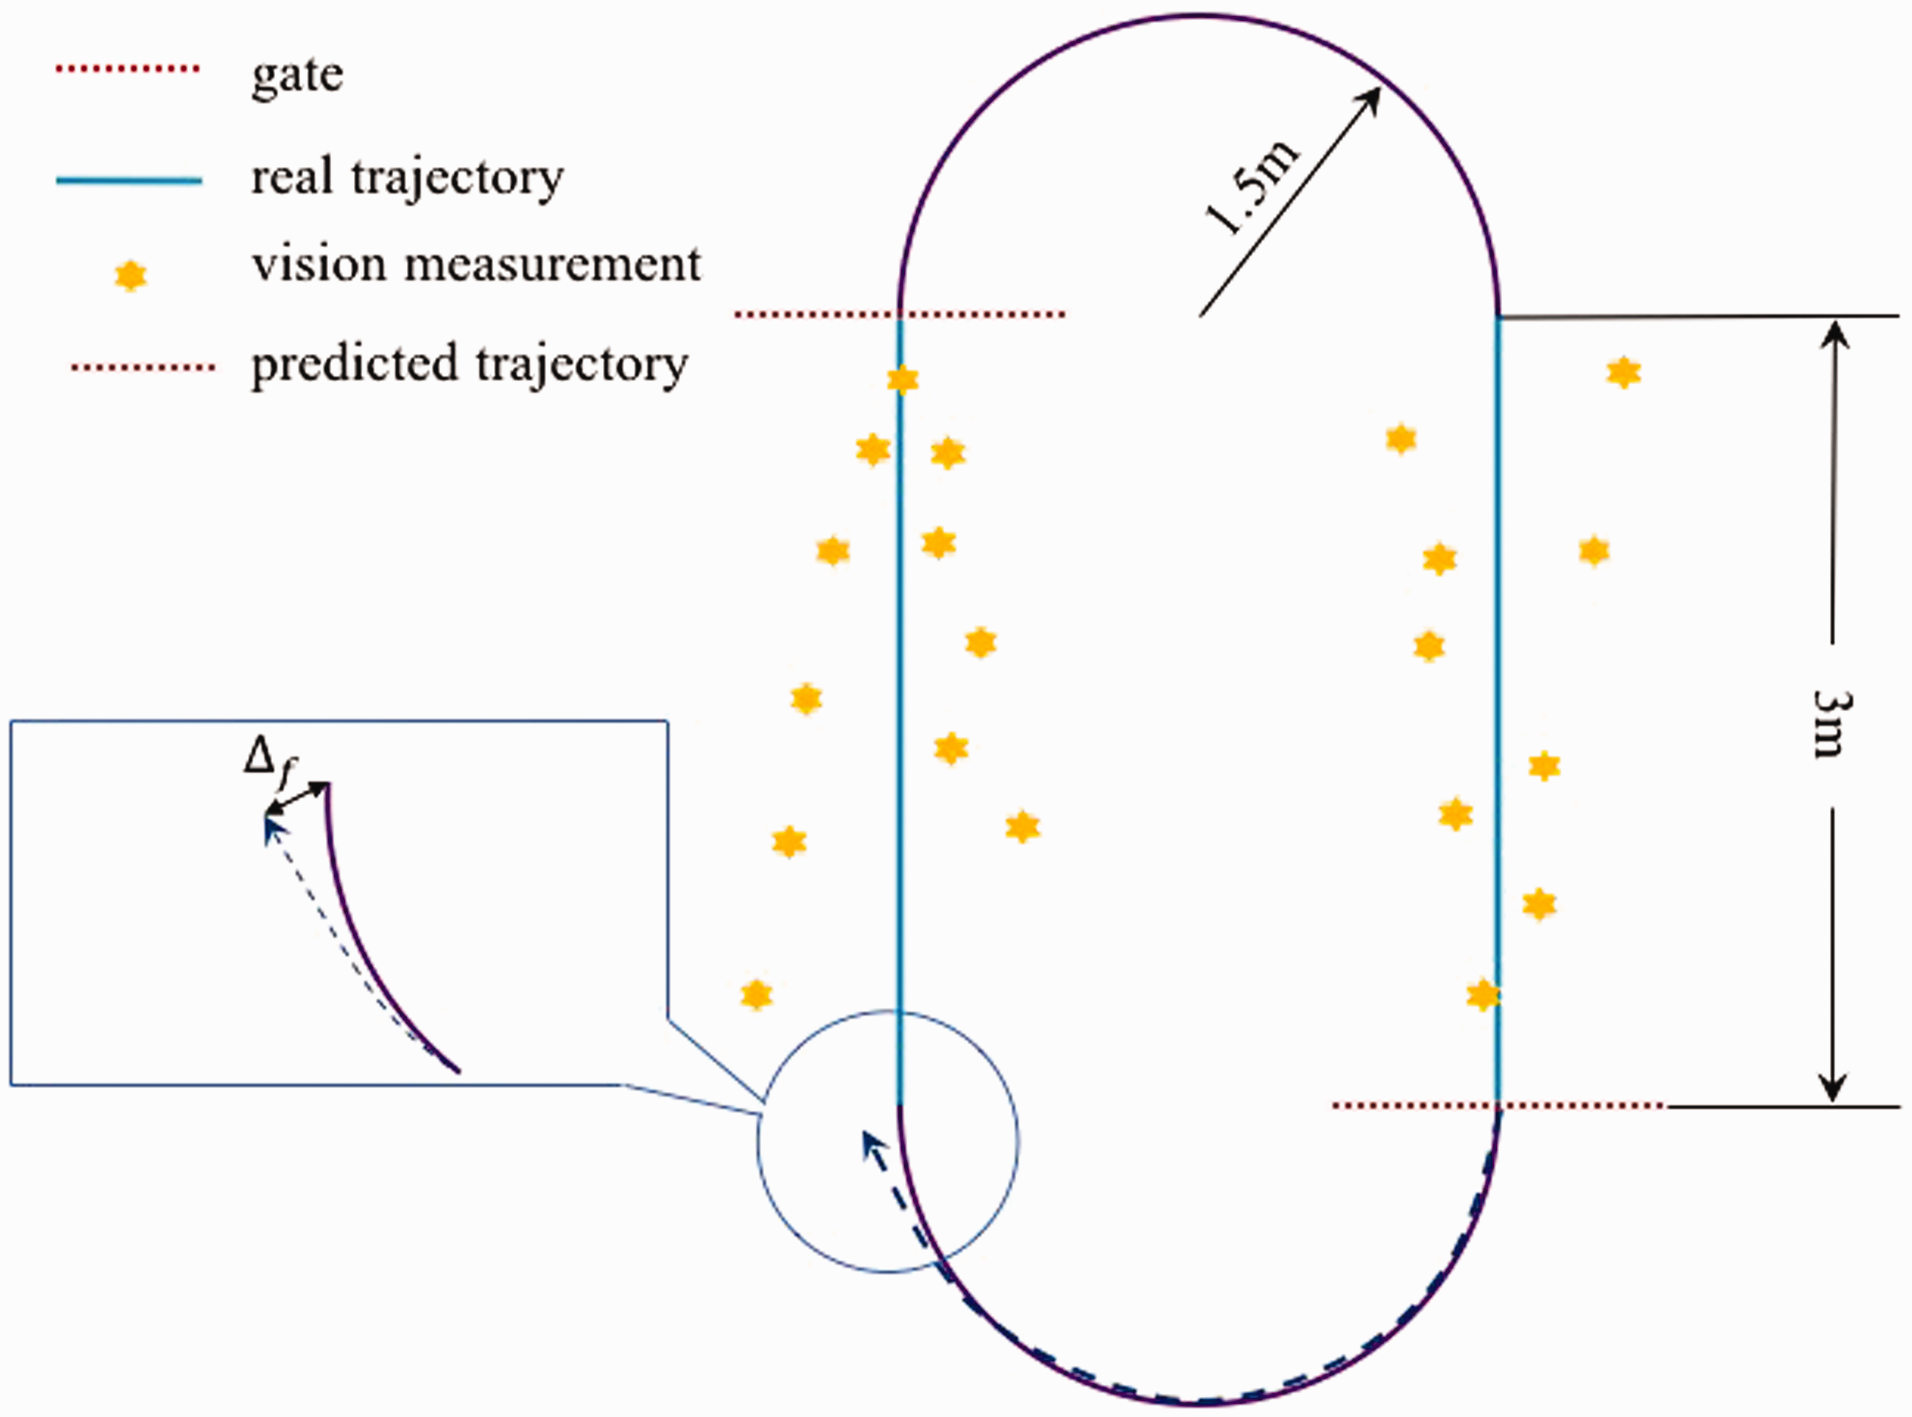
The top view of the experiment track.

The Parrot Bebop 1 hardware is used as experiment platform. All flight code is replaced with open-source Paparazzi-UAV flight code.
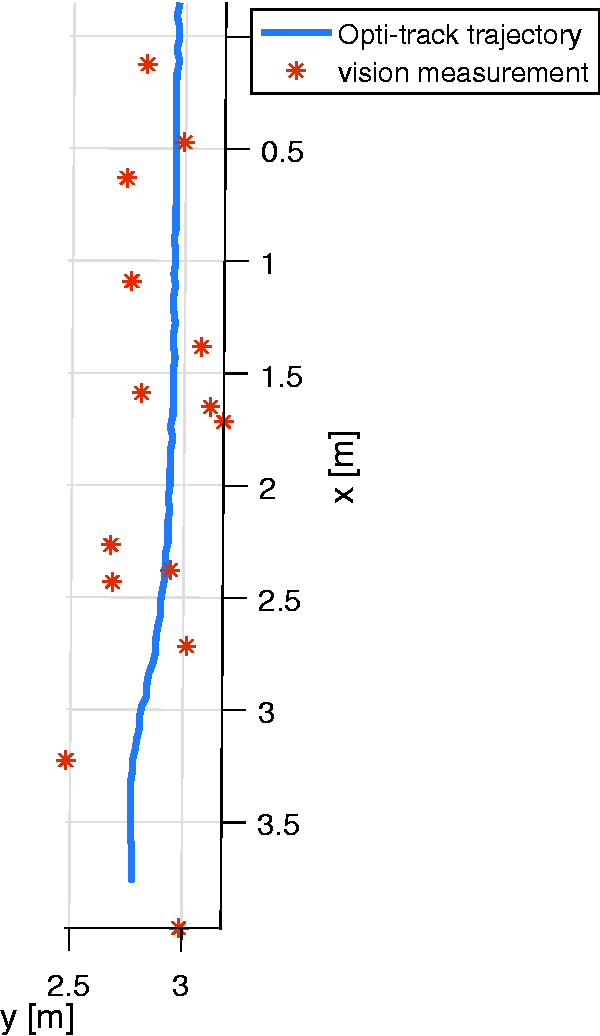
Based on the vision measurement model (equation (33)), simulated vision measurement points (red) are generated around the real trajectory (blue). During the autonomous drone race, only the visual measurement points are available.
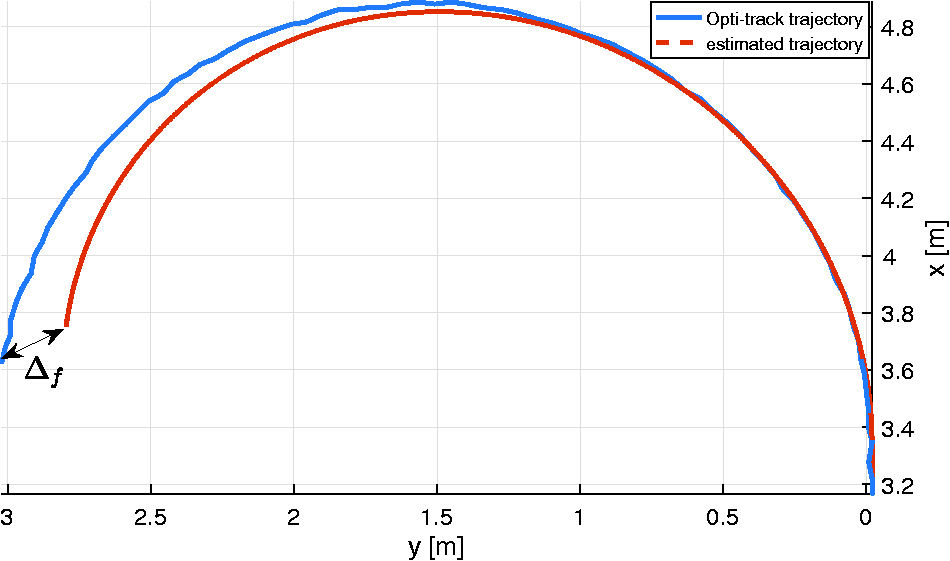
When vision measurements are not available, the quadrotor can only rely on model predictions based on model information and inertial data. This prediction will diverge in time. The better the model prediction is, the smaller the end point prediction error Δ f becomes.
Data gathered during the experiment.

During the IROS 2016 autonomous drone race, we used the bebop 1 onboard camera to detect the gates and provide the position measurements for navigation. In this work, however, noisy vision measurements are generated simulating on-board vision-based gate detections with various levels of accuracy. Along the straight part trajectory, n random points 
The test flights consist of two distinct phases which are shown in Figure 6.
During the straight part (blue line), the gates are in the field of view of the quadrotor and vision-based position measurements are available. The vision-based EKF (VEKF) can run both prediction and update loops. The vision-based gradient descent method (VGD) searches for parameters During the arc (purple line), no position measurements are available but an open-loop coordinated turn is performed. The VEKF can only rely on model prediction and the gradient descent method uses the last estimated parameters and on-board inertial data to propagate the states of the quadrotor. This phase must be limited in time as the open-loop integration is diverging as can be seen in Figure 9.
The test track is designed to resemble an autonomous drone race track, where it is not possible to keep gates in sight at all times. When using fast gate detection as sole means of position information, some maneuvers need to be performed open-loop. But even when gates are in-sight, better model prediction allows the estimation of more accurate trajectories through the noisy visual data. Therefore, as a performance index we selected the prediction error Δ
f
at the final point of the open-loop arc to evaluate the performance of both algorithms.

Analysis of VGD
In this section, we use the on-board flight data and generated vision measurements to analyze the VGD using a MATLAB implementation of gradient descent, FMINCON.
The performance of the gradient descent method is affected by the size of the training data. It is important to investigate how the size of the dataset used to search for 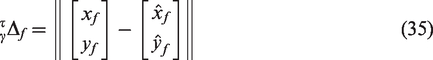
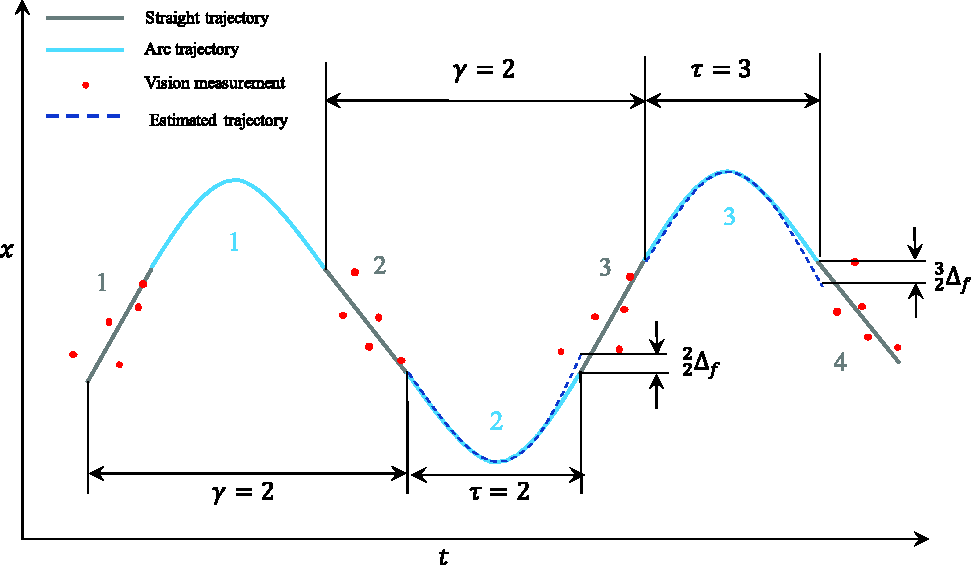
Example test flight data showing the x position in function of time and illustrating the prediction strategy when γ = 2. First, the data of straight lines 1 and 2 are used to estimate
The stopping criteria used in the FMINCON optimization is

With different combinations of τ and γ, a set of 70

Influence of the history length γ on the prediction accuracy
Figure 11(a) shows the prediction accuracy
Comparison between VEKF, VGD and VGD-kinematic
In this section, in order to show the different performance of the gradient descent between the kinematic model and model from equation (15), we introduce a new method called Vision-based gradient descent method with kinematic model (VGD-kinematic). This method has the same principle as VGD except that it is using a kinematic model 38 as prediction model.
In this case, the parameters to be estimated are the bias of accelerometers and gyros, which can be written as

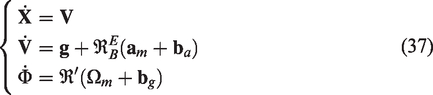
To compare the performance of the of three methods, all three methods are tested using the same on-board data and the same generated vision measurements. In both VGD and VGD-kinematic, γ was set to 3, which means that the flight data of the last 3 straights is used in the estimation of
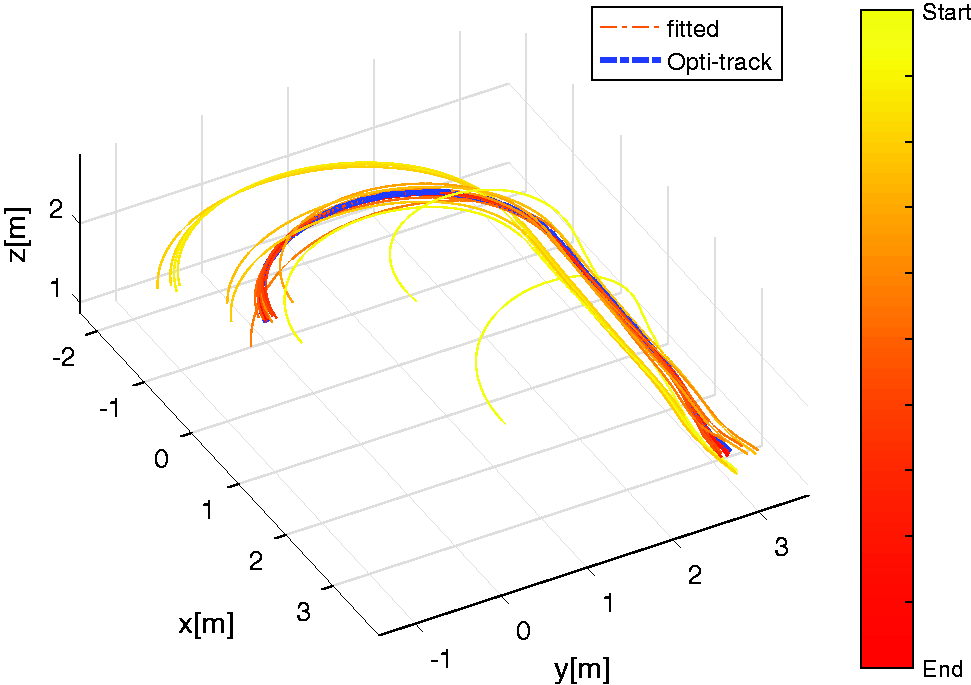
The resulting full flight is shown in Figure 13. In Figure 13, the orange dots are the generated vision measurements from the straight parts of the track. The magenta curve is the estimation result of the VEKF. In the VEKF,
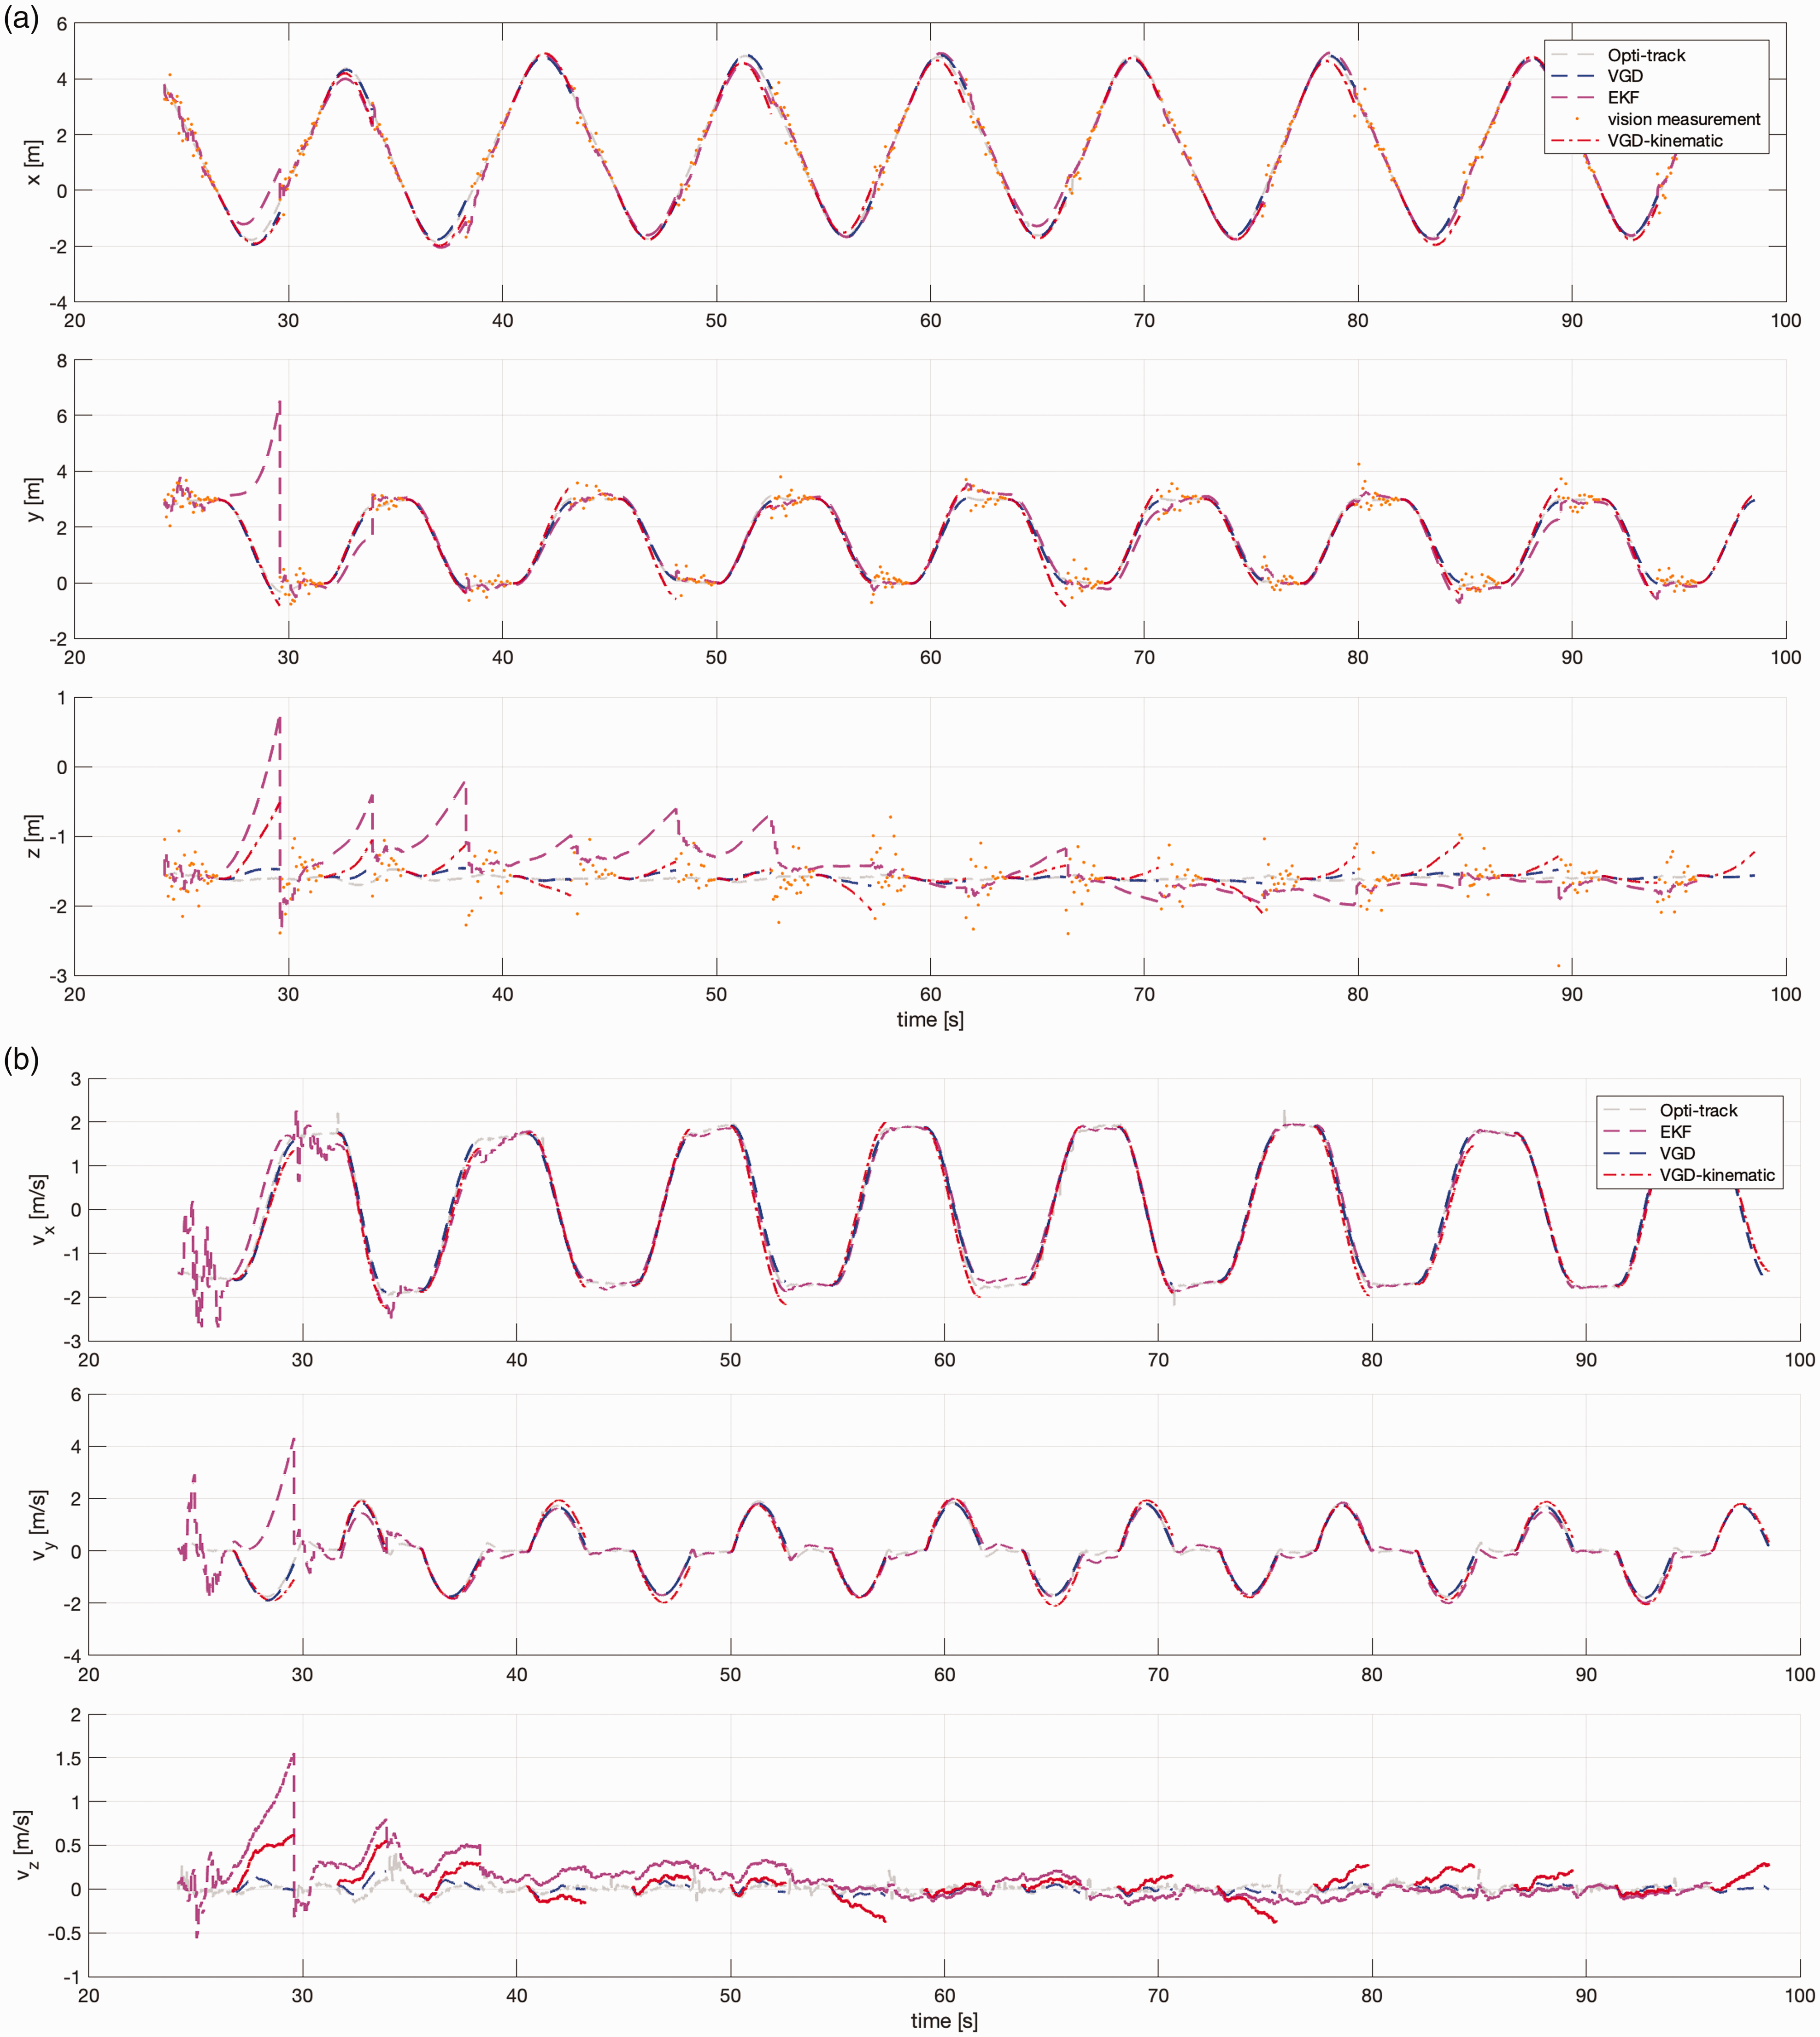
The final point error
Comparison of the position and velocity estimation results of the EKF and the FMINCON-based gradient descent method using inertial sensors and discrete low frequency noise vision based position measurements from gate detections.
The range of

The final point prediction error
Conclusion
Accurate state and parameter estimation is essential for quadrotor control, especially when they perform aggressive maneuver. However, in the environment where only sparse and noisy position measurements are available, a classic Kalman filter can struggle to provide accurate state and model parameter estimation results. In this paper, we presented a novel method that only uses sparse vision measurements to estimate the AHRS error and select aerodynamic parameters of the quadrotor using a gradient descent method. The experiment result shows that our VGD could increase the accuracy of state estimation when compared to a classic Kalman filter in environments where only sparse noisy position measurements are available.
Footnotes
Declaration of conflicting interests
The author(s) declared no potential conflicts of interest with respect to the research, authorship, and/or publication of this article.
Funding
The author(s) received no financial support for the research, authorship, and/or publication of this article.