
Abstract
A new flapping wing aerial vehicle (FWAV) simulation methodology is presented that combines models of the key subsystems: (1) the actuator, (2) the battery, and (3) the wings. This approach captures component interactions that are inherently coupled in order to realize system-level designs for optimal system performance. The approach demonstrates that coupling between wing sizing, flapping motions, and loading conditions propagate into the motor–battery model to alter system-level performance properties. For the actuator subsystem model, a generalized servo motor using empirically derived coefficients to describe torque and angular velocity bandwidth in terms of voltage and current. This model is coupled with a lithium polymer battery model accounting for the nonlinear voltage drop and capacity derating effects associated with loading conditions. For aerodynamic predictions of the wing subsystem, a blade element model for predicting aerodynamic forces is coupled with an elastic wing deformation model that accounts for bending and twisting of the blade elements. System-level performance is then modeled in a design case study by coupling all of the subsystem models to account for relevant interactions, which generates a design trade space spanning a range of wing sizes, airspeeds, and flapping condition. The results from the simulation offer insight into vehicle configuration settings that provide maximum performance in terms of lift and endurance for the Robo Raven II flapping wing aerial vehicle. Experimental validation of the modeling approach shows good predictive accuracy. In addition, the presented framework offers a generalized approach for coupling interacting subsystems to improve overall predictive accuracy and identify areas where component-level improvements may offer system-level performance gains.
Introduction
Small unmanned aerial vehicles (UAVs) are more popular than ever before thanks to a diverse capability set offered by airplanes and quadcopters that incorporate modern electric power and flight controller technologies. Typically, UAV users will select an airplane for missions that are high, fast, and far, while a quadcopter may be more appropriate for missions requiring lower speeds and obstacle avoidance. In this regard, the airplane and the quadcopter are point solutions that excel in their respective mission spaces, but lack robustness if mission needs are drastically changed. However, nature demonstrates that flapping wings provide an elegant solution to this functional tradeoff. Flying animals exhibit impressive capabilities including long range and endurance, aggressive acrobatics, and highly customizable modes of operation. If man-made aerial vehicles can adopt these capabilities through improved understanding and engineering of flapping wing flight, we may replace the traditional choices of airplanes and rotorcraft with safer, quieter, and more versatile options.
While nature has had the benefit of millions of years of evolution to achieve designs that respect ecological constraints, man-made vehicles must adopt a different approach. Several recent approaches to flapping wing flight have led to successful vehicle designs based on biomimicry,1,2 as well as through modeling, simulation, and experimental evaluation.3–8 In general, man-made flapping wing aerial vehicles (FWAVs) follow similar performance and sizing trends as their natural counterparts, but are required to function with a reduced degree of complexity in sensing and actuation due to engineering challenges associated with duplicating the nervous and musculo-skeletal systems of animals.
Flapping wing flight, natural or man-made, depends strongly on the design of the wings, including the size, shape, and flapping motions, and also on the design of the propulsion system used to drive the wings. The wings are typically flexible and must deform in response to time-varying loading conditions, leading to unsteady flight conditions that further impact loading. Since the drive system performance varies depending on loading conditions, flapping wing flight poses a challenging design problem with tight subsystem coupling. A successful design must achieve an efficient pairing between the wing and propulsion subsystems such that sufficient power is extracted to lift the vehicle weight, while minimizing energy consumption to improve flight endurance and range.
FWAVs present designers with a large trade space of interactive variables, therefore a purely experimental approach can be a very inefficient strategy for realizing an optimal or even working vehicle design. Alternatively, the flapping wing design problem may be solved with a simulation-based approach. A key challenge in man-made vehicle design is to select an appropriate level of modeling fidelity in generating aerodynamic predictions. High fidelity models have reduced throughput, and physically realizing and engineering designs that match modeled conditions can be quite difficult. Low fidelity models may provide higher throughput, but often generate predictions that are highly variable based on the chosen set of model inputs, which are very difficult to ascertain without some experimental data. In light of these challenges, it is logical to combine an experimental approach with lower fidelity simulation and modeling, which provides both high model throughput and physically realistic model inputs that are verified with testing.
Several researchers have explored flapping wing flight in this manner, and demonstrated interesting capabilities in the course of their research. Researchers at the University of Illinois have designed the biomimetic Bat Bot (B2) following multidisciplinary research focused on flapping mechanism synthesis, wing kinematics, controllability, and aeroelastic modeling.3,9–13 The Bat Bot mimics bat flight as a means to explore cause and effect for varying wing kinematics and stiffness distributions, and has demonstrated untethered flight.
The Delfly family of FWAVs, created at the Technical University of Delft, were developed following a large research effort including motion tracking experiments, aerodynamic model parameter estimation, fluid structure interaction simulations, and wing flexibility simulations. A book on the Delfly covers a wide variety of the research that led to the current family of vehicles, which have demonstrated a variety of untethered flight maneuvers.4,14
Festo’s Bionic Learning Network developed the SmartBird, a biomimetic vehicle inspired by the herring gull. 15 The SmartBird utilizes active wing twisting with motors mounted in the wingtips to provide performance improvements relative to passive wing twisting that relies on loading to deform the wings. The benefits of this approach are explored using a computational fluid dynamics simulation, a two-dimensional Euler code, as well as a carousel-type testing apparatus that measures electromechanical performance. The resulting vehicle demonstrates free flight, but thrust performance has a strong sensitivity to the choice of the wing twist profile chosen.
Researchers at the University of Arizona, the National Academy of Sciences of Ukraine, and the Air Force Research Laboratory have explored several aspects of flapping wing flight using experimental and simulation-based strategies. Force measurements and high speed videography of the deformation of flexible membrane wings combined with computational fluid dynamics simulations support the findings by Festo of the importance of appropriate coordination of plunge and twist motions to maximize force productivity.16,17 Their research includes successful autonomous flights of a FWAV with telemetry acquisition. 18
Recently, the biomimetic Dove FWAV was developed by researchers at the Northwestern Polytechnical University in China, following a broad multi-year development process. 19 The flight of the vehicle was realized following a development effort consisting of several prototypes, wind tunnel experiments, strip theory modeling, and computational fluid dynamics simulations. The scope of research included evaluation of wing flexibility effects, development of avionics and flight control systems, and flapping mechanism design synthesis. This study is indicative of the typical depth and breadth of effort necessary to realize a successful FWAV design.
Based on our prior experience in this aerodynamic regime, we have focused on the design and manufacture of wings for FWAVs on the order of tens to hundreds of grams total mass. 20 We also have developed methods to experimentally characterize wing performance in both a laboratory setting as well as in free flight measurements.21,22 In addition, we have developed an approach to conducting experimental motor characterization20,21 based on a method developed at the US Army Research Laboratory. 23 As a consequence of these research efforts, we have developed the Robo Raven FWAV, 5 which has since become a testbed for additional research in related fields.24–27
Historically, the development of the Robo Raven platform has relied on a significant amount of experimental evaluation to establish feasible conditions for flight. This approach has resulted in a body of data that describes the flight envelope and subsystem parameters that lead to acceptable operation, but is a time-consuming strategy for exploring component interactions due to reliance on a huge number of experimental trials. 28 Furthermore, it provides limited insight into the consequences of significant design changes relating to the key subsystems or overall system sizing. A simulation-based approach may offer an alternative strategy for system design analysis, but only if the simulation is valid. In the course of our flight testing, we observed irregularities between commanded wing kinematics and in-flight kinematics which may introduce modeling inaccuracies. A holistic consideration of the vehicle including all relevant subsystems is required to provide deeper insight into component interactions that impact system performance, a finding which has been confirmed by researchers at the Air Force Research Laboratory with a laboratory test of a flexible flapping wing. 29 Following the collection of experimental data of flying vehicles, a new formulation for simulating wing kinematics that accounts for wing deformations and drive motor limitations was developed that shows an improved match between commanded and modeled wing kinematics. 30
In the present effort, we present an expanded simulation-based approach to designing platforms for flapping wing flight that more explicitly and rigorously considers the ways that interactions between subsystems lead to system-level performance. This is a novel approach because it tracks the evolution of system-level performance over time, rather than providing a single estimation of performance given a static vehicle state. Actual vehicles will suffer from a gradual degradation in functionality associated with changes to the vehicle state during a mission, and by simulating those effects, much more reasonable predictions of the vehicle may be realized. The improved ability to predict these system-level performance properties is directly attributable to the foundational work in developing and linking component models as a basis for the system-level model. By providing a time history of the operational characteristics of the vehicle during each simulation run, a much more detailed depiction of how the vehicle is functioning may be achieved when compared to a typical snapshot of performance that is provided in an aerodynamic code alone. This additional information that allows for exploration of how operational characteristics together with component choices build up to affect vehicle performance and entire mission effectiveness can directly inform the design trade space, leading to the possibility for future design optimization efforts to proceed. There are three main tasks required to accomplish this objective. First, appropriate component models must be selected and experimentally evaluated to provide empirical constants where required and validate the predictions. For each relevant subsystem, the model selection must account for relevant effects and provide a means for connection to other component models. Second, the models must be connected in a way that accounts for important interactions. The primary interacting subsystems are the drive motors, the battery, and the flexible wings. By coupling interactions between each of these subsystems, it is possible to realize enhanced predictive capability. Third, the approach must be demonstrated to show utility in performing system design. The overall simulation framework is applied to the Robo Raven II flight platform to demonstrate component level as well as system level predictive capabilities that are useful in providing design insight and guidance to achieve feasible operational conditions.
The approach presented here is extensible to new designs that have limited or no experimental data available, and can be refined by following a similar approach of component model development and validation, followed by system level validation. This design analysis approach based on an improved understanding of the subsystem interactions should be widely applicable for FWAVs.
System-level simulation methodology for FWAV
We have developed a simulation framework that provides insight into design functionality, with a focus on the key subsystems that dictate vehicle performance: (1) the actuator, (2) the battery, and (3) the wings. To this end, we decompose the flapping wing design problem into key subproblems that are each important to the system-level performance, and are inherently coupled:
propulsion system selection and characterization, wing design and sizing, flapping frequency and amplitude selection, and battery sizing.
Using this decomposition makes the design problem more tractable, and highlights the most important components and subsystems dictating system performance. First, the actuator selection is necessary to constrain the design space, based on knowledge of the desired vehicle performance attributes, comparison to some natural and man-made designs, and some simple motor power and efficiency criteria. This initial selection sets up several important design constraints that may be used to make subsequent design decisions, and since this subsystem will generally be a discrete design, it is a logical starting point to the vehicle design. Following the drive motor selection, an experimental characterization procedure is presented that provides surrogate models for making performance predictions based on the published performance specifications to avoid reliance on experimental characterization of all candidate actuators. Following the initial motor selection, the flapping profile and optimal wing design and sizing need to be determined for the characteristics of the motor. Too large of a wing will require more torque than the motor can produce at a given flapping frequency and amplitude, while too small of a wing will require flapping frequencies and amplitudes with associated angular velocities that are beyond the capabilities of the motor. Furthermore, to generate more torque and angular velocity typically requires a more massive motor drawing more power, which requires more massive power subsystems, which in turn requires the wing to be capable of generating enough lift to carry the mass in-flight for a given flapping profile. This defines part of the tradeoff space for the design problem.
For proper wing design, the ability to make aeroelastic predictions across several design parameters is required to ensure compatibility between the motor choice and the wing and flapping motions. Together, these requirements led to the overall approach to systematic analysis of the design problem shown in Figure 1. Given wing design for FWAVs involves a mass and stiffness distribution, an aeroelastic solver is initialized with a commanded plunge motion and trimmed flight condition. The aeroelastic solver uses a strip theory model to capture aerodynamics, and is modified with several unsteady terms that capture dynamic stall effects, apparent mass effects, and lift coefficient hysteresis effects. The solver provides estimates of forces and torques which are then corrected by a comparison to a drive system model containing two important effects. First, a motor model that contains the available motor bandwidth in terms of torque and speed, and second, a battery model that contains derating effects due to state of charge (SOC) and high discharge rates that propagates into the motor model to update the available bandwidth. This inner loop is computed at each time step until convergence is obtained, then the expected charge depletion is used to update the battery model for the next time step. This procedure continues until the battery is sufficiently depleted to terminate the flight based on the reduction in available motor bandwidth. Using this modeling framework, the subsystems of the Robo Raven II are used to build up system-level performance estimates.

Proposed workflow for systematic analysis of flapping wing aerial vehicle performance analysis.
Actuator model
The motor selection for the drive train is a key initializing factor in analysis of flapping flight, because it places a constraint on the reachable motor bandwidth, defined in equation (1) as the available torque at a given rotational velocity and voltage condition. This model creates an operational space spanning from a free-run condition at no load to a stalled motor condition at peak torque, across all feasible battery voltage levels. The motor model has been chosen following its usage in several efforts that have experimentally demonstrated a very accurate representation of actual performance.21,30–32 By leveraging this equation, it is possible to determine at each time step in the simulation if the loads arising from the desired kinematics are feasible with respect to the actuator capabilities. In general, if experimental data has not yet been collected, such as in a preliminary design effort, it may be reasonable to approximate motor performance using manufacturer published data for maximum torque and maximum rotational velocity at reference voltages, typically 5.0 V and 7.4 V for a high voltage servo. However, detailed mission analysis spanning a battery discharge cycle ultimately requires motor characterization to fully understand the impact of variable battery voltage, as well as to verify that actual performance is modeled with sufficient accuracy. Several candidate motors that were considered for usage in the original Robo Raven design were discarded following experimental characterization, which revealed that published performance is frequently less than actual performance
5

For the present effort we use the Futaba S9352HV servo as the drive motor due to its combination of high power output, compact packaging, and programmable motions, as explored in prior work. 5 This servo consists of a brushless motor with a built in gear drive and velocity controller that is regulated by position error feedback. The motor bandwidth plotted in Figure 2 was determined using an experimental performance analysis technique developed by researchers at Army Research Laboratory that simultaneously measures torque, angular velocity, voltage, and current during dynamometer testing.20,31
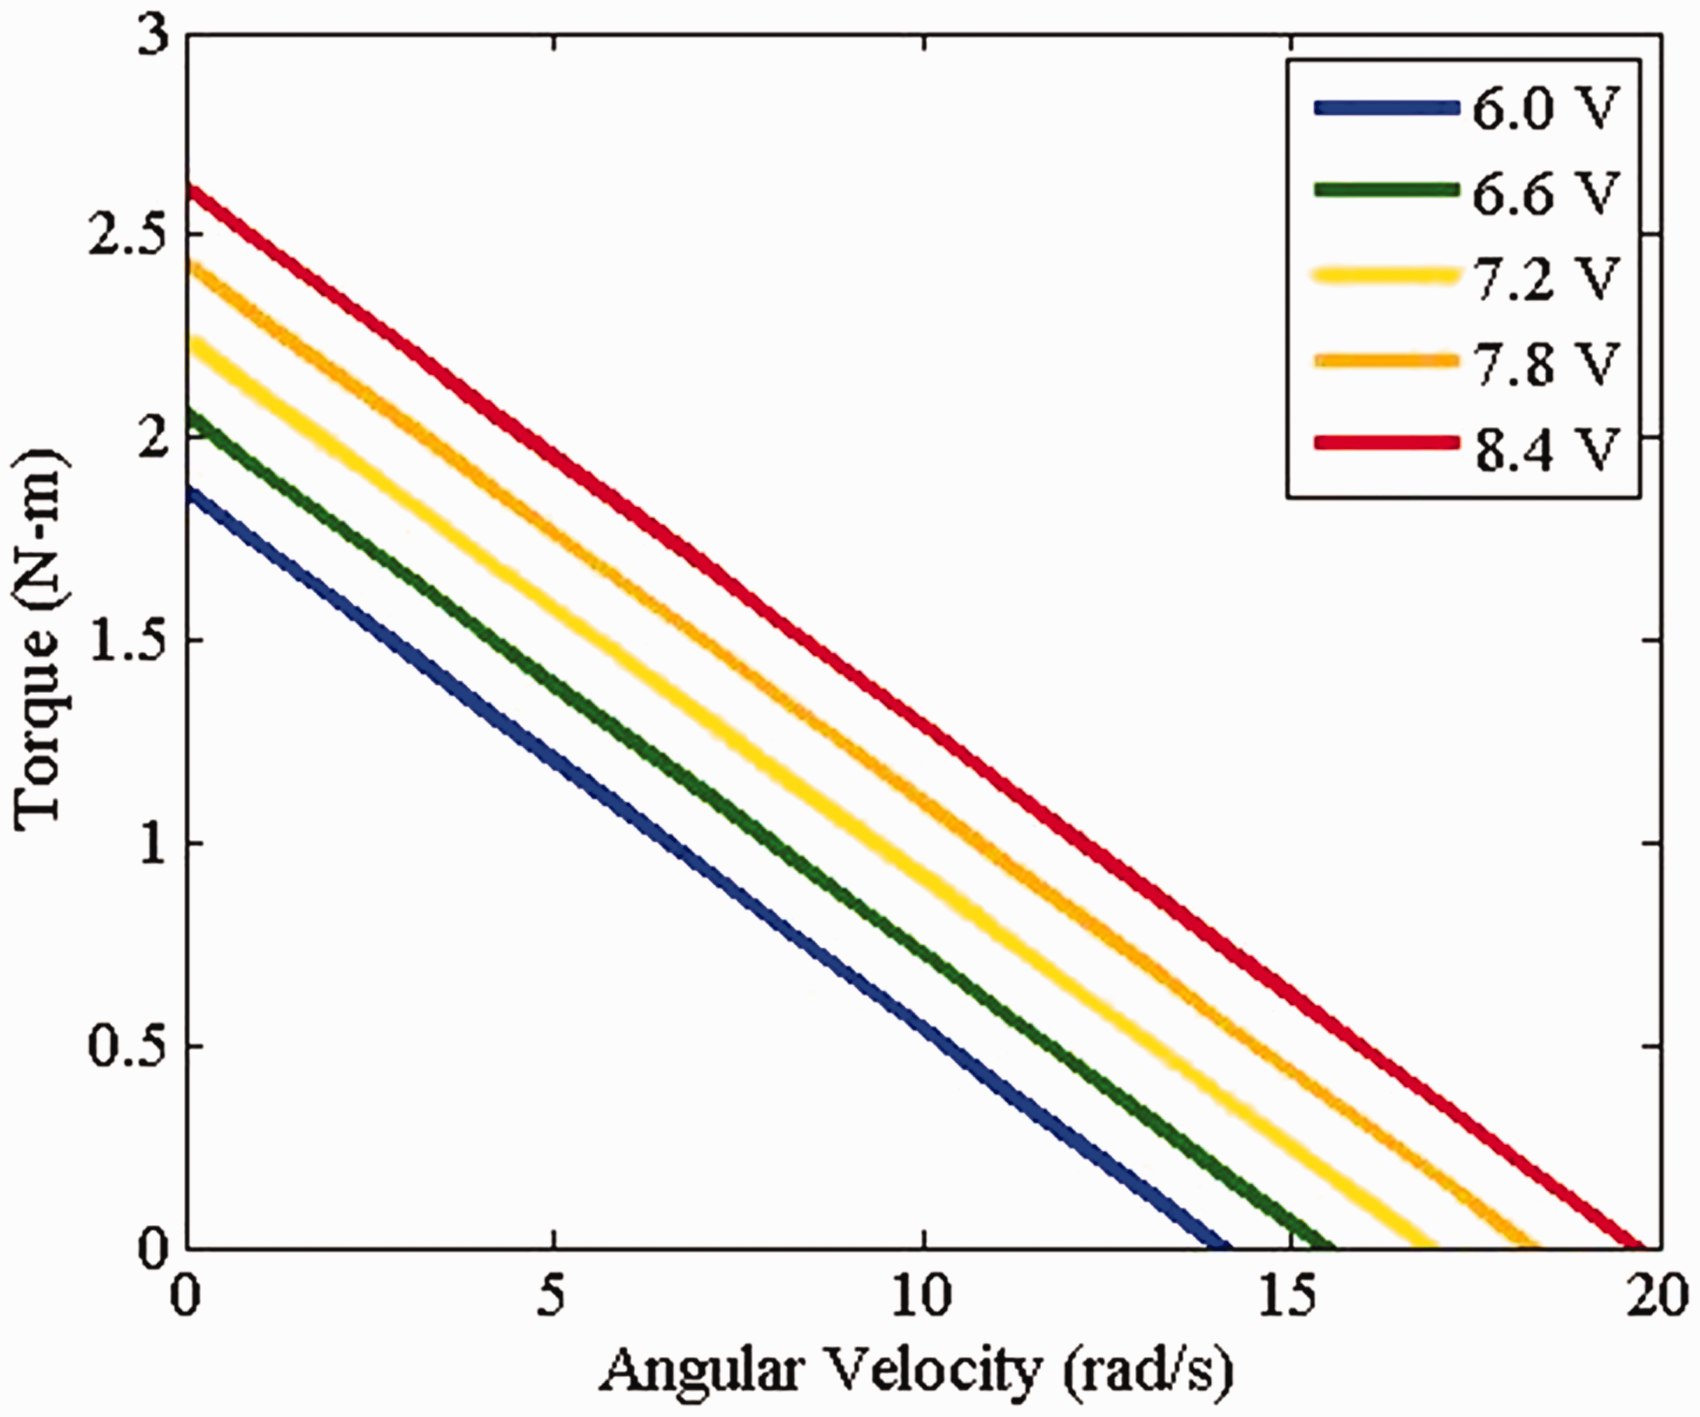
Torque–speed bandwidth for Futaba S9352HV servo.
The steady-state output power and efficiency computed as follows


Equations (2) to (4) are plotted in Figure 3 across a range of voltages that would be typical for a full discharge cycle of a two-cell lithium polymer battery. This plot shows two important results for the overall system design. First, the power output is significantly reduced in the course of a discharge cycle, which will have important implications in determination of system-level performance metrics. Second, the ideal operational range for the motors shifts with voltage, making the selection of an appropriate wing somewhat more challenging. The ideal speed for power production starts at 12.9 rad/s and ends at 6.6 rad/s. Similarly the ideal efficiency speed starts at 16.5 rad/s and ends at 12.1 rad/s. This plot is a valuable snapshot of the performance of the drive subsystem, and provides detailed information about how system functionality may be expected to degrade in a practical usage scenario. This is a necessary improvement for more a more accurate system-level analysis, and shows a much broader range of operational conditions than simpler models we have used in prior work that only capture the performance of the drive motor at a nominal voltage level. 20

Power output (solid) and efficiency (dashed) for Futaba S9352HV servo.
In prior work, a steady-state torque output model was developed that relies on current input. 22 This approach provides very accurate predictions in constant testing, but does not account for significant losses that arise due to the inertia and friction of the geartrain. These dynamic loads can place significant power demands on the motors, therefore, a dynamic model that accounts for losses associated with acceleration of the motor is required.
In order to characterize the dynamic power losses, a frequency sweep from 1 to 4 Hz is performed while recording voltage, current, and wing plunge angle via an optical encoder at the wing root. The recorded encoder signal is twice differentiated and low pass filtered using a Savitzky–Golay smoothing filter to reduce signal quantization noise.
33
The resulting acceleration magnitude signal is plotted together with the encoder signal measured during the test in Figure 4. The measured electrical power resulting from actuator acceleration is plotted in Figure 5 together with the second-order fit from the following equation that captures the power losses arising from geartrain acceleration

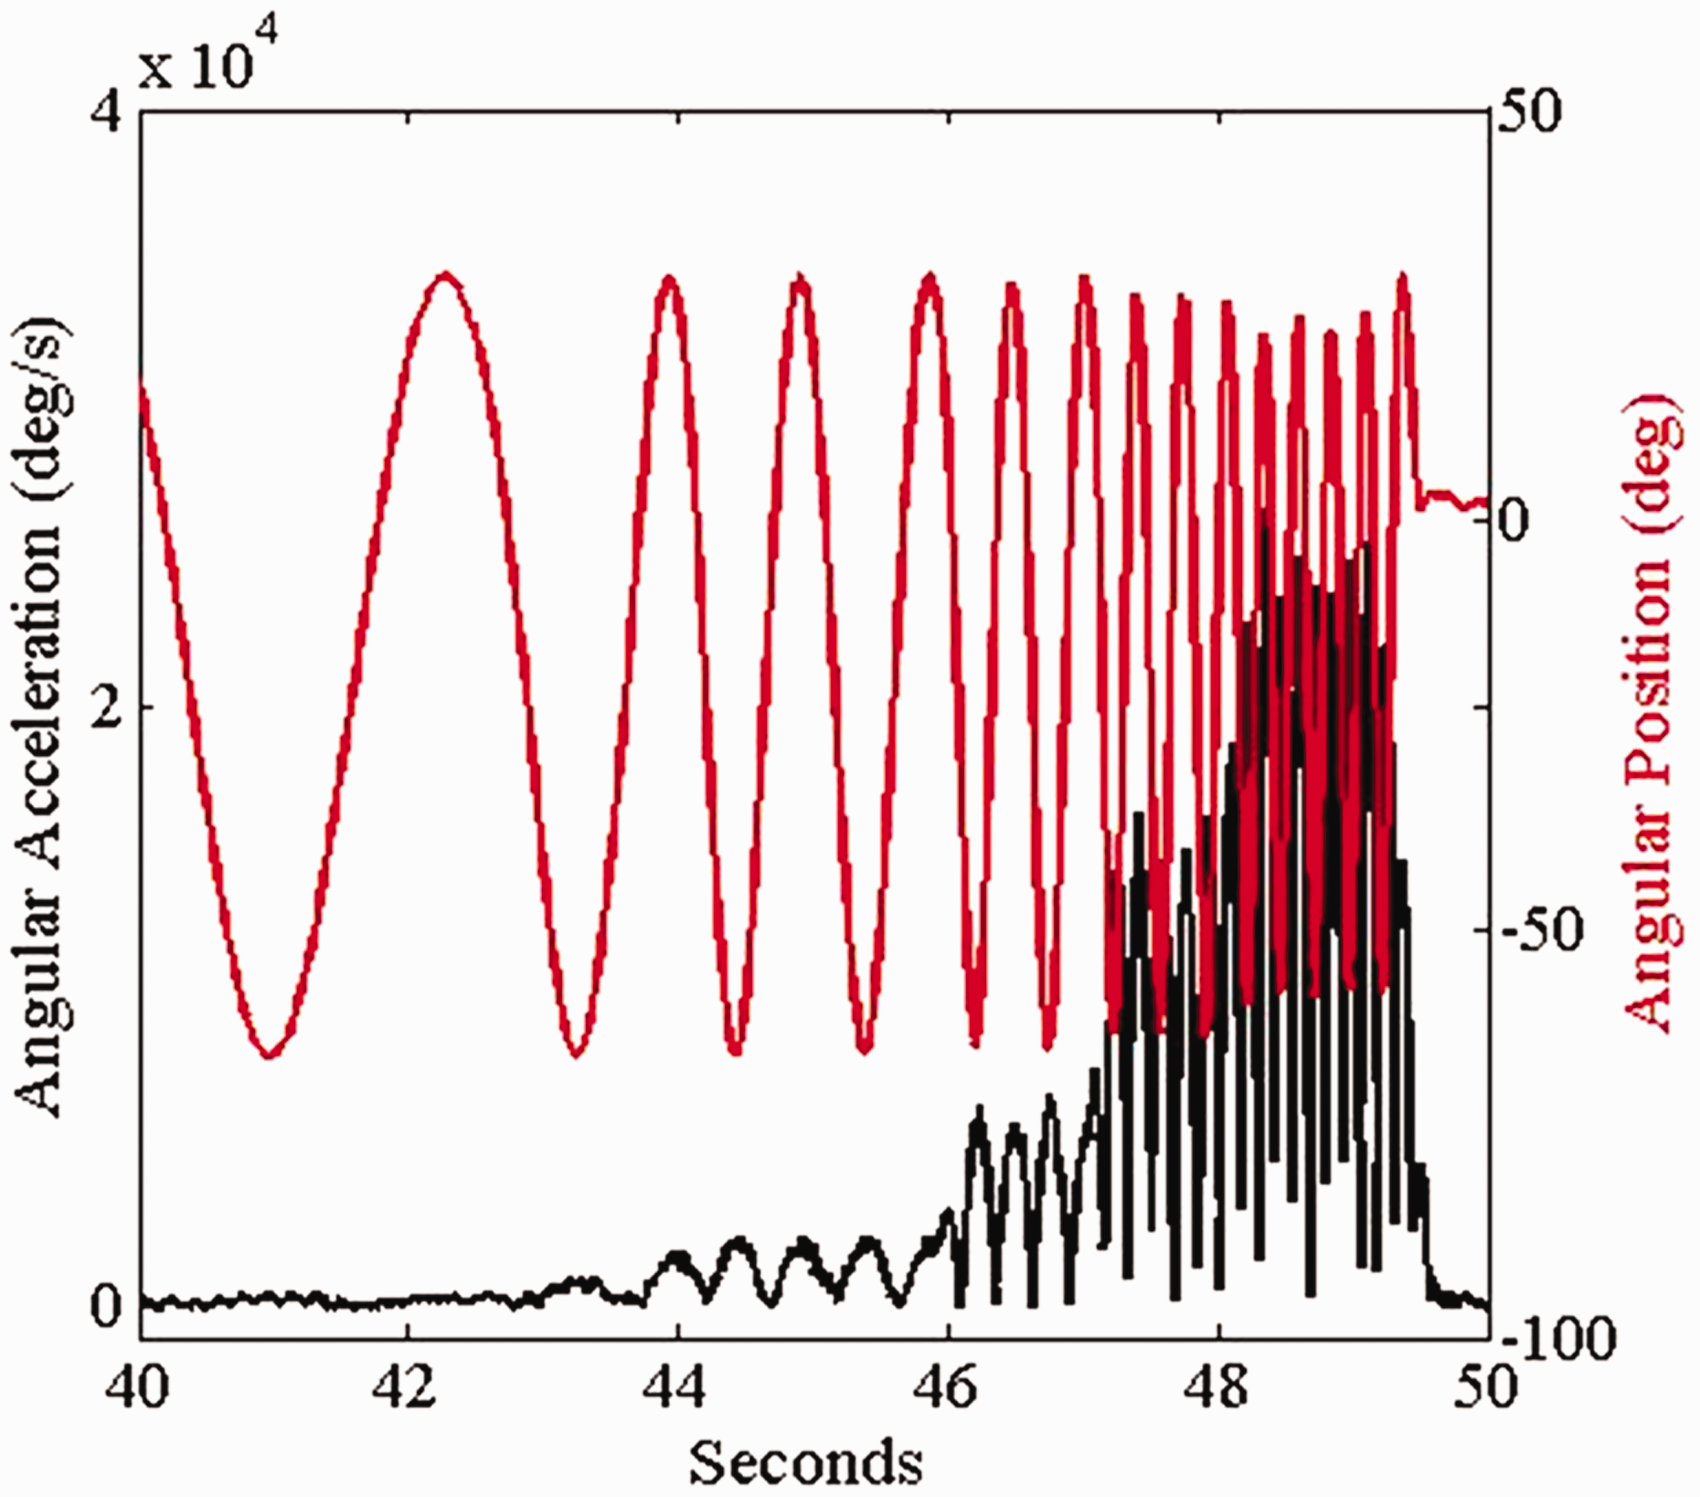
Frequency sweep test data used to estimate geartrain losses.

Power requirements for unloaded acceleration of servo geartrain.
Battery model
A central piece in a comprehensive system model of flapping wing flight is the lithium polymer battery used to provide power. Typically, it is desirable to select a battery that offers maximum system endurance while meeting other constraints. As shown in Figure 2, a significant shift in the available motor bandwidth is experienced during the discharge cycle. Therefore, a real-world mission termination is more likely to be attributed to lost motor bandwidth at some intermediate SOC, rather than full battery discharge. In order to accurately estimate how battery selection impacts system performance, we adopt an experimentally validated battery model that captures all relevant features of battery health, environment, and usage conditions, including run time, multiple time-scale current-voltage characteristics, and derating effects related to rapid discharge.
34
The approach relies on some experimental characterization to set appropriate values for empirical constants, which is necessary due to variation between battery chemistries, manufacturers, and other conditions that cannot be ignored while retaining sufficient accuracy in predictions. This model uses a nonlinear relationship to provide a mapping from SOC to open-circuit voltage, as follows

The SOC value is updated throughout the simulation process using the Coulomb counting approach, which is a simple integration of the time history of the current, as follows

We then model the current-voltage behavior during discharge of the battery which generalizes the framework presented in Chen and Rincón-Mora
34
to allow for variable battery capacity, as follows

This model captures the discharge associated with slow timescale effects with the first term that denotes open-circuit voltage. The fast timescale effects are described by the convolution of a nonlinear discharge-rate term and a battery plant model with exponential decay. The parameters K1 and K2 are tuned to capture current-dependent derating in usable capacity, as well as the time-dependent voltage changes associated with rapidly changing current. These effects are important due to the application studied here, which contains both high discharge rates and rapidly changing cyclic loading conditions. Model tuning is necessary to ensure the model is properly capturing the particular make and model of batteries chosen for our application. This procedure is completed by generating a data set that captures a complete discharge process using the test stand shown in Figure 6.

Test stand used to conduct stationary flapping experiments.
A two-cell lithium polymer battery pack with 370 mAh capacity is used in a stationary flapping test and the recorded current draw during this test is then used as an input into the battery model in equation (8). The model parameters are then identified to provide a close fit to the data, with the result shown in Figure 7. Details of the experimental apparatus used for this procedure are presented in prior work. 21

Comparison of battery model to experimental data.
Aeroelastic model for flapping wings
The forces produced by flapping wings during flight depend primarily on the interaction between commanded flapping motions, power system bandwidth, and wing flexibility. Therefore, an aeroelastic model of the wing is required that couples to the battery and actuator models to ensure the forces acting on the wings balance the torque generated by the drive motor at the corresponding angular velocity. A previous effort in modeling the effects of motor and wing interactions highlighted the importance of accounting for their coupling to ensure the commanded wing motions are realistic. 30
The aerodynamic modeling approach is primarily adopted from the classic strip theory method, adapted to flapping wing flight, as detailed in DeLaurier. 35 This modeling approach is widely used in flapping wing flight owing to its simplicity, ability to account for varying trim conditions, computational efficiency, and basic ability to account for unsteady aerodynamics, as would be expected due to cyclic wing heaving motions and rotations. Several key modifications have been made to improve the predictions by enforcing drive system compatibility, 30 while also adding more sophisticated unsteady aerodynamic predictions and a structural solver to compute elastic wing deformations in the loop using a boundary value problem solver, as detailed in Shampine et al. 36 These modifications are included to account for discrepancies between stiff and flexible wings as well as ideal and actual wing motions, and have been validated in a FWAV of similar scale and flight conditions. 9
The aerodynamic forces are calculated at each time step by solving for the normal and tangential forces as a function of the wing motions and deformations. The wings exhibit large deformations and extreme angles of attack during flight, therefore a lift model is required that can account for flow separation and post-stall behavior. The model presented in Goman and Khrabrov
37
and implemented for flapping wing flight in Paranjape et al.
12
offers one solution. In this approach, the coefficient of lift is calculated as


The sectionwise normal force and moment are then computed as


The terms that depend on the location of the aerodynamic center

This equation describes the movement of the flow separation position
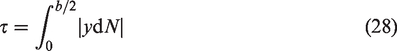
Chordwise forces need to be calculated next. First, the leading edge suction force is computed as

The chordwise drag induced by the flow’s circulation around a cambered wing is computed as

Viscous chordwise drag is computed as

Drag due to the tail is computed as an inclined flat plate, with the tail inclined relative to the fuselage

Total force in the chordwise direction is computed as

Lift and thrust forces are calculated by resolving the normal and chordwise forces using the local angle of attack as


The total lift and thrust forces are then calculated by integrating along the semispan at each instant, using flapping frequency normalized time units, as follows


In order to calculate the structural deformations of the wings during each flapping cycle, the forces and moments are coupled to bending and twisting equations of motion, as defined in Paranjape et al.
12

In equation (24), the normal force and local pitching moment are equated to a mass matrix multiplied by the accelerations plus a Kelvin–Voigt damping contribution controlled by the parameter
The wing motions are initially defined using a sinusoidal flapping profile as


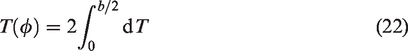
The structural deformations are then solved in the loop and used to modify the computed forces until convergence is achieved at each time step. The torque at each flapping cycle step
At each cycle step, if the torque and plunge velocity

The consequence of this formulation is to reduce flapping amplitude in response to increasing demands on the motors, as the commanded motions would result in infeasible loading conditions. Due to the usage of velocity-controlled servos utilizing position error feedback to drive the wings, this approach is consistent with our experimental observations. It is worth mentioning that our particular formulation for making kinematic corrections is somewhat unusual, and will likely require modification for application by a typical flapping wing researcher who typically favor the much more efficient crank-rocker mechanism layout.
38
For a crank-rocker mechanism, infeasible loading conditions must be corrected with a reduction in the flapping phase step size
Throughout the simulation, it is necessary to enforce physically realistic flight conditions to ensure that the results remain reasonable. Especially in cases where little or no experimental data exists to tune the model parameters, this is a crucial check on the simulation. One means of performing this check is with the Strouhal number, defined as

The Strouhal number describes the interaction of the vortices on the wings arising due to the relative magnitudes of forward and vertical wing velocities, and must remain within a narrow range of values to ensure efficient flight conditions. Here, we have selected bounds of 0.3 to 0.4, chosen through an understanding of how the code functions. The upper limit on Strouhal number of 0.4 is selected because that is an approximate limitation on efficient operational conditions, as identified by biologists studying many species of flying and swimming animals.39–41 Furthermore, in prior experimental trials with the Robo Raven, measurements have shown that typical cruising flights take place near a Strouhal number of 0.395. Flights in this regime are characterized by a large angle of attack, low velocity cruising flight with a high degree of stability and a tendency to self-level. At the lower end of the chosen subset of Strouhal numbers, some judgment was necessary to establish a reasonable bound since the same biological studies have shown animals that exhibit Strouhal numbers below 0.2. The trend in the simulation data indicated a sharp increase in predicted lift with lower Strouhal numbers, which is characterized by higher speed cruising, greater susceptibility to disturbances, and smaller flapping motions by stiffer wings. This style of flight will generally present greater demands on the pilot or flight controller to make course corrections, and require significantly more control authority and precision to sustain straight and level flight. In our previous experimental trials, we have found that attempts to push toward this operational regime result in very unstable flights that cannot be sustained given the current design. This is likely due to the combination of extremely light weight, large wing and tail surface area, and single degree of freedom wings, which together necessitate a self-stabilizing design at lower speeds.
Simulation results for Robo Raven II
The typical objective in wing sizing is to maximize lift, endurance, or find a favorable compromise between those two optima. Incorrect wing sizing results in a poor compatibility between the motor power band and the force productivity of the wings, and significantly diminishes vehicle performance. To explore this relationship, we focus on four wings of increasing size, labeled A through D, as listed in Table 1. A constructed wing is shown in Figure 8. The details and construction of these four wing designs have been experimentally studied in detail in prior work, and are known to cover the feasible operational space of Robo Raven II given the current motor selection.21,32

Compliant wing used in Robo Raven II flapping wing aerial vehicle.
Wing design parameters.

The simulation framework is first used to perform battery sizing effects and generate initial estimates of performance for each of the four wing designs under consideration. Battery sizing is required to avoid two potential issues with the system design. First, in the case of a battery that is too small, motor current demands will drop voltage so far that flight becomes infeasible, despite the weight savings. Second, in the case of a battery that is too large, motor current will no longer induce significant voltage drops, however excessive mass will prevent flight. Making an appropriate selection for battery size is challenging because the battery performance, and therefore motor performance, depends on the SOC, which is constantly decreasing during a flight. Therefore, the sizing decision must be made to provide maximum vehicle system-level performance through a favorable choice of subsystem interactions. To explore these interactions, the simulation framework is used to generate a design trade space across battery capacities ranging from 400 to 1800 mAh, in steps of 100 mAh. In each simulation, flight conditions are calculated over a full battery discharge cycle. This approach provides a realistic estimate of vehicle performance, rather than a simplified calculation based on the quotient of battery capacity and a snapshot of power consumption. Trim conditions that provide maximum lift production are calculated at each time step in the simulation, while also enforcing feasible bounds on both the Strouhal Number and the torque and plunge rate demanded by the drive motors.
The net lift predictions for wing A are plotted in Figure 9, calculated using the vehicle weight including the modeled battery capacity. No feasible solutions for a flying vehicle were found for this wing size, due to excessive motor bandwidth losses at the low end of evaluated battery capacities, and excessive weight with larger battery capacities. Some regions of the data that remain unchanging for significant portions of time are limited by simulation constraints on acceptable Strouhal Numbers, which enforce physically realistic flight conditions, despite the mathematics underlying the simulation suggesting that greater performance may be obtained. Wing A shows a monotonic decrease in lift production with larger battery capacity, indicating that the added mass of the battery is dominating the performance predictions.

Wing A simulation results.
The lift predictions for wing B are plotted in Figure 10. This wing design is larger and presents greater loads to the drive motors, resulting in a voltage drop on the battery that alters the available torque and plunge rate more significantly. In this plot, a tradeoff emerges between battery capacity and net lift production, as a result of the balance between the competing effects of voltage sag on small capacity batteries and added mass of large capacity batteries. Maximum instantaneous net lift of 0.32 N is obtained with a 1.3 A-h capacity, and maximum endurance of 777.3 s is obtained by a 1.4 A-h capacity.

Wing B simulation results.
Results for wing C are plotted in Figure 11. Performance predictions for wing C are similar to wing B, but with a degradation in maximum lift production and endurance. This indicates a design which is optimal exists between wings A and C with respect to both lift production and endurance. For this wing design, maximum instantaneous net lift performance of 0.15 N is obtained with a 1.0 A-h capacity, while maximum endurance of 280.3 s is obtained with a 1.3 A-h capacity.

Wing C simulation results.
The results for wing D are plotted in Figure 12. The significantly larger surface area for this wing design presents excessive loading conditions to the motors, resulting in reductions in flapping amplitude, reduced thrust, and ultimately, reduced lift production. Due to the larger loading profiles of these wings, the heavier higher capacity batteries simulated present less of a penalty for added mass due to a reduction in voltage sag as compared to the smaller wings shown previously.

Wing D simulation results.
In previous work, we devoted a significant effort to experimentally characterizing the vehicle in laboratory and free flight scenarios, including lift measurement.5,20–22,30,32 Lift determination through flight testing relied on operator experience to set the trim during each trial in order to maximize lift production. For the Robo Raven, this is accomplished through variation in the tail angle of attack and movement of the center of gravity, which affects the airspeed, resulting in changes to the flight power, as discussed in Gerdes et al. 28 Unfortunately, subtle changes to the center of gravity and tail angle result in significant effects in flight power. Meanwhile, variable weather conditions further complicate this process by making it difficult to differentiate between effects associated with vehicle trim and effects associated with wind gusts. Here, we have provided a simulation-based approach to wing and battery sizing. Next, we want to determine how best to trim the vehicle, without conducting a huge number of flight tests, such that it is operating at the most efficient airspeed in terms of power consumption.
By simulating a Robo Raven with the same characteristics that were used in the battery discharge trials previously conducted, we can observe where there are opportunities to increase performance through minor adjustments to vehicle trim. The simulation is initialized with the same battery, motors, and wing C design used during the experimental trial shown in Table 1. The simulation is then run across a range of aerodynamically efficient Strouhal numbers, following the definition in equation (30). The results for lift production are plotted in Figure 13, and the simulated Robo Raven with wing C has a baseline weight of 2.65 N, which includes all flight systems with no added mass. The gap in the data corresponding to Strouhal number of 0.320 appears because the code becomes unstable as it is no longer able to converge on feasible solutions due to limited motor power, hence this represents the highest lift production possible. This estimate offers close agreement with the experimentally determined value of 3.39 N (346 g-force), but also indicates that it may have been possible to achieve a slightly higher maximum payload with a faster vehicle trim. Wing C was chosen for this plot because it demonstrated the highest lift production during experimental flight testing.
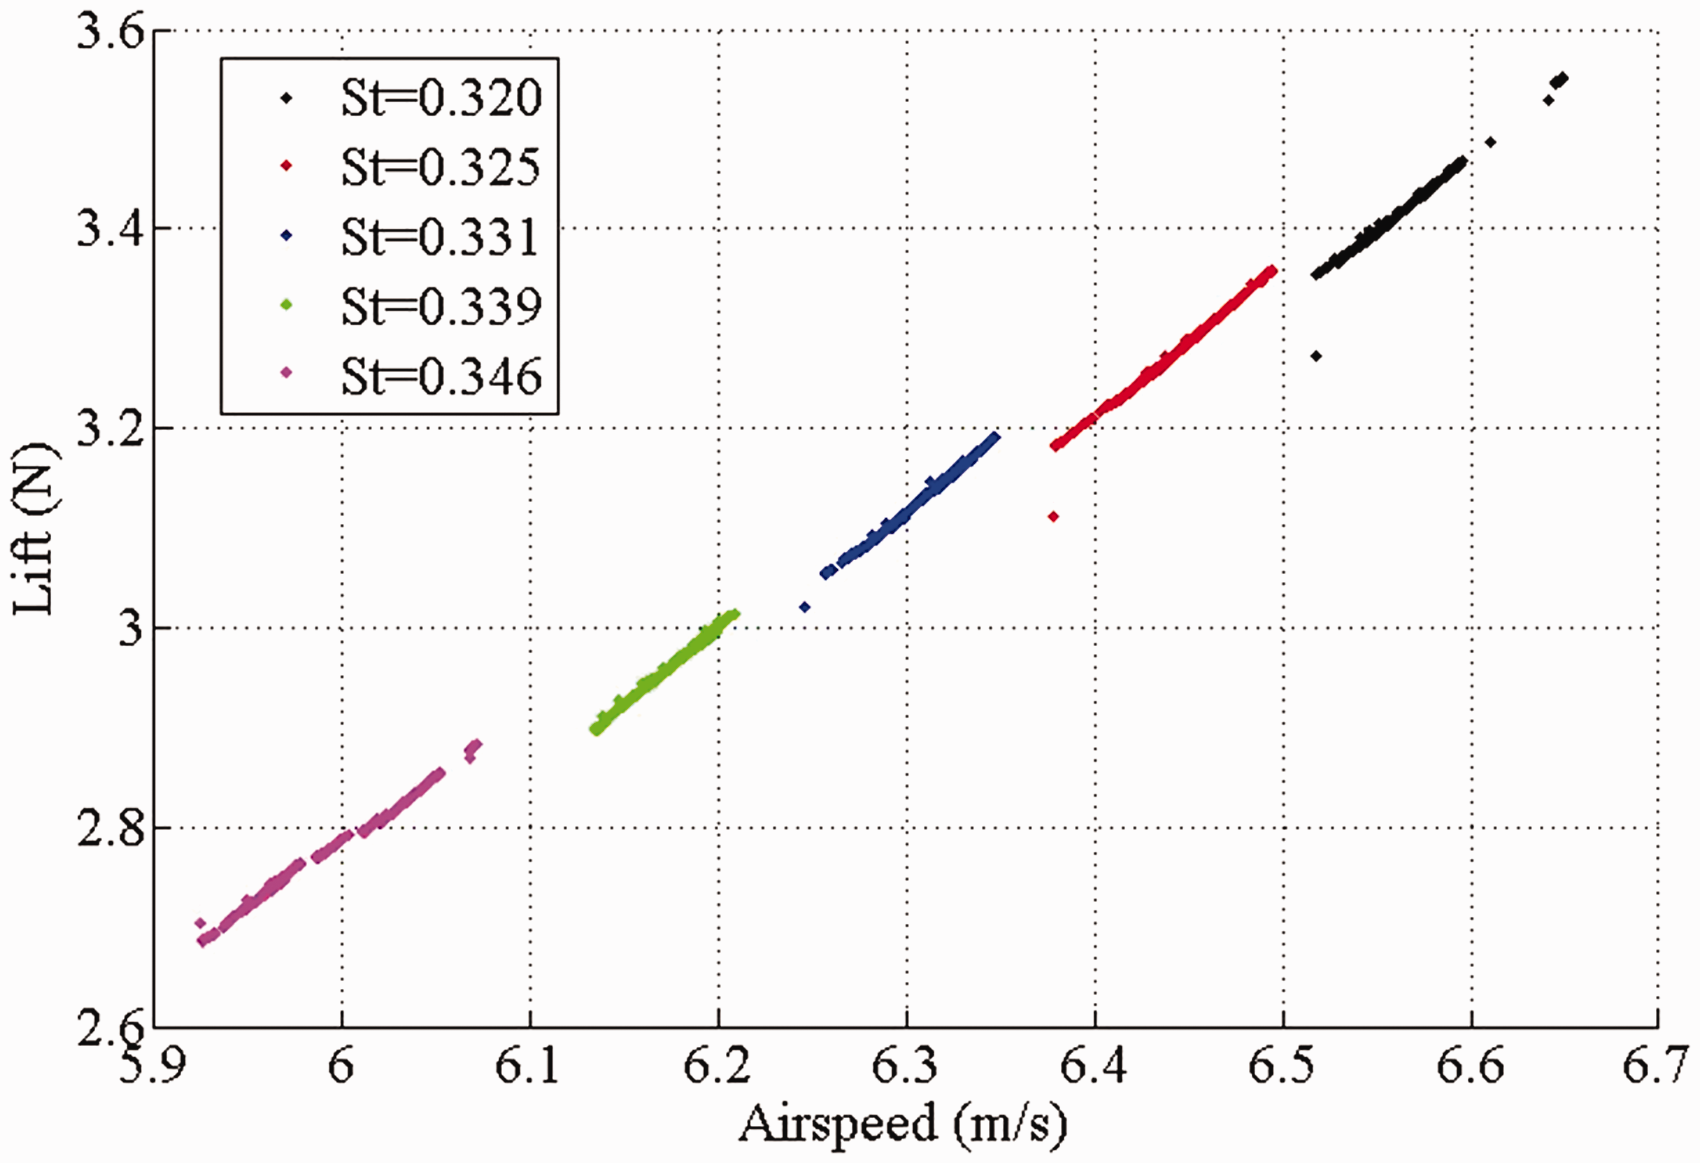
Simulated effect of changing trim conditions on lift productivity for wing C.
It is important to note that with the deformability of the wings, the actual amplitude in degrees changes with frequency as the torque exceeds the motor limitation. So, it ends up declining almost linearly at flapping frequencies of 2 Hz for the given flapping amplitudes we employ for Robo Raven. 20 The resulting thrust will also change slightly, varying more linearly than quadratically with flapping frequency. So, the end result may be that the change in flight velocity may match with the change in Af, so that the Strouhal number does not change as much with frequency. This effect can be very important, since a deformable wing combined with the torque limitation of the motor means that it is possible to maintain a Strouhal number that stays in the 0.2 to 0.4 range as you increase the frequency. A rigid wing would simply increase the Strouhal number linearly with velocity, so if there is not enough thrust generation as the flapping frequency increases to maintain forward velocity, the Strouhal number can exceed 0.4 and result in a loss in efficiency.
Using model approximations for the thrust force generation with flapping frequency and amplitude for steady state flight, the Strouhal number can be approximated for the flapping profile of Robo Raven, where the flapping amplitudes never exceeds 50°, as follows

Discussion of simulation results
The values for wing properties used in equation (24) must be properly selected to ensure the simulation generates realistic deformations in response to loading conditions. The sensitivity of deformations to the sectional modulus is explored in Figure 14, which shows bending deformation of the front spar in the plunge axis, normalized by span length such that a value of zero corresponds to the wing root and a value of one corresponds to the wingtip. Two surface plots are overlaid in this figure showing results from the structural boundary value problem solver for the bending deformation of wing C, at a Strouhal Number of 0.32 and a fully charged battery. The plot with smaller deformation uses a value for sectional modulus derived from the material properties and dimensions of the carbon fiber stiffeners used in the wing construction. 42 The plot with the larger deformation is simulated with an order of magnitude decrease in section modulus. Each simulation is run with a wing tension of 0.1 N.

Wing C structural solver results for span-normalized bending deformation across one flapping cycle, variable Z indicates wing section modulus.

Time to discharge to 3.0 V/cell for wing B across battery capacities.
In these simulations, there is little change to the character of the deformations, with only a reduction in the degree of deformations. However, the sensitivity of the lift predictions to changes in deformation is important. The reduced wing stiffness settings yield a predicted lift of 3.36 N, while the increased stiffness settings result in a predicted lift of 3.23 N.
Given the relative insensitivity of the lift force prediction to a substantial change in the wing stiffness properties, it is likely not necessary to set up a full aeroelastic solution to generate useful results. Rather, the prescribed deformation approach 35 or a highly simplified aeroelastic approach 30 is typically sufficient for the purposes of generating useful design insight, given that the wings have structural modes that are sufficiently separated from flapping frequencies, which would typically be the case in practical wing designs. In addition, these simplified approaches avoid the complexity associated with measurement of wing stiffness, which is often non-trivial, and instead rely on direct observation of deformation magnitudes to tune the simulation parameters. 32
In contrast, the battery model appears to be an important aspect of a system-level performance prediction, given that the force production of the wings is strongly related to the flapping motions, which depend greatly on available motor bandwidth. Wing B performed best in the simulation, with results shown in Figure 10 in terms of time to discharge the battery to the threshold of usefulness, taken as 3.0 V per cell, shows the initial tradeoff that must be considered when making a capacity selection. For lift maximization, the best strategy is to select a battery capacity that coincides with the edge of the linear portion of the curve, corresponding to the smallest possible battery that can support the discharge rate required to power the motors for cruising flight. Below this limit, rapid losses in performance occur due to capacity derating effects which offset the benefits of weight savings.
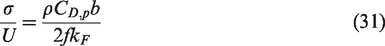
The simulation provides predictions for designing a vehicle to achieve maximum performance. Given the motor parameters are the input to initialize the simulation, the wing B design demonstrates the highest lift production, as plotted in Figure 10. The simulation settings that resulted in the maximum lift production are summarized in Table 2, and serve as recommended initial conditions for design optimization, where the goal is defined as lift maximization. These values serve as the targets for flight at the start of the flight, and will evolve throughout the battery discharge process as system conditions change.
Recommended initial conditions for Robo Raven II lift maximization.
Similarly, by reconfiguring the simulation to seek lift production that exactly equals vehicle weight rather than seeking maximum lift, as was plotted previously, an additional result may be obtained for endurance maximization. The time to battery discharge is plotted in Figure 15. In addition, the predicted endurance estimates across all simulated battery sizes are plotted in Figure 16. The difference between battery discharge time and flight endurance indicates the importance of calculating feasible flight conditions with a system-level simulation. The data contains some numerical noise associated with the vehicle trim convergence, however the trend clearly indicates that moderate battery capacities will provide maximum performance by balancing excessive discharge rates with excessive battery mass.

Wing B endurance estimates across battery capacities.
Validation of system-level simulation
In the previous sections, we have introduced subsystem models for the actuator, the battery, and the flexible wings that are coupled to produce system-level prediction performance for FWAVs. In order to ensure the predictions are reasonable, we conducted some experimental validation of each subsystem model prior for inclusion in the system-level framework. The motor model has been both developed and validated following extensive dynamometer testing of the drive motors. The battery model was initially developed by considering all relevant conditions that impact performance, but only a subset of the most relevant conditions was retained for performance predictions, while battery health and environmental temperature were neglected. These effects were subsequently validated using experimental testing to ensure the model parameters were correctly capturing discharge behavior for the range of batteries considered here. Finally, the aeroelastic model was validated by integrating it with the other two subsystem models to perform a system-level simulation. The aeroelastic model validation for the presented simulation framework is focused on two primary predictions. First, the flapping bandwidth arising from the motor model and current battery conditions, and second, the impact of changing Strouhal Number on flight performance. Together, these two predictions capture the performance of the drive subsystem and the system-level flight performance that arises from variations in the vehicle parameters.
The Robo Raven II FWAV is equipped with a custom flight data sensor suite shown in Figure 17 capable of recording critical modeling parameters in-flight. In-flight measurements include battery voltage and current consumption, vehicle attitude and heading, altitude, airspeed, and wing plunge angle. Details about the design and development of the printed circuit board are available in previous work.22,30

Flight data recorder installed on Robo Raven II.
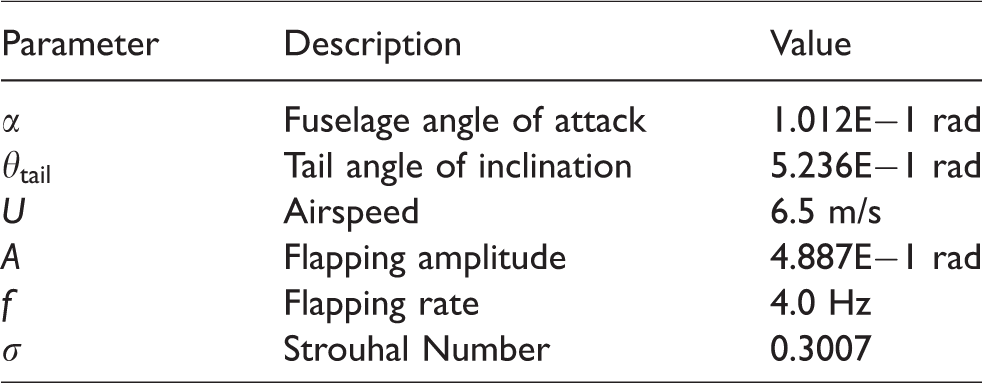
Several flight tests are conducted with the goal of maintaining steady conditions in attitude, heading, and climb rate in order to provide a data set for model validation. The Robo Raven II is shown during one test trial in Figure 18. Following each trial, the data is post-processed to isolate stable cruising flight data. In addition, any test data containing significant turning, weather-induced deflections, or other deviations from stable flight are removed from the trial data.
Robo Raven II in flight during data collection trials.
The flapping bandwidth from a test flight with wing C flapping at 4.0 Hz, 0.35 rad angle of attack, and 5 m/s airspeed is plotted together with simulated flapping of the same conditions in Figure 19. The predicted flapping amplitude is very similar, with slight variation in plunge rate during the downstroke arising due to the tuning of the structural model. A simplified approach to further reducing the variation between simulation and experiment is presented in prior work, but for the present study this is considered sufficiently accurate to validate the modeled wing plunge predictions. 30
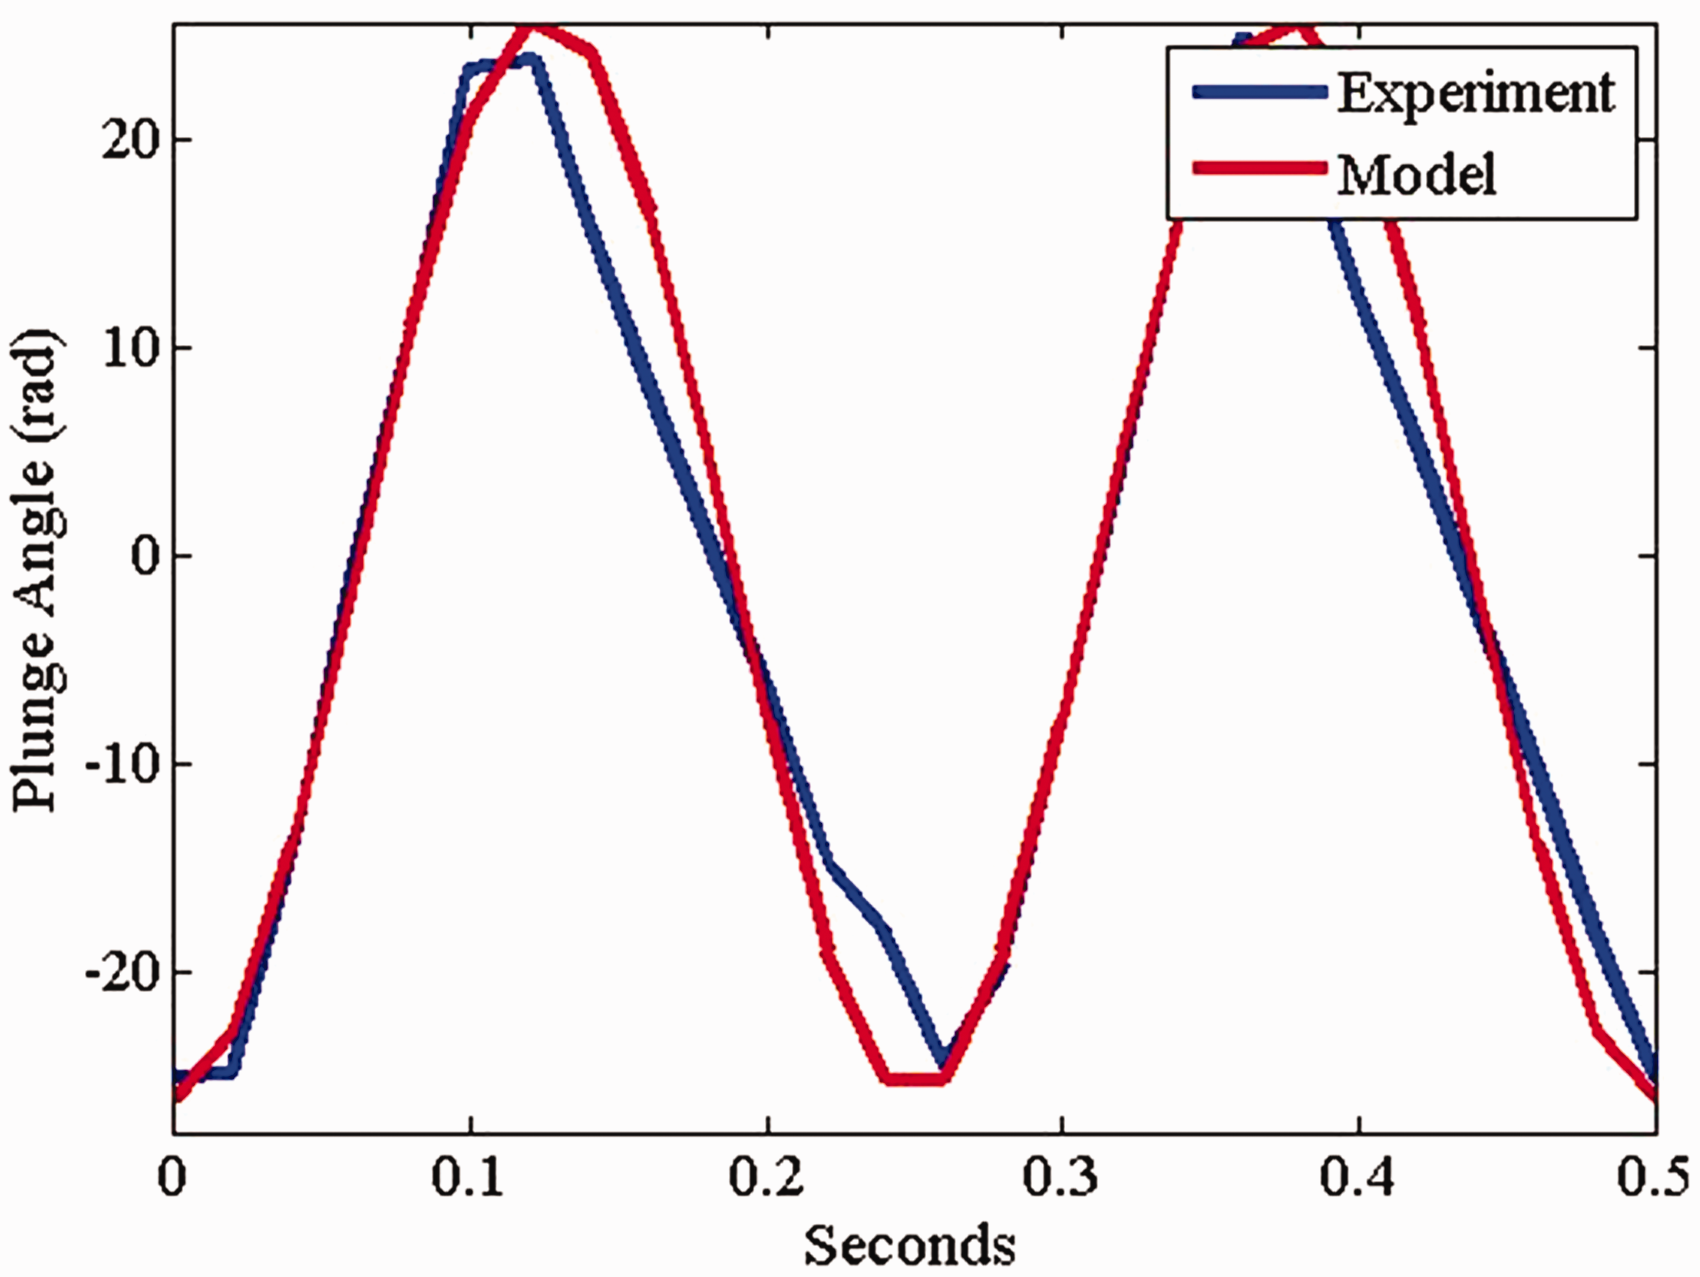
Experimental validation of plunge motions.
An important model prediction is the lift production as flight conditions are varied. Since the on-board sensors are not capable of directly measuring lift production, a model is required that estimates lift force based on climb rate measurements and vehicle mass. For this purpose, we adapt a model developed in prior work
43

The results of flight test trials are listed in Table 3, collected using the experimental approach presented in Gerdes et al. 22 For each trial, the results have been averaged to reduce the effects of variation in vehicle trim. Experiments were not able to reproduce the theoretical maximum that is projected in Figure 10, which amounts to 3.922 N when including the contribution of vehicle weight, which is likely due to the need to make control corrections, weather variations, and a very narrow trim and battery charge envelope that provides peak performance. However, in each experimental trial, the overall vehicle weight including batteries, wings, and sensors was 3.679 N, therefore the predictions for average lift are extremely close to observed values during testing. The proximity of the predicted and experimentally observed values is considered sufficient to validate the modeled lift production.
Experimental flight test results.

To experimentally test the endurance predictions made in Figure 10, a bench test of a Robo Raven II was used while continuously applying dry ice to the motor housing for cooling. This approach is necessary to avoid motor damage associated with extended full power flights. In this experiment, an 850 mAh lipo was used, which required 884 s to be discharged to a failure condition of below 3.0 V/cell. This value compares very well with the simulated lift in Figure 10 which sharply drops off between 858 and 933 s, for simulated lipo capacities of 800 and 900 mAh, respectively. The accuracy of this prediction is considered sufficient to validate the modeled endurance estimates, however caution must be taken by system designers to consider external factors like motor overheating that have not been considered in the present framework.
Conclusions
We have developed a system-level simulation capability for FWAVs that relies on a buildup of coupled models for the following subsystems: (1) the actuator, (2) the battery, and (3) the wings. For reference, the model variables are listed in Appendix 1, and the model parameters and chosen values are listed in Appendix 2. We first established component models that included the necessary effects for each subsystem, and then identified the appropriate linkages to couple these models. Next, we validated the subsystem models experimentally to ensure appropriate empirical constants, as well as correct model formulation. Finally, the overall system simulation was validated using the Robo Raven II flight platform with a custom flight data suite capable of recording critical modeling parameters in-flight. The simulation captures important effects associated with subsystem coupling, and for this reason offers valuable design insight that may be used for improved system-level performance. This simulation approach avoids issues associated with non-coupled models by ensuring that across the entire flight, compatibility between components is enforced. By adopting this approach, the predicted flight endurance and lift production reflect interactions under real world conditions, whereas neglecting component interactions can lead to suboptimal designs.
This simulation approach may be used to make early design decisions when a lack of experimental data makes the initial specification of a feasible vehicle more challenging. Using the subsystem models, it is possible to narrow down the design trade space by collecting data on just the individual subsystems, and then coupling them in the simulation. As a vehicle design is realized, the simulation can then be focused on a particular aerodynamic and structural regime by tuning parameters to enhance predictive accuracy and resolution. Since the prediction approach is ultimately based on several tunable parameters, this evolving approach is recommended to ensure suitable predictive accuracy while simultaneously reducing reliance on laborious experimental analysis.
In the current simulations, thermal behavior of the battery and motors has not been included to reduce the complexity. However, in future work that will be an important aspect of performance to consider for enhanced predictive accuracy. Aeroelastic model validation will also need to be explored in more detail in future work by varying several design features and comparing the changes predicted by the model to experimental results for lift and thrust, as well as wing deformations. This will help to establish clearer limits on the range of applicability of this approach, as well as to perform optimization studies on key design parameters like the wing tension, torsional stiffness, and bending stiffness.
A key outcome of this effort is to inspire future work by others that may build upon the current results and allow realization of new capabilities in a variety of areas. One natural extension of this work will be to apply the approach to a new design effort. The procedure for a new design effort will depend upon the similarity of the new vehicle architecture to the Robo Raven II design explored here. Assuming that similar hardware choices are made, i.e. servos, flexible wings with thin film and spar structures, and lithium polymer batteries, the design process could largely adopt the same simulation approach used here to provide insight into component and functionality impacts on system behavior. With a more innovative design, it would be necessary to begin by building up suitable component-level models before proceeding to coupled system modeling.
Regardless of the novelty of any new design effort, a logical next step will be to perform vehicle optimization. Optimization efforts will require an iterative approach that relies on cycles of model tuning and testing to ensure accurate predictions. Since the underpinning aerodynamic models used here are lower fidelity, it will be important to perform an initial optimization, then conduct sensitivity testing in the neighborhood of the identified optimum to reveal where model assumptions may be inaccurate. The sensitivity of vehicle performance to relatively subtle changes in operation will necessitate the implementation of a control system that responds to disturbances. Since all flight testing conducted in this research was done through teleoperation, it was a major challenge to achieve ideal trim conditions for lift or endurance, particularly in the presence of unfavorable weather conditions. By including a controller that relies of state feedback and a model of how power consumption varies with vehicle operation, it will be possible to improve performance beyond the comparatively clumsy method of visually assessing vehicle state from the ground.
The presented approach provides a substantially improved system-level prediction of flight performance relative to prior work, particularly for predicting the effects of changing subsystem components and flapping conditions to optimize flight, and should be useful to flapping wing researchers, designers, and anyone interested in exploring how the subsystems of a FWAV interact.
Footnotes
Acknowledgements
Opinions expressed are those of the authors and do not necessarily reflect opinions of the sponsors.
Declaration of conflicting interests
The author(s) declared no potential conflicts of interest with respect to the research, authorship, and/or publication of this article.
Funding
The author(s) disclosed receipt of the following financial support for the research, authorship, and/or publication of this article: AFOSR grant FA9550-15-1-0350 with Dr Byung-Lip “Les” Lee program manager.