
Abstract
Biologically-inspired flapping wing flight is attractive at low Reynolds numbers and at high angles of attack, where fixed wing flight performance declines precipitously. While the merits of flapping propulsion have been intensely investigated, enhancing flapping propulsion has proven challenging because of hardware constraints and the complexity of the design space. For example, increasing the size of wings generates aerodynamic forces that exceed the limits of actuators used to drive the wings, reducing flapping amplitude at higher frequencies and causing thrust to taper off. Therefore, augmentation of aerodynamic force production from alternative propulsion modes can potentially enhance biologically-inspired flight. In this paper, we explore the use of auxiliary propellers on Robo Raven, an existing flapping wing air vehicle (FWAV), to augment thrust without altering wing design or flapping mechanics. Designing such a platform poses two major challenges. First, potential for negative interaction between the flapping and propeller airflow reducing thrust generation. Second, adding propellers to an existing platform increases platform weight and requires additional power from heavier energy sources for comparable flight time. In this paper, three major findings are reported addressing these challenges. First, locating the propellers behind the flapping wings (i.e. in the wake) exhibits minimal coupling without positional sensitivity for the propeller placement at or below the platform centerline. Second, the additional thrust generated by the platform does increase aerodynamic lift. Third, the increase in aerodynamic lift offsets the higher weight of the platform, significantly improving payload capacity. The effect of varying operational payload and flight time for different mixed mode operating conditions was predicted, and the trade-off between the operational payload and operating conditions for mixed mode propulsion was characterized. Flight tests revealed the improved agility of the platform when used with static placement of the wings for various aerobatic maneuvers, such as gliding, diving, or loops.
Keywords
Introduction
Fixed wing flight is mature and can be easily implemented with the extensive knowledge available. 1 Unfortunately, rigid fixed wing flight tends to suffer in low Reynolds regimes (<105)2,3 and at high angles of attack (>25o using the data for airfoil lift coefficients provided by Anderson 1 for context).4–6 In contrast, flapping flight can be favorable in these areas. 7 Unsteady airflow mechanics, like leading edge vortex (LEV) creation and shedding, operate favorably to produce forces at high angles of attack with flapping flight.6–10 Birds generate and control these effect to achieve high maneuverability and force generation which shine in displays of transient flight manipulation tasks like mid-air grasping and perching, feats which are not easily completed by conventional fixed wing systems although there are successful examples with rotorcraft.11,12 This is achieved via coordinated synchronous and asynchronous flapping gaits, body attitude, and modification of lift surface geometry in multiple degrees of freedom via control of their wings, tail and body motions.8,10,13–17 For example, birds are able to modify their wing geometries with variations in anhedral, dihedral, planform, camber, aspect ratio, and sweep5,10,13,17–19 in addition to wing warping. This is possible because avian morphology elegantly combines lightweight structure, exceptional control, energy density, and distribution of power-dense actuators.10,16 Similar feats of aerodynamic force control through actuation can been seen in mammalian flight. 9 Duplicating these feats in engineered systems proves to be difficult because direct force measurements on flying animals is difficult to perform and analyze3,17,20; current aerodynamic models do not yet provide accurate predictions of behavior at low Reynolds numbers (<105),13,21,22,23 and current actuator technologies impose limitations due to design challenges and system integration. 24
The energy requirements for bird-inspired flapping wing fling are higher than for other forms of location such as swimming, walking or running. 25 Furthermore, power is important for bird-inspired flight because work must be delivered at a rate that generates enough lift and thrust force simultaneously during the flapping motion. 16 For example, a high energy density power source may not be able to provide energy at a fast enough rate to achieve flight, resulting in an inadequately low power density. Actuator design and performance have also been a limitation for flapping platforms, primarily because the actuator options for driving the wing through the flapping motion must provide mechanical work while also being light. Actuation options tend to be localized and heavy, if they are designed to meet the mechanical power demands for flight. On the other hand, if they are designed to meet the weight requirements, then they may be unable to meet the mechanical power requirements. While many actuation options can provide adequate torque, they are unable to do so quickly enough (i.e. they are underpowered) to attain the flapping frequencies that are necessary for a given wing size to generate the lift and thrust forces necessary to achieve flight. Conventional actuators that meet the power requirements are often heavy, which restricts the number and location of actuators that can be used to generate a desired flapping wing motion. This often precludes the ability to mimic the biological kinematics of a bird wings, which require flapping motion and gaits consisting of multiple degrees of freedom.26,27 As a means of reducing system complexity and weight, many successful flapping wing platforms have relied on a single actuator7,28–31 to drive one degree of freedom, while other degrees of freedom are generated passively.19,30,32–37 One such approach is the usage of flexible membranes which provides performance with passive deformation (with benefits not limited to flapping flight only).35,38–40 Additionally, it was noted that usage of a single actuator to drive both wings saves weight, but limits the flapping gait. This is because only fixed amplitudes can be achieved and wing gait characteristics are tied to a single source, 41 unless a complex mechanism is designed to overcome it. 26
With recent developments in servo motor technology, independent control of passively deforming wings has been achieved in a flapping wing air vehicle (FWAV) known as Robo Raven. 42 Robo Raven I, the original design, is shown in Figure 1(a). The hallmark of Robo Raven is the ability to program the servos to independently control the wings with both high torque and high speed. There have been different versions of Robo Raven for various research pursuits: platform wing sizing and motor performance (II),4,24 harvesting solar energy (III),43–45 and autonomous flight control (IV).46–48 (an additional version exploring integrated flexible energy storage (VI) is also in development 49 which postdates the introduction of the concept for this work, 50 which is designated Robo Raven (V)). In these versions, continuously flapping, outside of brief periods of time, is required to sustain flight because of platform weight. Thus, increasing platform aerodynamic performance would widen capabilities, as well as potentially increase payload capacity. For example, higher aerodynamic performance would allow usage of different flapping profiles for greater maneuverability (such as changing flight path vector and vehicle orientation) which is useful for enhancing stability during adverse flight conditions, such as strong winds. By increasing payload, more sensors can be added for more complex autonomous control, or more power sources can be added to increase flight time.

(a) Robo Raven I flapping wing aerial vehicle. (b) Robo Raven V: Propeller-assisted flapping wing vehicle.
Due to the present limitations of the wing design and actuators used on FWAVs like Robo Raven, it has been desirable to find alternative approaches to increasing payload capacity and maneuverability. Thus, the goal of this paper is to explore the viability of adding a propeller propulsion mode to FWAVs and characterizing how this mode interacts with the flapping mode for thrust and lift generation. Flapping wings and traditional propulsion used with fixed wing aircraft need not be mutually exclusive. Given the thrust provided per unit mass when using propellers (even at scale), it was postulated that a propeller-assisted flight mode might generate more thrust and, in turn, aerodynamic lift, such that the added mass of the actuators and power sources would be offset and the payload capacity would be substantially increased. Furthermore, interactions between the flapping wing and propeller-assisted flight, particularly the placement of the propellers relative to the flapping wings need to be understood to determine if there are effects that adversely limit the aerodynamic forces that are generated. Therefore, the forces generated by each mode were investigated independently, as well as while operating together. This enabled each mode to be modeled and insight into the interactions between the two flight modes to be obtained in order to demonstrate the viability of using mixed mode propulsion for FWAVs in a new platform called Robo Raven V.
System model of aerodynamic force generation by FWAVs
During flapping flight, aerodynamic thrust and lift forces undergo periodic variations. A common modeling approach is to use a quasi-steady state assumption.10,34 Quasi steady-state wing theory assumes that the forces on a moving wing are equivalent to the sum of the forces on a fixed wing over a sequence of attitudes that track the wing motion. This model neglects acceleration forces and unsteady aerodynamic effects. 9 In very small intervals of time, the flight is considered level with no acceleration. This implies that the forces in all directions must be equal during steady-state flight, assuming no change in mass. Therefore, in the horizontal direction, thrust must be equal to the drag during steady-state flight. 1


Because the average thrust is generated using the flapping wings

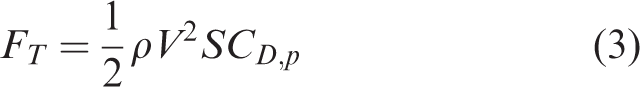
A proposed flapping wing model for the thrust is the following


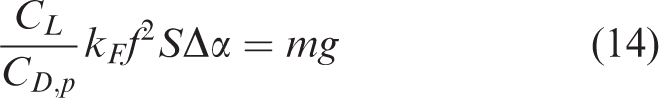
For steady flight with no acceleration in the vertical direction, forces must also sum to zero. Assuming no loss of mass or body forces aside form gravity, for steady-state flight conditions, average lift forces must offset the weight (mg).
1

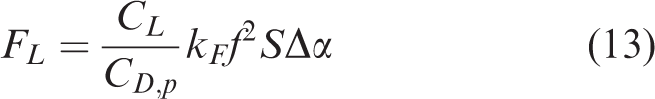
The aerodynamic lift is given by
1
as


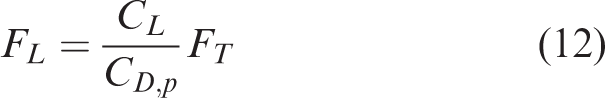
It is possible to relate thrust to lift using the velocity. Rearranging equation (3) and solving for V2 yields

Substituting equation (11) into equation (9)
Substituting the thrust generated by flapping (equation (5))
Substituting this lift into equation (10) yields the maximum flight weight
Based on this model, it can be seen that thrust governs the offsetting drag force value and subsequently dictates the forward velocity by the relationship given in equation (3) (if all else remains constant). An increase in velocity,
Strategies for increasing performance
An increase in thrust can be caused by either changing the flapping mechanics or adding another source of thrust production. A discussion of the former will shed light on the choice of the latter strategy employed in this work. Ideally, there are a few means of increasing flapping thrust production by changing the wing design, increasing the wing area S, attaining a higher flapping amplitude, and increasing the flapping frequency based on equation (5). The difficulty of changing wing design and size is the complex aeroelastic behavior which modifies kF. Global stiffness and localized stiffness changes the performance of wings2,51 as well as inertia. 52 Modeling changes of the mechanical deformation of the wing and tracing aerodynamic performance from it with an explicit model is still a point of research. Iterative design, via trial and error, and evaluation often are required to determine wing performance at specific operating conditions. 28 A lower value kF at a desired operating point yields lower force production and costs a design iteration. As example of this is a wing design that flutters, where the forcing produces vibrations of the membrane, instead of achieving deformations that generate useful aerodynamic forces. Given difficulties describing aeroelastic effects, it is desirable to maintain a proven, functional wing design. If the wing design is to be unchanged, modifying the flapping amplitude and frequency can be considered based on the model; however, actuator deficiencies prevail which limit both the flapping amplitude and frequencies.
Flapping frequency dependence on actuator performance
Given the dependence on flapping frequency, it should be possible to increase thrust by increasing flapping frequency and range. Work by Gerdes et al. 24 exploring motor performance, deformable wing sizing, and flapping frequencies shows that actuator limitations restrict the effects of increasing flapping frequency for thrust production. As flapping angle increases, thrust and lift also increase as shown in equation (3). At low flapping frequencies, the servos driving the wings are able to maintain the flapping angle and develop the required wing deformation to move air. At higher frequencies, the achievable angle tends to decrease as seen in Figure 2 as the servos are constantly trying to follow the commanded flapping signal. Given that there is a reduction in the flapping angle and subsequent wing deformation at high speeds, the rate of thrust and lift production falls below the quadratic increase with flapping frequency predicted by equation (5) for constant flapping amplitude. The decrease in additional thrust production is evident in Figure 3 as tapering off of the thrust above 2.5 Hz. Using the amplitude results from Figure 2 in equation (5), it can be seen that the model follows the loss of additional thrust production at higher flapping frequencies in Figure 3. The model assumes that the value of kF is constant based on experimental data at a known amplitude and frequency. Thus, it does not account for any aeroelastic effects of the wing itself, apart from changes in flapping amplitude. The departure of the measured data from the model at 4 Hz seen in Figure 3 is an indication that there may be additional dependencies of the model parameters on aeroeslatic behavior, beyond flapping amplitude. The results shown in Figures 2 and 3 are obtained using the same force transducer, brand and model of encoder, and measurement setup that will be explained in the methodology section. For further elaboration refer to Gerdes et al. 24

Loss of achievable flapping angle range as flapping frequency increases due to torque limitations of servo motors.

Average measured and modeled thrust vs. flapping frequency showing tapering of thrust production due to loss of flapping amplitude at frequencies above 2.5 Hz.
A means of attempting to surpass the angle limitation as flapping frequency increases would be the use of higher torque and higher speed motors which are often heavier. In the case of Robo Raven particularly, this change would result in larger servos that localize more mass at the front of the vehicle, which would make it difficult to achieve an angle of attack to achieve the necessary lift to achieve flight. Details regarding system design issues, such as the actuator and wing coupling, have been investigated in other work. 53 Therefore, new approaches are needed to augment thrust production in FWAVs.
Enhancing thrust production in FWAVs using propellers
As an alternate means to changing the main servo motors for the flapping wings to augment thrust production in FWAVs, propeller assistance was investigated in Robo Raven V. The addition of propeller-motor assemblies will change the steady-state thrust in equation (4) to the sum of the two modes minus a loss term for anticipated coupling,


Substituting the flapping model (equation (5)) and the propeller model (equation (16)) into equation (15) yields

Substituting equation (17) for the thrust term in equation (3) yields

Substituting the combined thrust, the lift is given by
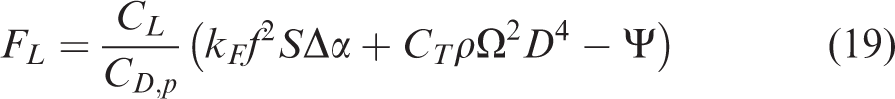
Substituting this lift into equation (10) yields

A benefit of adding thrust via a non-flapping mode, if completely decoupled from the flapping, is that the flight velocity can be increased aiding the aerodynamic lift term without altering the flapping mechanics. Based on equation (20), the implications are an increase in payload by the net increase of the lift or a trade-off scenario where an increase in the aerodynamic lift would decrease the demand for continuous flapping, allowing greater utilization of independent wing control to rapidly change the flight path vector and vehicle orientation.
Overview of Robo Raven V
Robo Raven V (shown in Figure 1(b)) modifies Robo Raven I by adding propellers behind the flapping wings, actuators to control the position of the propellers, and electrical connections to support the additional power and control for the propeller assemblies.
Propeller location
There were numerous configurations for the propeller placement. It could be placed in front or behind the wings and placed above, equal with, or below the body centerline. Combinations of these configurations are shown in Figure 4. Placing the propellers in the front is difficult because it makes the Robo Raven Platform, which is already nose heavy, even more-so which moves the center of gravity forward causes a nose dive. In the original Robo Raven I, the battery and microcontroller are placed at the rear of the platform (behind the tail assembly) to bring the center of mass behind the center of lift of the wings so the platform pitches upward. This is achieved by making the fuselage longer than necessary to mount the wings and tail assembly. This provides a large moment arm and serves to bring the center of mass behind the center of lift of the wings so that the platform pitches upward. Placing the propellers at the front of the platform magnifies this problem and cannot be easily corrected by adjusting the battery despite the larger battery mass to accommodate the electrical needs (which will be discussed later) and microcontroller position. Furthermore, front-mounted propellers are difficult because of the complexity of designing a mechanism that would securely attach the propeller assemblies, while leaving the flapping mechanism unaffected and allowing electrical access to each motor. More importantly, it is unclear how a localized change in air velocity before the wings would affect both the wind deformation and the airflow phenomena, particularly the formation of LEVs which is of key interest in flapping flight.8,9,28 In contrast, placing the propellers at the rear of the FWAV moves the center of gravity backward. With this configuration, it is possible to move the battery and microcontroller to adjust the center of gravity in an appreciable way while allowing electrical access from the center of the platform clear of moving parts. As noted previously, the propellers could be placed above, equal with, or below the body centerline. Placing the propellers above the center line pitches the nose downward because of the net moment generated by the thrust of the propellers at a distance away from the centerline. With the propellers equal, the centerline creates no net moment. The fear was that this is directly behind the flapping wings which might increase coupling. Finally, placing the propellers below the centerline can be favorable because of the net moment that is generated by the thrust of the propellers that counteracts the downward pitching moment from the forward mounted flapping motors and is not directly behind the mid stroke of the wings. Ultimately, the position of the propellers was chosen to be behind the wings and equal or below the centerline. An assembly was made such that the propeller position was adjustable to explore propeller placement and coupling effects. The length of the propeller mounting assembly was dictated by the propeller diameter. They were made just long enough to mount the propeller in order to reduce mass and the bending moment created by the force the propellers at the end of the mounting arm. The distance between the back of the wing and the propeller was kept small to reduce the form factor.
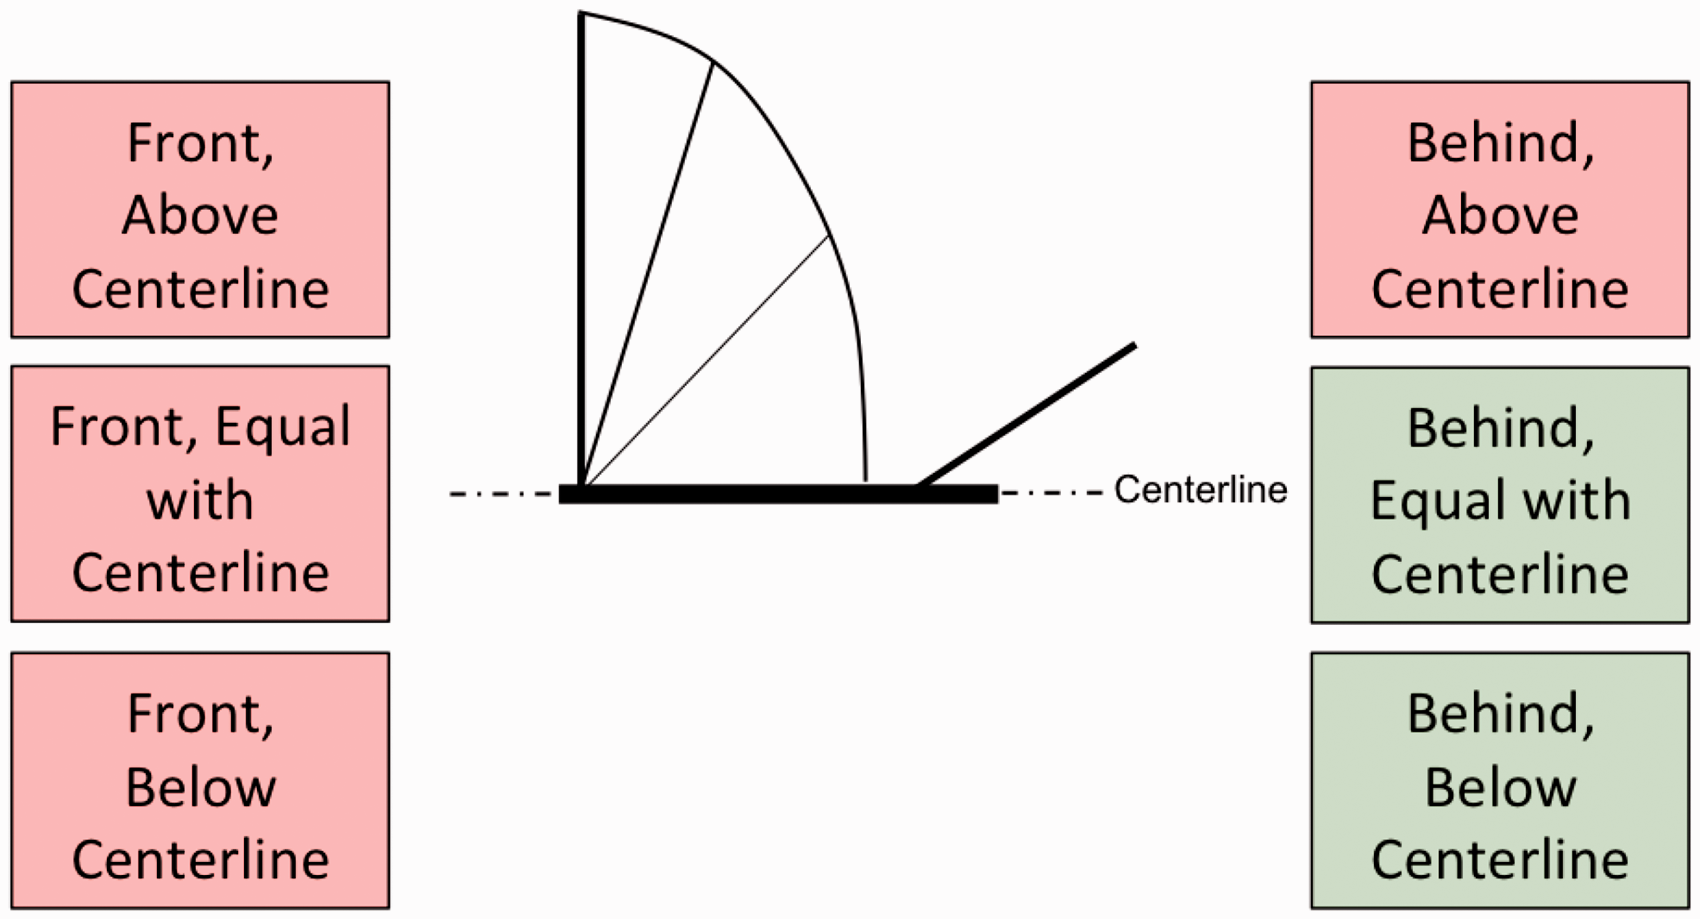
Considered propeller configurations. (a) Side view (b) rear view (propellers up) and (c) rear view (propellers down).
Hardware overview
Servo specifications.


Robo Raven V test stand. (a) Side view (b) rear view (propellers up) and (c) rear view (propellers down).
Testing methodology
In order to assess mixed mode performance, two Robo Raven V platforms were created. The first was a flight testing platform to verify flight feasibility and payload. To ensure similar flight paths and headings, all flight test were conducted on calm days in a shielded flight space. The platform was hand launched and allowed to reach steady flight. Rudder control was only utilized during the launch period. The second version was statically mounted to a test stand equipped with an American Digital optical encoder (# E5-500-118-IE-S-H-D-3) to record the wing flapping amplitude and ATI Mini40 six-axis force/torque transducer. Thrust measurements were recorded in 5 m/s (as measured by a pitot tube) of airflow generated by fan in a wind tunnel. 42 The force transducer is capable of independently measuring all six components of force and torque using a Cartesian coordinate system and was calibrated by ATI to measure up to 40 N in the X and Y directions with a resolution of 1/100 N (1.02 g) of resolution and 120 N in the Z direction with a resolution of 1/50 N (2.04 g). The resonant frequency for Fx, Fy, and Fz measurements is 3200 Hz, which is far beyond the operating frequency. This test stand design was developed and utilized in previous flapping flight work 58 and has characterized Robo Raven in previous work.42–45 Similar approaches with load cells have been used in other flapping research work. 59 A modification was made to accommodate Robo Raven V, given that all previous iterations of Robo Raven did not have propellers. This setup can be seen in Figure 5. This test stand allows for flapping at various frequencies, propeller positioning, and propeller speeds. In this work, propellers were operated at various motor input signals from 20% to 100% in increments of 20% while in 5 m/s airflow similar to Gerdes et al. 4 The corresponding angular speed, Ω, in revolutions per minute was related to the motor input signals using an Extech 461920 tachometer. Three trials were conducted for each force measurement including the baseline modes (flapping only and propellers only) and for each measured mixed mode condition. The data were recorded using a LabView VI interfaced with a National Instruments data acquisition system after the static platform was mounted on the load cell. During operation, the data were gathered for 5 s at 1000 samples per second. The flapping, propellers or both were started and stopped before and after each capture window, respectively, to ensure well developed operation free of initial and final transients. These 5000 samples were then averaged to provide the net thrust. The test was then repeated two more times. The average of three trials was then averaged produce the final figure for thrust provided. To prevent issues with motor heating which could skew the results, time was allowed between tests, particularly for the wing servos.
Investigation of coupling and vertical position sensitivity
To determine coupling and sensitivity to the vertical placement of the propeller assemblies, thrust measurements were taken using the load cell described above.
Coupling determination
In order to determine if there is coupling between the propulsion modes, baselines values for each mode were measured (i.e. only while flapping and only while the propellers were being driven). Assuming no coupling occurs (detrimental or beneficial), the expected performance would be the superposition (i.e. the sum) of the baseline measurements. Given the likelihood of negative coupling, a loss term,
Vertical position sensitivity
In order to determine if there was sensitivity to the vertical position of the propeller assemblies, tests were also conducted while flapping with the propellers located at various positions below the centerline – Specifically, at the maximum distance allowable, 53 mm (Figure 5(c)), and at incremented multiples of 10 mm below that (i.e. 50 mm, 40 mm, 30 mm, 20 mm, 10 mm, and 0 mm) where 0 mm is aligned with the body Figure 5(b)).
Flight performance and model evaluation
To verify flight feasibility using mixed mode propulsion, flight tests were conducted. While load cell measurements provide insights into aerodynamic force production, they fail to be fully representative of in-flight performance because the platform is fixed. Furthermore, given that this particular design is unprecedented, models do not exist to predict flight performance. For this reason, flight testing was critical to determine basic flight feasibility, payload, climb rate, and other capabilities provided dual modality (various combinations of flapping frequency, fixed wing positions, and propeller usage). Flight tests where experimental data were collected were conducted on days with wind speeds below 1 knot (0.5 m/s). Given the substantial increase in thrust and lift achieved with Robo Raven V, flight tests were conducted outside, unlike Robo Raven I which can be tested in an indoor facility.
To determine the maximum takeoff mass and payload capacity, mass was added to the craft until it was no longer able to climb and maintained a level flight path, meaning that the lift is offset by weight. To verify that the maximum takeoff mass was exceeded, additional mass was added to confirm there was a steady descent after launch. Given the dependence of the angle of attack on mass location, mass was distributed about the center of mass . The payload capacity determined by testing value was then compared to the model in order to evaluate the usefulness of the model. A single point (representing an average of three trials) of the measured data from the individual thrust modes was used to establish the coefficients for the thrust models for flapping and the propeller assemblies. Using those coefficients, trends were then established to determine the predicted mixed mode thrust and lift, which indicates the maximum takeoff mass. The predicted values for the maximum takeoff mass were then compared to experimentally determined values at various operating conditions during the flight performance determination. This is of particular importance because the quasi steady-state assumption for aerodynamic models can be inadequate in determining lift generation in some applications which provides false estimations of maximum takeoff mass and, consequently, payload. 10
Results
Investigation of coupling and vertical position sensitivity
For a flapping only baseline, the thrust generated by the wings was measured when operated at 4 Hz with the wing motors powered at the voltage of a slightly depleted two cell LiPo pack, 8.2 V. Given the testing duration, 20 flapping cycles were captured. The results are shown in Table 2.
Test results: Flapping only.

Thrust measurements using only the propellers were conducted as described in the Methodology section. To consider the impact of airflow on the propellers, tests were also conducted without airflow. Both results are shown in Figure 6 as well as the model given by equation (16). Details about the accuracy of the model will be described in the following section. The presence of airflow only slightly lowers the thrust. This is a positive result, since it implies that a change in freestream velocity should have low impact on thrust production of the propellers, thereby reducing the potential for coupling due to airflow behind the wings. Details of the thrust measurement in airflow, including data for three different trials, are provided in Table 3.
Propeller thrust with and without airflow vs. angular speed, Ω. Test results: Propellers only with intake airflow of 5 m/s.

As noted previously, the expected mixed mode flight performance is the superposition of the thrust generated while flapping only (Table 2) and the thrust generated using the propellers only at various operating conditions of the propellers (Table 3). To compare the measured performance to predictions, the thrust was measured with the wings flapping at a frequency of 4 Hz, while the operating input for the motors was varied from a minimum of 20% to a maximum of 100%; 4 Hz flapping frequency was selected as it is the operating frequency for the original platform that produces the most thrust. Given that the flapping wings modify the airflow conditions into the propellers most significantly at a higher frequency, it was postulated that this flapping frequency would generate the maximum amount of coupling and would therefore be of greatest interest to investigate. Also, given the possibility that coupling would vary as a function of the vertical position of the propeller, measurements were made with the location of the propellers below the centerline of the platform positioned from 0 mm to 50 mm in increments of 10 mm, as well as at the lowest position, 53 mm. A surface plot of the results can be seen in Figure 7.

Average measured mixed mode thrust surface for multiple propeller locations and speeds with 4 Hz flapping frequency.
The data in Figure 7 indicate that the thrust maintains consistent magnitudes for each position for fixed values of propeller angular speed, Ω. Therefore, the thrust appears to be insensitive to position of the propeller assembly. In particular, the shape of the thrust trend is consistent across the surface. The implication of this is that the thrust trend observed at any fixed position will be generally descriptive of the trends over the entirety of the operating positions. Therefore, the lowest position of 53 mm was chosen for further characterization and was also later used in flight testing. The details for the results for this position are shown in Table 4.
Measured mixed mode thrust (4 Hz flapping).

aMeasured with propellers located 53 mm below centreline.
The lack of variation in the values indicates that coupling is minimal, inducing at most an 8% difference. Therefore, these results indicate that the loss term in equation (15) can be neglected without loss of fidelity in the thrust predictions. The findings of the propeller thrust with no airflow and in airflow (Figure 6) show that there is little variation in thrust despite the change in input airflow. These findings are consistent with the static thrust coefficient measurements conducted by Deters and Selig 56 with similarly sized scale propellers across numerous Reynolds numbers.
The measurement results indicate that the interaction between the unsteady wake of the flapping on the performance of the propellers is minimal. The mixed mode results are largely consistent with the sum of the thrust predicted by the calculated sum of the individual propulsion modes. Additionally, the thrust is insensitive to distance below the centerline given that the thrust trend, increasing with the propeller angular speed, remains consistent despite the operating positions. The implication is that the motor position can be altered without fear that the magnitude of thrust would diminish.
Model evaluation
The models for flapping thrust (equation (5)) and propeller generated thrust (equation (16)) were compared to the measured results. These comparisons are shown in Figures 3 and 8, respectively. In order to determine the coefficients for the models, the thrust measurement from 3 Hz was used for the flapping because of the saturation of the trend (the reduction of the value ascent) beyond 3 Hz which is attributed to aeroelastic effects, the mechanical properties of the wings and their ability deform to displace air. As indicated previously, the notable departure in the thrust response at 4 Hz, in Figure 3, where the model predictions exceed the measured data, indicates the aeroelastic effects of the wing themselves go beyond the change in flapping amplitude. The models are in good agreement with the measured data gathered for the flapping and propeller performance as there is, at most, 9% difference between the measured value and that of the model for flapping and 15% for the propeller data (the remainder of the propeller values are all less than 5%). Using the sum of the two thrust models, a surface plot was created to predict the thrust for various operating conditions. These results are shown in Figure 9. The results across 4 Hz flapping frequency are shown in Figure 10 for the measured mixed mode thrust, the sum calculated from the measured thrusts for each mode, and the sum from the models of thrust for each mode. The modeled thrust response also overpredicts the experimental measurements in Figure 10 but is consistent with Figure 3, since the flapping model is summed with the propeller model. For the motor model, 100% motor input or a propeller angular speed, Ω, of 14,873 r/min was used.

Average measured and modeled propeller thrust vs. angular speed.

Modeled mixed mode thrust.

Average mixed mode measurements, superposed mode measurements, and modeled mixed mode thrusts vs. propeller angular speed, Ω (4 Hz flapping).
Thrust-generating efficiency
While higher thrust is valuable, the trade-off is both the weight added and power required to produce that thrust. In this regard, the efficiency of thrust generation per unit mass (as given in equation (21)) and thrust generation per unit of actuator power, P, (as given in equation (22)) are useful for comparison. As actuator mass is fixed, efficiency of thrust per mass is the highest value at the highest thrust available.

The wings generate 202 g of thrust. The Futaba servos weigh 72 g, 144 g for the pair. The flapping generates has a mass efficiency, Γ, of 1.4, g of thrust per gram of actuator mass. As noted previously, the major challenge of creating a flapping with platform is actuator performance and weight. The propellers generate 362 g of thrust when operating at 100% motor input. The total weight of the propeller assembly pair weighs 97.2 g. This yields a mass efficiency, Γ, of 3.7. The propeller assemblies are more efficient at generating thrust per unit mass. For the mixed mode case, the mass efficiency of the two is 2.2, where the total thrust is 527.2 g (the average of the experimental trails) and the mass is 241.2 g. The addition of the propellers increases the thrust efficiency per unit mass compared to pure flapping (Γ of 1.4).
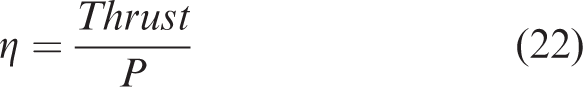
While the mass of the actuators is fixed, the power input for each mode is not. The efficiency for the thrust produced per unit of power, η, where power is the product of the operating voltage and current is another useful metric. Since the flapping was set to 4 Hz for all the mixed mode results in this work, only the power required for 4 Hz flapping is worth considering. The voltage used in each calculation is 8.2 V, the value of a slightly depleted lithium polymer battery. The efficiency, η, of the flapping is 4.93 g/W. This is the series shown at zero for the percentage of motor input in Figure 11. The efficiency of the propellers operating at different operational points operating along and in the mixed mode case are shown in Figure 11. Aside from the condition of 20%, each of the efficiencies for the remaining motor inputs is more efficient than the flapping case. In the mixed mode operation, the efficiencies are higher for each motor operational point aside from 20% motor input. The highest efficiencies in the propeller only case and the mixed mode operation both occur at 60% motor input as shown in Figure 11.
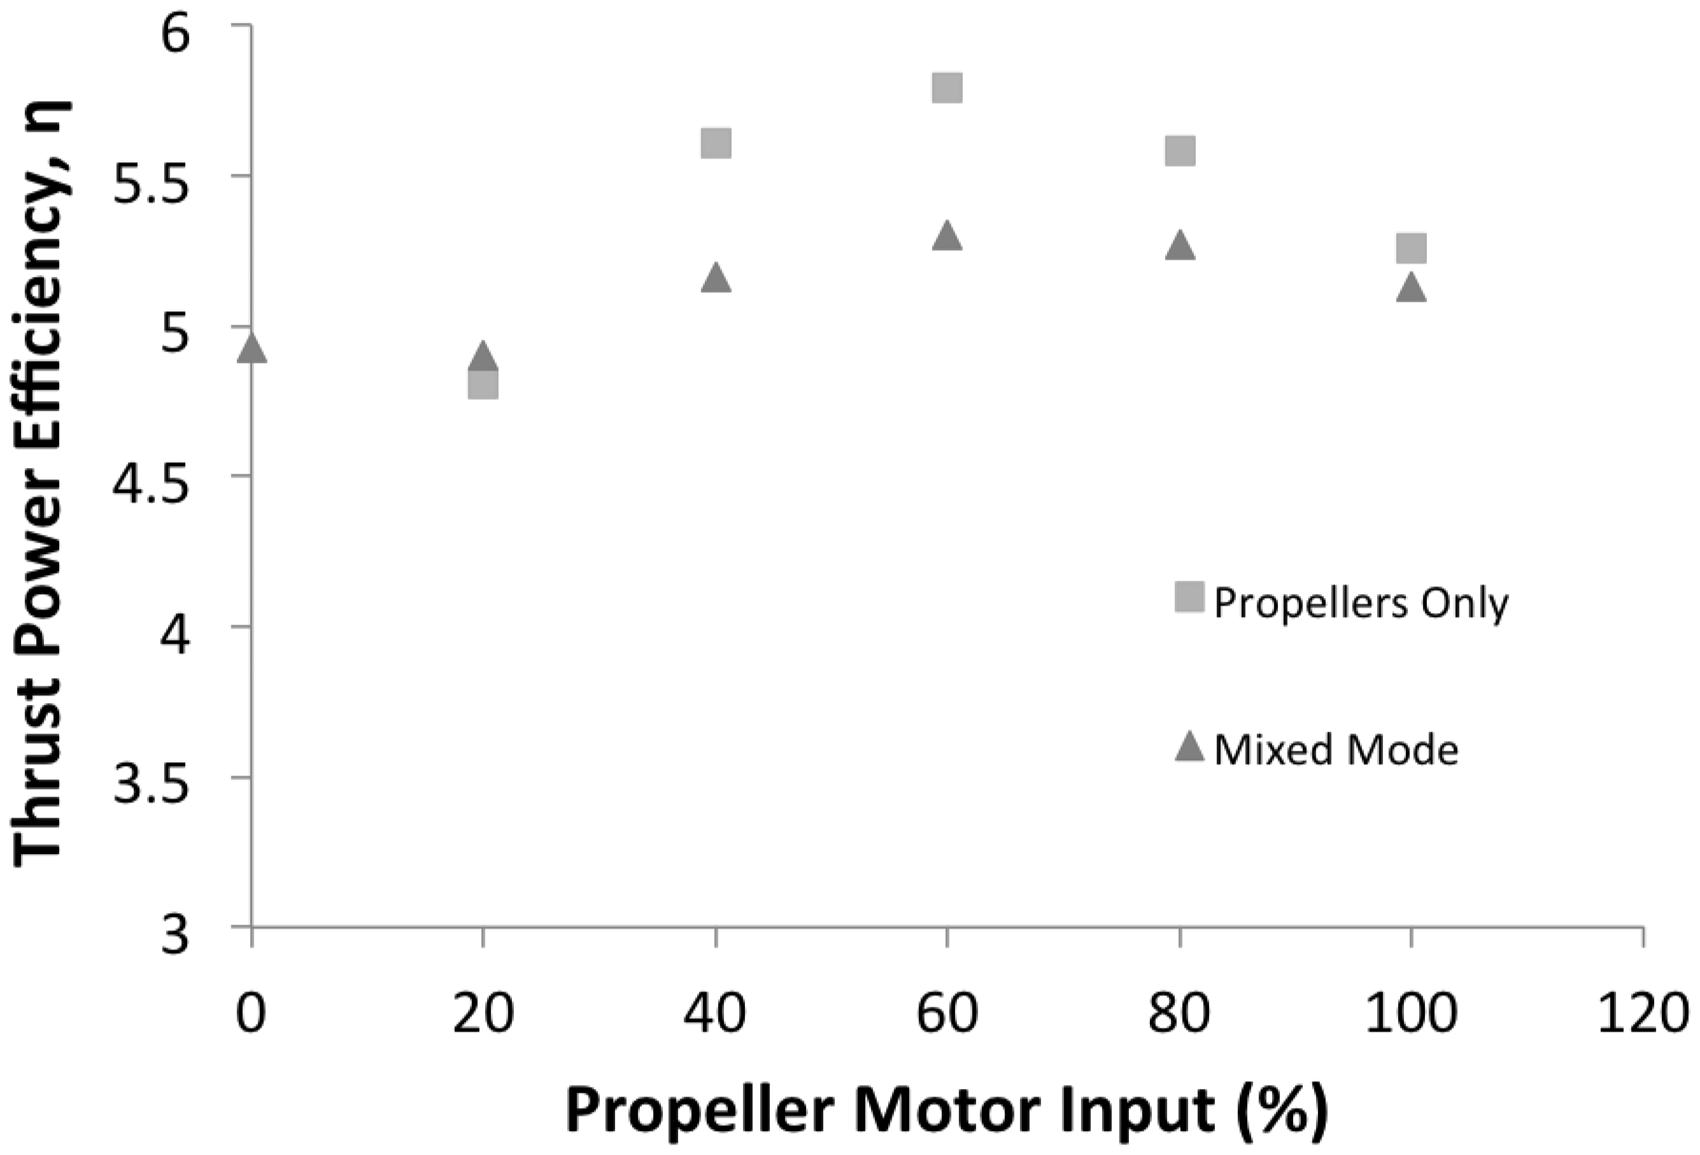
Thrust power efficiencies.
Mixed mode flight performance
Flight validation
Flight tests confirmed that Robo Raven V is capable of mixed mode flight using flapping and propellers. They also revealed that the platform is capable of other styles of flight: flight using the propellers as the sole propulsion mode after reaching a critical velocity (either by a launch or by use of both modes initially), intermittent flapping, and gliding. The propeller only and gliding is possible because the wings passively balloon into a suitable airfoil shape in flight (using flexible wings with propeller propulsion has been studied in other works38,40). Notably, gliding via the use of gravity to generate velocity is viable. At altitude, the propellers and flapping can be halted so that the wings can be held still at shallow dihedrals to achieve gliding. The gliding profiles can be altered into diving profiles by increasing th dihedral of the wings. Additionally, the back loop capability demonstrated with Robo Raven I was maintained. For flight footage of Robo Raven I please visit: https://www.youtube./watch?v = mjOWpwbnmTw. For flight footage of Robo Raven V please visit: https://www.youtube.com/watch?v = Yryz8PSAwmA.
Determination of payload capacity
Increasing payload capacity was a principal goal in the development of Robo Raven V. The trade-off in the approach is that the operating empty mass increases with the addition of the propeller assemblies and supporting hardware. The increase in operating empty mass must be offset and exceeded to increase the payload. A true improvement to payload maintains higher payload while maintaining comparable flight time across the entire operating range.
In order to ascertain the payload, two masses are recorded during flight tests. The operating empty mass, which is the total mass of essential components (with the exception of the power source as it can be varied), and the flight mass which is the sum of operating empty mass and the mass of the payload as follows

Rearranging equation (23), the payload is simply the difference between the flight mass and the operating empty mass

The maximum payload is the maximum takeoff mass, which occurs when the weight offsets the total lift minus the operating empty mass.

As described in ‘System Model of Aerodynamic Force Generation by FWAVs’ section, lift should be equal to the weight (equation (8)). Furthermore, based on equation (12), the lift should be equal to the product of the thrust and ratio of the coefficient of lift, CL, and the coefficient of drag,

Modeled mixed mode lift.
The final takeoff mass of Robo Raven I after payload testing was 328.8 g. Given the operating empty mass of 285.0 g, the maximum payload available was 43.8 g using equation (25). The maximum takeoff mass of Robo Raven V was achieved performing payload tests outside on a calm day with the adjustable arms at their maximum distance below the centerline, 53 mm, the propellers running at 100% full speed and the wings flapping at 4 Hz. The operating empty mass for Robo Raven V was 438.1 g. The maximum takeoff mass was 711 g, which was approximately 14% less than the predicted takeoff mass of 831 g in Figure 12, which is attributed to the overpredicted thrust in Figure 10 at the 4 Hz flapping frequency. Subtracting the operating empty mass of 438.1 g, the payload is 272.9 g (equation (25)). While the payload capacity increased by 229.1 g for takeoff, a true improvement also requires accounting for the effects of the power draw on the portion of the payload capacity that will be taken up by the battery mass required for a desired flight time.
Flight time estimation
The payload is available and is divided between the energy source required to power the platform and the operational payload which can be used to carry sensors (equation (26)).

There is a minimum battery mass required to power the platform; after this basic amount, operational mass can be traded to increase flight time. The minimum battery mass is the mass required to provide the operating current. The continuous current, I, is the product of capacity and the lower value of the C rating, the rate at which the battery can discharge current. If the continuous current and C rating are given, the capacity can be found working backwards. The battery capacity divided by the battery mass, β (equation (27)) can then relate capacity and mass.

After finding the minimum battery size, the upper bound is based on mass because of payload availability. The product of voltage and the capacity of the battery, Q, is the energy available. If power consumption is known, an aggregate estimation of flight time is given in equation (28).

In order to make fair comparisons of performance, the value of β must be held constant. Robo Raven I is powered by a 27 g Turnigy 370 mAh, 25 C nano-tech battery where β is 13.7 mAh/g. This value of β used to compare payload benefits. In practice, the general trend is that β, the ratio of the battery capacity to battery mass, increases in a favorable manner because battery capacity, which is a function of volume, scales differently than packaging mass, which is a function of surface area.
Robo Raven I draws 41 W of power between the main wing motors and a nominal power demand of the tail servo. The minimum battery that can be used safely is a 200 mAh LiPo battery given a C rating of 25 which yields a flight time of 2 min and 24 s and weights 14.6 g maintaining β of 13.7 mAh/g. The final flight mass of Robo Raven I after payload testing was 328.8 g. Given the operating empty mass of 285.0 g, the maximum payload available 43.8 g using equation (25). Given the minimum battery mass, the operation payload remaining is 29.2 g which represents 10.2% of the operating empty mass. If the entire payload is occupied with a battery (maintaining the same value of β), the largest battery capacity, Qmax, is 600 mAh which provides a flight time of 7 min and 12 s.
Robo Raven V operates at 100% propeller speed and 4 Hz flapping . Robo Raven V draws 113.16 W. Given the higher current demand, at minimum, a 552 mAh 25 C LiPo must be used for continuous safe operation. Maintaining the β value of 13.7 mAh/g, the minimum mass of a 552 mAh battery is 40.3 g and yields a flight time of 2 min 24 s.
The operating empty mass for Robo Raven V was 438.1 g. The maximum takeoff mass was 711.0 g. By subtracting the operating empty mass of 438.1 g, the payload is 272.9 g. In order to carry the minimum required battery with a mass of 40.3 g, the operational payload available would be 232.6 g which represents 53.1% of the Robo Raven V operating empty mass. If the entire payload is occupied with a battery (maintaining the same value of β), the largest battery capacity is 3740 mAh which yields a flight time of 16 min and 16 s.
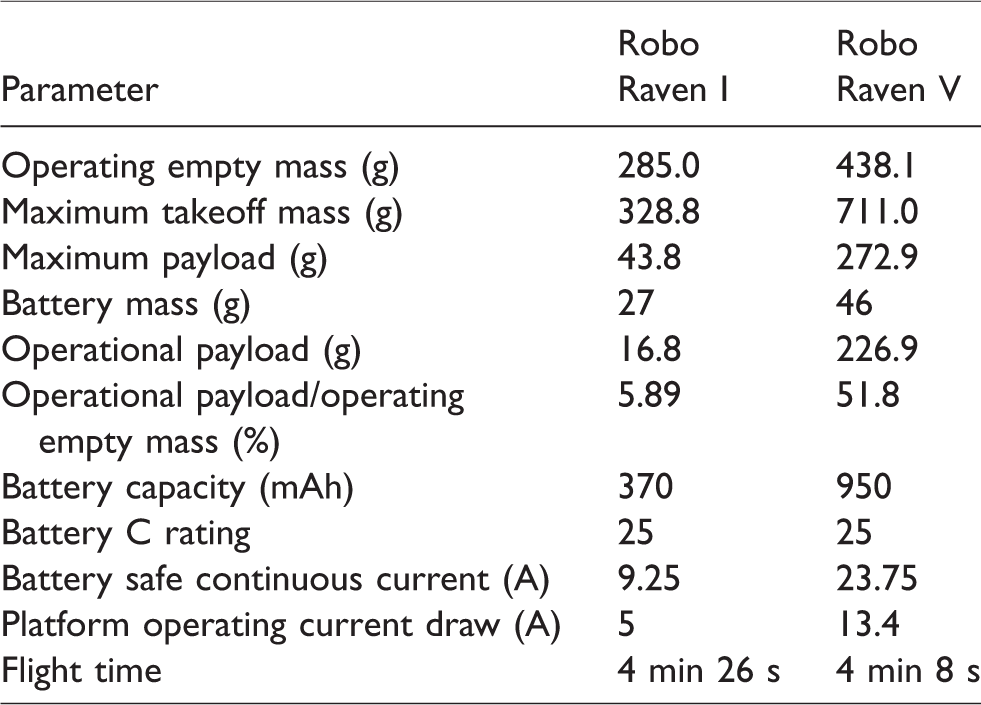
As noted previously, a 27 g 370 mAh, 25 C battery is typically used for Robo Raven I. Subtracting the battery mass from the payload, the operational payload is 16.8 g as shown in equation (26) which represents 5.89% of the operating empty mass of Robo Raven I. Based on usage, the flight time using 370 mAh battery is 4 min 26 s. The closest available commercial battery to provide similar flight time for Robo Raven V is a Turnigy nano-tech 950 mAh battery (β = 20.6 mAh/g) which provides a flight time of 4 min 8 s. With a 950 mAh battery, the remaining operational payload for Robo Raven V is 226.9 g which is 51.8% of the Robo Raven V operating empty mass. Comparison of the physical parameters and electrical specifications for Robo Raven I and V can be seen in Table 5.
Comparison of Robo Raven I and Robo Raven V platforms for similar flight times.
Taking the minimum and maximum values for flight time and percentage of operational payload and graphing increments in between them, Figure 13 was generated. What is notable is that across the entire range of flight times, the ratio of operational payload to relative to operating empty mass remains higher for Robo Raven V than Robo Raven I. While the slope is steeper for Robo Raven V, the initial value is much higher given the available payload. The lines never intersect. The implication is that for the same flight time (going up the vertically) the payload is higher. Additionally, the right endpoint indicates that the ultimate flight time, made available by the payload, is improved despite using a poor estimate of β, capacity to mass ratio.

Operational payload/operating empty mass (%) vs. flight time (min).
As noted previously, increasing the battery capacity tends to come with a disproportionately smaller increase in mass. This means that the value of β increases in a favorable manner with larger battery capacities if the electrical connector remains the same (the fixed mass with a heavier connector skews the scaling). For example, a 950 mAh battery of the same brand has a mass of only 46 g which yields a β value of 20.6 mAh/g. This difference works to shift the right endpoint in Figure 13 and lower the slope of the line in a favorable manner. The result is more payload capacity, as well as flight time.
What is interesting is to consider the effects of changing the operating conditions. Especially, the operating conditions for the mixed mode cases of 3 Hz flapping with 60% motor input and 3 Hz 100% motor input, which are also shown in 13. The wattage consumed was adjusted accordingly based on the change in power consumption associated with 3 Hz flapping and 60% versus 100% motor input. Despite a lower ultimate payload, 3 Hz flapping with 60% motor yields a longer flight time. The efficiency of the thrust generation is highest for this condition, as shown in Figure 11. The most interesting result is the comparisons of 3 Hz flapping and 4 Hz flapping with 100% motor. The 4 Hz case produces a higher payload and higher consumption. In contrast, the 3 Hz has lower consumption but has a lower starting payload. Therefore, it is clear that a tradeoff scenario exists between the operational payload and the propulsion efficiency for the flapping frequency and motor input conditions, which we have been able to characterize.
Discussion
Research findings from flapping wings have focused primarily on LEVs and have indicated that unsteady effects are integral to force generation for flapping wings regardless of if they are flexible or are rigid airfoils which pitch and surge.9,39 Research considering membrane wings such as mammalian flight, although largely focused on insect scale for microair vehicles, indicates that LEVs are important mechanisms for force production8,9,60 and that trailing airflow effects are generally secondary but still important (particularly for microair vehicles).35,60 Research by Ho et al. 2 exploring membrane wing design indicates that the lift-generating section of the wing for this type of wing design is toward the wingtip, which is positive for payload carrying capability in this application, while thrust generating section is closer to the body which would have more interaction with the propellers given their location. Unfortunately, models addressing outflow conditions and the implications of disruptions to the outflow conditions on flapping wing performance are still forthcoming as research into this area is developing.8,35
Experimental studies have also been conducted to visualize the flow at the leading edge of waving and flapping wings.2,8,9,35,60,61 The most notable findings have been the development of LEVs that led to the formation of unsteady flow structures, which tend to increase towards the tips of wings or flags. The three-dimensional nature of these structures is well-visualized in Jones et al. 61 and Muijres et al. 9 In light of these findings, we wanted to investigate mounting propellers to the rear of flapping wings to minimize the effects of the propeller outflow on the formation of LEVs, aside from an expected increase of freestream velocity from the added thrust from the propellers. It is also noted by researchers3,6,62 that, given their aeroelastic behavior, compliant wings are likely better at adapting to unsteady conditions as the wing deforms differently depending on the flow present. This change in deformation in response to flow conditions likely explains the limited performance reductions we observed. An example of adaption of the deformation in the presence of varying flow, albeit closer to freestream variations, was clearly observable during flight tests when the wings balloon into a cambered shape when in a gliding motion.
By mounting the propellers at the rear, it also became of interest to understand if the unsteady flow produced from the trailing edge of flapping wings would be extremely damaging to thrust generation for propellers. While there has been some work on non-uniform inflow conditions to propellers for rotorcraft (such as ground effect), 63 the characterization of scale propellers (compounded by the plethora of available designs) in oblique flow (i.e. flow where there is a non-zero angle between the plane of the propeller and the freestream wind velocity) or unsteady flows, is a newer area of research being driven by increasing demands in performance for unmanned aerial vehicles.64,65 In these studies, force measurements have been conducted for thrust generated from propellers in oblique flow. Specifically, an experimental and numerical study of scale propeller performance in oblique flow was conducted as a preliminary step in the design and development of a Vertical Takeoff and Landing (VTOL) platform. 65 The thrust findings indicate that the thrust values and trend are consistent across numerous angles between 0 and 90°. The largest fluctuation occurred when the freestream was 90°, perpendicular to the tip plane of the propellers. However, the trend and average values were found to be similar, within the range of the expected measurement error. A similar inquiry was conducted by Powers et al., 64 where the propeller performance in a quadrotor was considered in forward flight for ground and ceiling effects. To access forward flight in oblique flow, five angles of attack and four wind speeds at each angle were considered. The findings showed that the total thrust produced by the rotor decreases as wind speed in a given direction increases. As the angle of attack increases, the thrust variation due to wind speed decreases, as the component of wind velocity perpendicular to the rotor increases more slowly. These findings are consistent with the finding in Figure 6. In the presence of no freestream, the thrust produced is higher than in the freestream flow. The promising results from all of these investigations indicate the sensitivity of the thrust to inflow, albeit steady, at an angle is generally low. Additionally, the findings of Powers et al. 64 indicate that as the overall thrust decreases, the sensitivity of the thrust to an increasing freestream velocity will decrease. This is particularly true when the angle of inflow is low. Thus, these findings support those from our current study, which indicate inflow conditions to a scale propeller that may not be as damaging to thrust performance when it is located behind the trailing edge of a flapping wing.
In the Robo Raven V platform, the flexible flapping wings are relatively much larger to the size of the propellers, and the duration of time that the wings are in front of the propellers is limited given the periodic motion of the wing (as a function of the flapping frequency). The propellers are also located close to the attachment point of the wings to the body, away from the wing mid span. Given the flow visualization in the studies noted above2,8,9,35,60,61 (unsteady flow structures likely tend to form from the mid span towards the wing tips. It is noted by Ho et al.
2
that the linear speed of the wings is higher towards the tips and leads to stronger vorticity. Keeping the propellers away from these areas can limit interactions. As a result, the airflow velocities are likely closer to the freestream velocity. Regardless, given the consistency of the thrust coefficient measurements conducted by Deters and Selig
56
with similarly sized scale propellers across numerous Reynolds numbers, and the findings of Powers et al.
64
and Theys et al.
65
in oblique flows, it is unlikely that a change in inflow velocity would greatly change propeller performance, although there has been conjecture it should be lower.
64
Therefore, by (a) locating the propeller along the flapping wing away from unsteady vortex structures and (b) limiting the area available for interaction between the wing and propeller, we have been able to effectively eliminate wing–propeller interactions. It is also important to note that for the flapping wings at a typical freestream velocity of 10 m/s for Robo Raven V with a 1.168 m wingspan and an
Flight testing has also indicated that the addition of the propeller is valuable, because it allows higher performance with regard to total lift and ultimately the payload capacity. At lower flapping frequencies, the measured payload outperforms the lift predicted from the quasi steady-state model prediction using the sum of the individual modes. However, the modeled lift over predicted the payload at 4 Hz flapping due to the aforementioned aeroelastic effects. Using both propulsion modes, Robo Raven V significantly outperforms the original Robo Raven I platform, which utilized flapping only. Across the entire operating range, the payload was higher for similar flight times. Furthermore, the maximum flight time was significantly higher. If batteries with higher specific energy capacity are utilized, the performance will continue to improve. In flight, the bi-modality provides interesting opportunities, specifically the ability to switch flight conditions. As demonstrated in the flight footage mentioned in ‘Flight validation section for Robo Raven V, the propellers can be used to rapidly increase forward velocity and climb rate, while flapping can be used to maintain flight at lower forward velocities. The propellers can also be used to impulsively load the wings at angles above their stall angle to increase the lift coefficient. In addition, the propellers and flapping can both be halted, allowing for execution of various aerobatic maneuvers, such as gliding, diving, or loops that can be controlled simply through the static adjustment of each wing’s position.
Conclusions
In this work, an FWAV with independent wing control and a wake positioned propeller assembly is presented as a means of increasing aerodynamic force generation to increase payload capacity in a mixed mode propulsion condition. The findings show that, first, there is no notable cross-linking/coupling between the two propulsion modes (i.e. flapping wings and propellers). Second, thrust generated by the propellers is not sensitive to the propeller assembly position in the wake of the wings as there were consistent thrust trends at various motor operating points across multiple vertical positions of the propellers. Finally, adding propeller propulsion to FWAV is a viable means of increasing aerodynamic performance specifically thrust production and, subsequently, aerodynamic lift to increase payload capacity.
Results indicate that using propellers in conjunction with the wings can increase thrust as much as 261% at full signal. The resulting increase in thrust increases the available payload from 43.8 g to 272.9 g. While it was determined that the propeller assembly increases current draw by 176% when operating at 100% operational power, if all of the additional payload is occupied by batteries to power the platform, flight time can increase 341% over the initial design. Thus, despite the increased power requirements, the lift benefits provide a significant enhancement of operational performance through increases in payload or flight time. The measured enhancements also conformed to the predictions from models of the aerodynamic forces generated by the mixed mode propulsion. In addition, the effect of varying the amount of operational payload on flight time for different mixed mode operating conditions was predicted, and the tradeoff between the operational payload and the propulsion efficiency for the flapping frequency and motor input conditions was characterized. The bi-modality can be leveraged to perform aerobatic maneuvers, such as gliding, diving or loops that can be controlled through adjustment of the static position of each wing.
This current work focused on using thin membrane wings that are very flexible and amenable to generating sufficient aerodynamic force to achieve flight through the flapping mode only. Conventional fixed wings tend to be much stiffer and heavier in order to maintain a more aerodynamic shape; hence, they require signification power to flap. Future directions for this work include: examining new styles of morphing wings with more aerodynamic shapes conducive to generating aerodynamic lift through fixed wing flight, while also being light enough to flap. Another direction for future work is the automatic selection of the two modalities to fit various weather conditions and missions.
Footnotes
Declaration of conflicting interests
The author(s) declared no potential conflicts of interest with respect to the research, authorship, and/or publication of this article.
Funding
The author(s) disclosed receipt of the following financial support for the research, authorship, and/or publication of this article: This work was supported by an NSF Bridge to Doctoral Graduate Fellowship granted to Alex Holness via the University of Maryland, College Park Center for Minorities in Science and Engineering and AFOSR grant FA9550-15-1-0350 with Dr. Byung-Lip ‘Les’ Lee as program manager.