
Abstract
An appealing concept for jet engine combustors is the Lean Premixed Prevaporized (LPP) combustor, which operates at high pressures. The low NOx emissions achieved by lean combustion are one of the targets for modern aircraft engines. However, these types of combustors can introduce thermoacoustic instabilities that can potentially damage the engine and reduce its lifespan. Since the potential instabilities on the fuel spray characteristics, i.e. the spray mass flux, can affect the flame stability, the need arises to investigate the spray response under an unsteady airflow.
For this study, a model prefilmer was experimentally investigated to produce a two-dimensional droplet flow without swirl flow. An acoustic forcing in the range of 100–500 Hz was introduced into the airflow, characterized by a hot wire Constant Temperature Anemometry (CTA) setup. Droplet characteristics, namely the droplet diameter distribution and velocity, were determined using a Phase Doppler Anemometry (PDA) setup, while the acquired data were phase-averaged in one period of the airflow oscillation. The influence of the excitation frequency and the air-to-liquid ratio (ALR) on the spray was studied: the spray responded to the acoustic excitation and therefore critical performance parameters, such as the spray mass flux, oscillated indicating potential problems regarding the flame stability.
Introduction
In the context of thermoacoustic instabilities that often occur in the combustion chamber of jet engines, the inlet air velocity is subject to oscillations1,2. Most modern jet engines use prefilming airblast atomizers to disintegrate the liquid fuel in a spray of droplets 3 . Since the operating principle of this type of atomizers is based on the high relative velocity between the air and the fuel4,5, uncontrolled instabilities of the inlet air velocity affect the atomization process. The spray quality affects crucial operating characteristics such as the local and temporal air-to-fuel ratio (AFR) in the chamber, the flame stability limits, the combustion efficiency, and the NOx emission levels. 3 Therefore, predicting the performance of the atomization process under unsteady airflow conditions has a significant value.
In order to investigate the response of the airblast atomization process under unsteady conditions, a model prefilmer was designed for an extended analysis of the spray in a two-dimensional flow. In a few studies, a similar planar model prefilmer has been used for investigation in a variety of targets. In some cases it would be for similar research purposes as in this work, with a scope to investigate the response of the spray to an acoustically forced airflow6–8. Further investigations focused on fundamental atomization aspects such as the film thickness and the primary breakup phenomena9–14. Other studies focused on modeling the air modulation on the spray distribution10,15 and provide insights into the influence of the excitation frequency.
Previous studies in the test facility of the Engler-Bunte-Institute had analyzed the behavior of the spray in a single excitation frequency near 100 Hz7,8. In this study, the influence of the excitation frequency and the air-to-liquid ratio (ALR), i.e. the ratio of the air mass flow rate over the liquid mass flow rate, on the spray characteristics was investigated experimentally. Frequencies in the range of 50 to 500 Hz were examined, since this is a range of interest for the actual jet engine instabilities16,17. A Phase Doppler Anemometry (PDA) system was used to determine the fluctuations in the spray, while the air velocity and its periodic variation were characterized via a hot wire Constant Temperature Anemometry (CTA) setup.
Trends in terms of mean droplet velocity, the Sauter Mean Diameter (SMD), and the mass flux of the spray were observed, while separation of the size classes on the mean droplet velocity gave insight into the delay between the larger droplets compared to the smaller ones, for a variety of excitation frequencies.
By utilizing the experimental data of the response of the spray under different frequencies in thermoacoustic models18,19, predictions for flame stability and engine hardware safety can be developed.
Experimental method
The experimental setup used for this research is described in detail in previous publications.7,8. The air is supplied in the system by a compressor and is split into two sections. Part of the air flows through a pulsating device and is subject to imposed acoustic forcing, while the rest of the air flows through a plenum. The two flows mix coaxially in a 1.5 m long pipe, at the end of which the model prefilmer illustrated in Figure 1 is placed. Water is supplied directly into the prefilmer through a pressurized vessel and is controlled by a set of needle valves and a mass flow meter. The water emerges on the surface of the prefilmer via a row of drilled holes, creating a thin liquid film. The liquid then accumulates at the atomization edge, where the break-up process occurs with the aid of the airflow shearing the film.
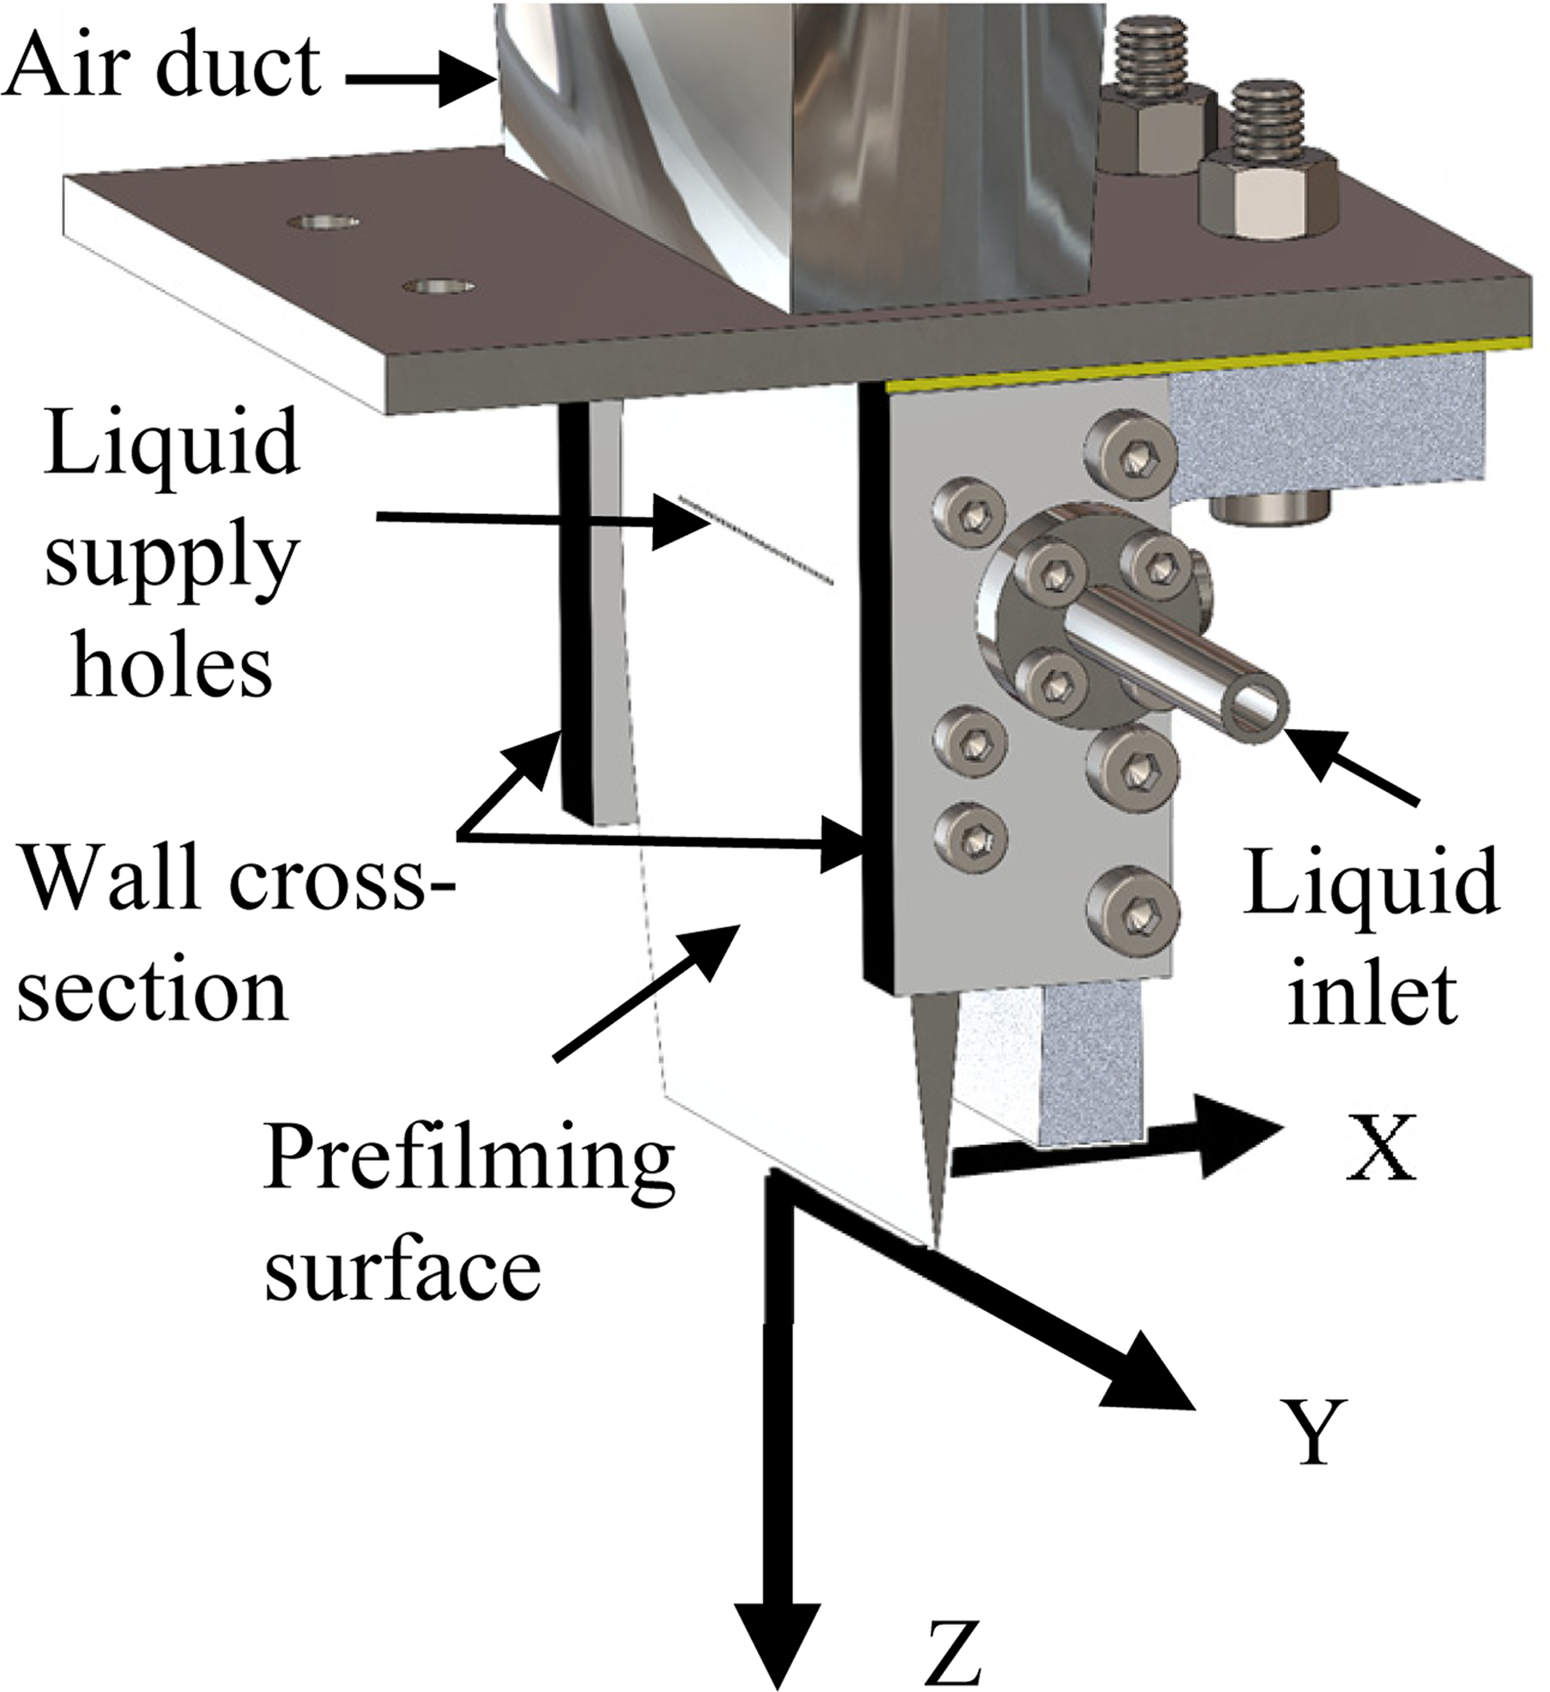
Sketch of the model prefilmer.
A hot wire CTA was used to investigate the resulting airflow under the acoustic forcing. A two-wire probe with tungsten platinum-coated wires of 3.8 μm diameter and 1.27 mm length each was used. A high sampling rate of 40,000 Hz was selected for this application to reliably identification of the oscillations in the range of 100–500 Hz, acquiring approximately 524,000 samples for each position.
The characterization of the spray (diameter and both velocity components of each droplet) was carried out using a commercial Phase Doppler Anemometry system. Two diode-pumped solid-state lasers were used, providing laser beams in the wavelengths of 532 nm (green) and 561 nm (yellow). Utilizing the green laser light, the droplet velocity in the main flow direction and the diameter were measured for each spherical droplet that crossed the measurement volume determined by the PDA optics. Considering the wavelength of the laser beams, the beam spacing, and their intersection angle, this setup configuration generates a measurement volume with a diameter of approximately 154 μm and a length of approximately 2.7 mm, which enables measurement for droplet diameters up to 300 μm. When the measurement volume was within a dense spray region, data rates of up to 10 kHz were achieved. A validation rate, i.e. the fraction of droplets with a sphericity within the tolerance limits of the PDA technique, of approximately 60% was ensured in these conditions. By collecting 50,000 droplet samples per measuring point, the phase averaging of the resulting characteristics in twenty bins had a higher statistical significance. An encoder signal from the pulsating device's motor was equipped to the software of the PDA system; therefore, all spray measurements share a common reference, which is the zero phase angle.
The prefilmer is not contained in any chamber and therefore the atomization process took place under atmospheric temperature and pressure. The measurement position for this study, for both the CTA and PDA analysis, is on the center plane of the prefilmer at Y = 0 mm, in a downstream distance Z = 40 mm, while two locations in the radial direction are examined; at the centerline X = 0 mm and at X = −5 mm.
A LabVIEW program designed particularly for this experimental campaign was used to monitor the setup as well as to determine the operating conditions in real time. All obtained signals for air and water pressure, temperature, and mass flow measurement were transmitted from the respective measuring equipment to a National Instruments card placed on a four-card chassis (NI cDAQ-9174). In the crucial point upstream of the prefilmer model, the pressure is simultaneously measured twice using two pressure transducers. The first one installed there was a differential sensor that measures the pressure at that position in relation to the ambient air pressure, while the second was an absolute pressure sensor. The atmospheric pressure at each instant was computed by combining the information obtained from the two transducers. The same way, the pressure drop across the nozzle Δp/p was calculated, ensuring that its average remains constant for all experiments.
Results and discussion
In order to characterize the operation of the pulsating device in terms of amplitude and frequency, CTA hot wire measurements were carried out in a variety of excitation frequencies. Preliminary measurements had shown that resonance with high amplitude in the velocity occurred in the system near the multiples of 100 Hz. Therefore, four excitation frequencies in these ranges were selected. Measurements were performed at a sampling rate of 40 kHz to be able to detect higher harmonics with sufficient accuracy.
By analyzing the acquired signals via a fast Fourier transform (FFT), the exact excitation frequency of the system was identified. Given the sample rate and the number of samples acquired for each experiment mentioned at the previous section, a fine frequency resolution of 0.076 Hz was achieved. By analyzing the resulting FFT shown in Figure 2, they all have a similar amplitude. This is the main reason why these specific cases were considered, in order to isolate the frequency as a parameter and allow comparability between all experiments.
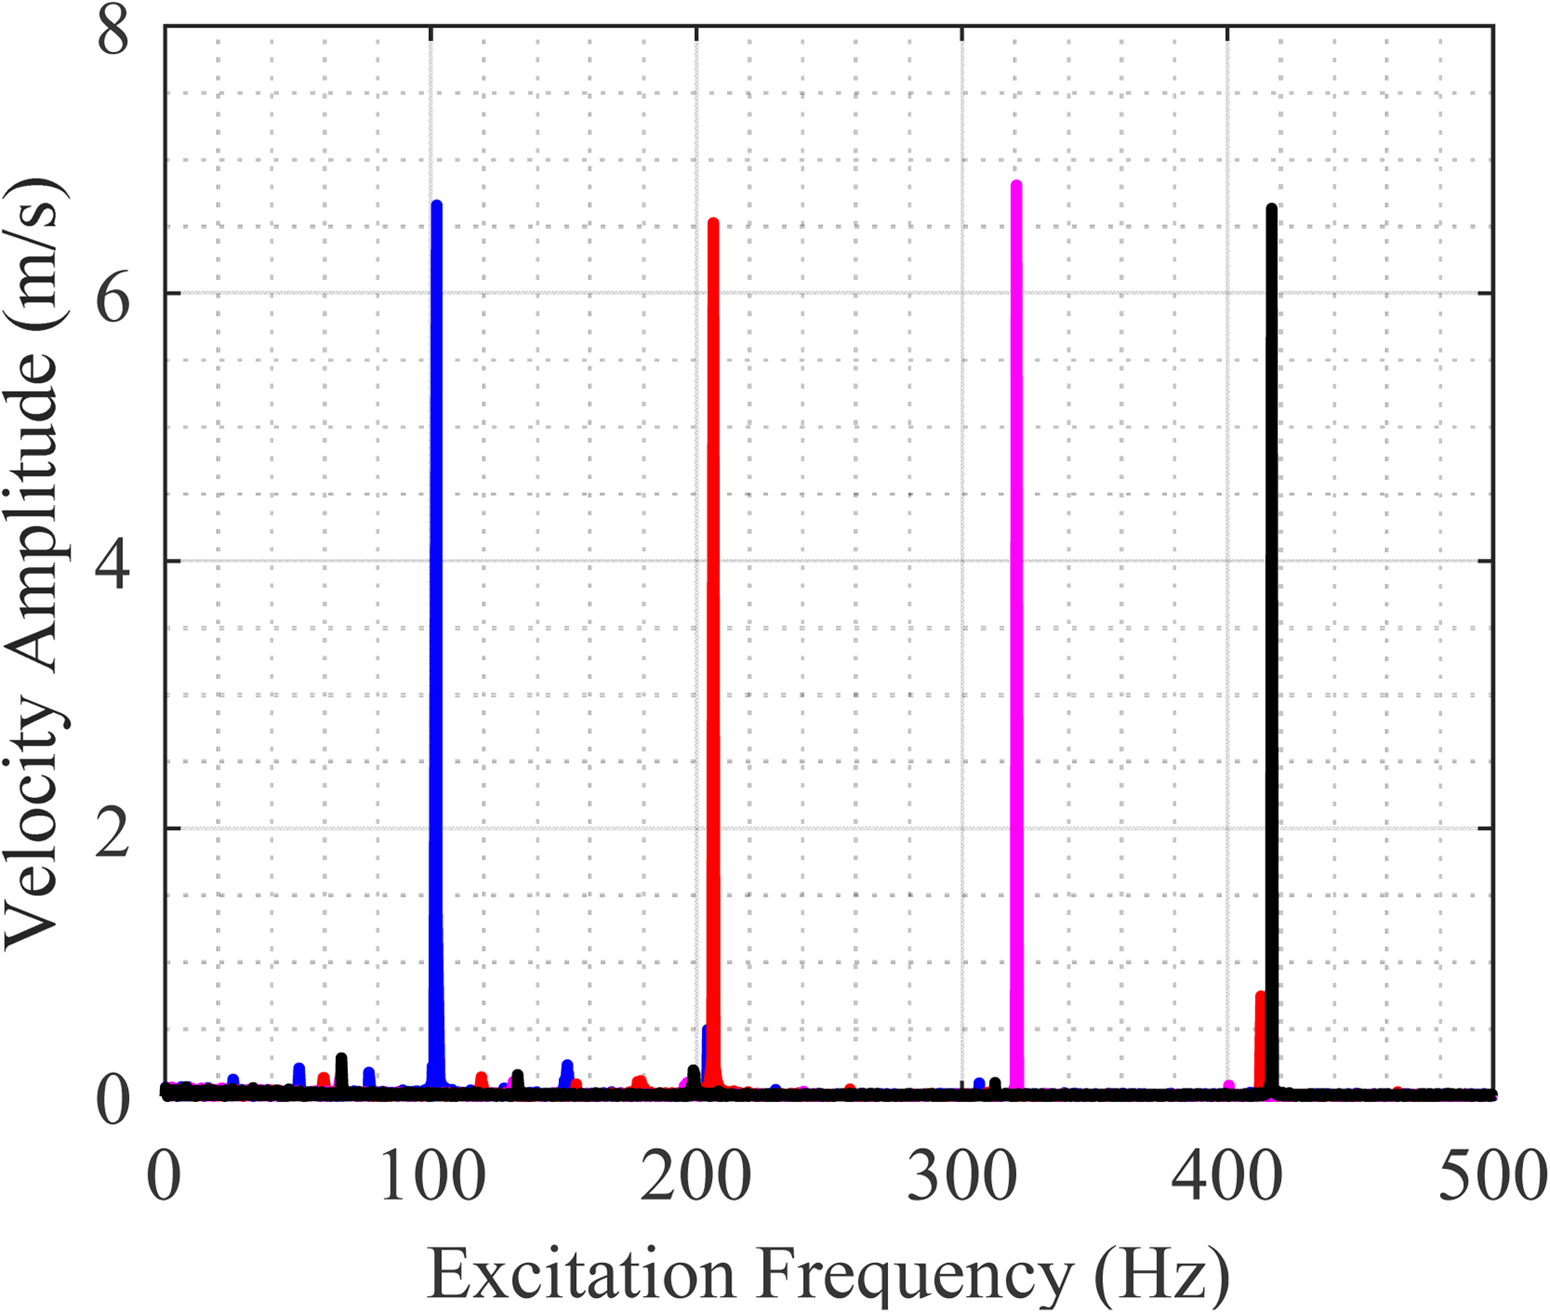
Fast Fourier transform of the air velocity signals under the influence of four excitation frequencies.
The actual velocity signal for these four cases was phase-averaged, in order to identify its periodic behavior. By analyzing the phase-averaged velocity signals depicted in Figure 3, it is already evident that they actually all have a common amplitude and their average value is approximately the same with a deviation of less than 3% from one another. With increasing frequency, a deviation from the ideal sinusoidal shape is observed in the phase-averaged air velocity, which may be caused by the geometry of the pulsating device and the length of the duct in the experimental facility. However, these deviations are minimal and do not affect the procedure.
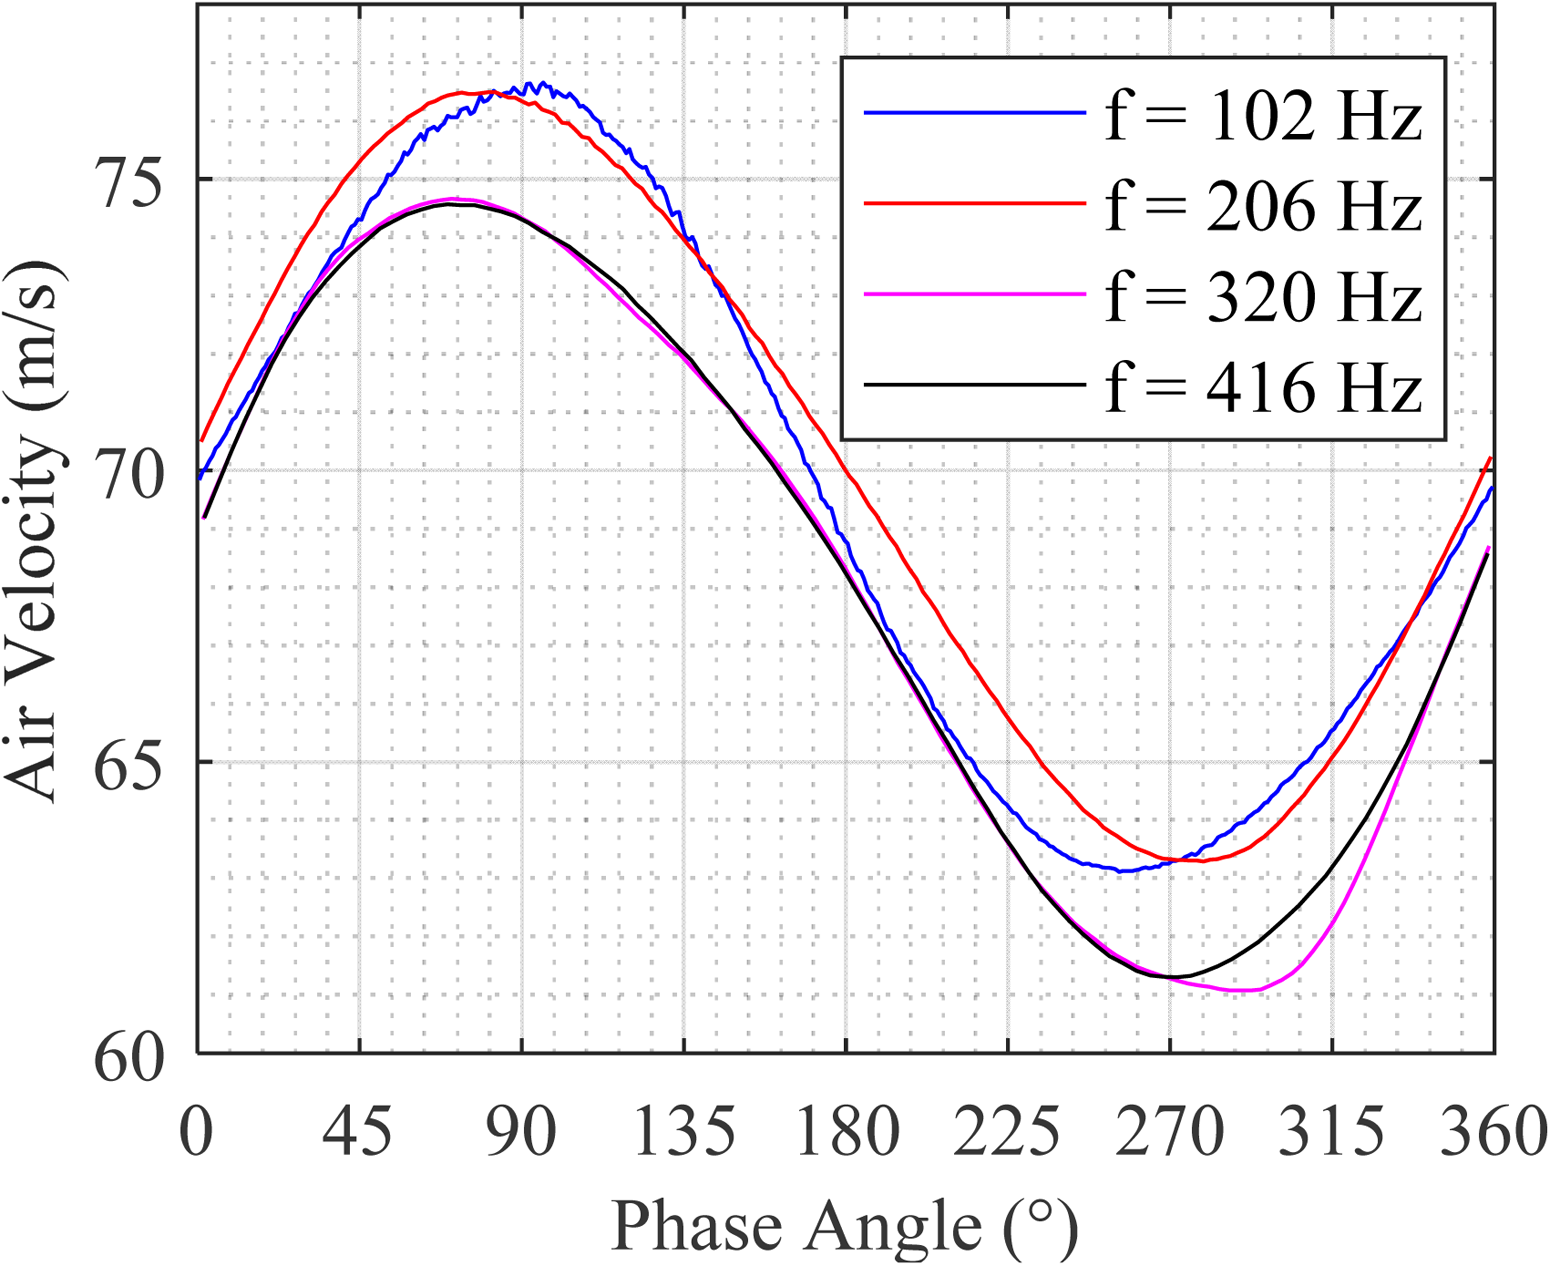
Phase-averaged air velocities under the influence of four excitation frequencies.
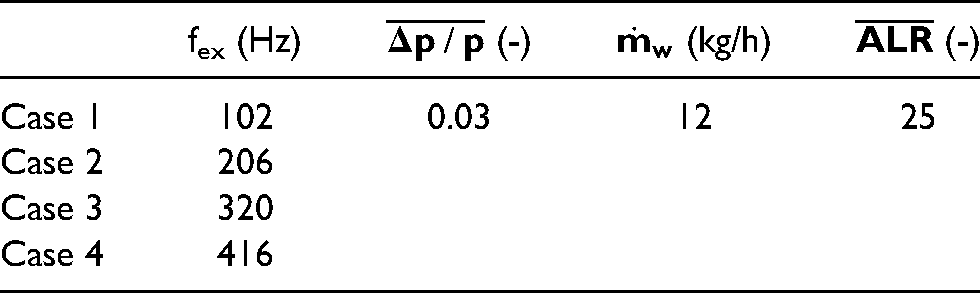
Table 1 shows the operating conditions for the spray tests conducted at the four selected excitation frequencies. In all cases, the average pressure drop across the nozzle was constant, as well as the water flow rate supplied in the system. This resulted in a constant average ALR and thus, since the amplitude of the four cases was similar as shown in Figure 2, the excitation frequency is the only parameter that varies and affects the spray characteristics. From the four cases of Table 1, case 1 is treated as the reference case, since it is common in the investigation of the ALR influence that follows the excitation frequency influence study.
Operating conditions for the excitation frequency variation tests, conducted at X
The phase-averaged mean droplet velocity at the four frequencies studied is then calculated and shown in Figure 4, for the two radial distances investigated in this study. In this graph, as well as in all following graphs where experimental data are presented, a trend line is fit to these data. A two-term Fourier series model was used to fit the data, matching this way their periodic nature 20 . These trend lines serve the purpose of better interpreting the data, especially in the graphs where the trend was not obvious only from the markers. As it was also evident with the air velocity, the shape of the curves is close to the ideal sinusoidal shape in the lowest frequency of 102 Hz, but deviates as the frequency increases. However, this deviation is more pronounced at the velocity of the droplets due to their response on the imposed excitation21,22, and thus only partly due to the non-ideal pulsating device. As the frequency increases, the phase difference from the maximum to the minimum of the oscillation during the period becomes larger. In particular, at the higher frequency of 416 Hz, this phase difference becomes approximately 240°.
Phase-averaged droplet velocity for a variety of excitation frequencies at (a) X
Similar behavior is observed in both Figure 4(a) and Figure 4(b) in terms of the mean velocity trend. As shown in previous studies with similar operating conditions 8 , approximately 5 mm away from the centerline the mean droplet velocity is higher compared to the velocity at X = 0 mm; this is observed in Figure 4 as well for all four excitation frequencies examined.
A valuable characteristic measure of a spray is the SMD, and in this study, its variation in time is of particular interest Figure 5 shows the periodic fluctuation of the SMD of the spray for the four frequencies examined. In all cases, the influence of the air modulation is obvious, since the SMD is not constant in time, as it is in non-forced experiments 7 . The SMD, especially in the lower frequencies, shows an opposite trend to the mean droplet velocity, indicating that when the spray consists of larger droplets, they tend to move faster and vice versa. This was also an expected since it was observed in previous experiments on the same setup, on forced and non-forced experiments 7 .
Phase-averaged SMD for a variety of excitation frequencies at (a) X
In previous experiments on a similar model prefilmer using Shellsol D70 as liquid, it was shown that the SMD tends to remain constant in time for excitation frequencies around 300–500 Hz with an average airflow velocity of 40 m/s6. However, in this investigation where the average air velocity is significantly higher, it is observed that even at 416 Hz the SMD is definitely affected and the oscillation amplitude is similar to the lowest frequency case. The slight drop of the SMD at X = −5 mm in Figure 5(b) compared to Figure 5(a) matches the observed behavior from other studies 7 . In this case, 5 mm away from the centerline in the radial direction X, the SMD is less affected by the high excitation frequencies, leaning towards the observations of Müller from previous studies 6 .
Using the data of the PDA system, it is possible to calculate the mass flux of the spray as explained by Saffman in the algorithm he proposed23,24. The result is shown in Figure 6; the spray mass flux fluctuates periodically even though the water supplied in the atomizer had a constant flow rate. This indicates that the prefilmer accumulates liquid and releases it in waves, even at frequencies of 416 Hz. However, spray mass flux fluctuations can also be created by an oscillating airflow via convection by the mean flow25,26 This is certainly a consideration point when designing and scaling the prefilmers for jet engines’ safety. Specifically in Figure 6(b), the spray mass flux in all cases is lower at X = −5 mm compared to the centerline at X = 0 mm. This was expected since the spray produced by this model prefilmer, as examined in different conditions in previous investigations, 7 is more dense near the centerline.
Phase-averaged spray mass flux for a variety of excitation frequencies at (a) X
Having established how the basic spray properties are affected by the excitation frequency, it is useful to examine the mean droplet velocity in more detail, considering the different size classes. Figure 7(a) shows the size class separation of the mean droplet velocity for the excitation frequency of 102 Hz, at X = 0 mm. Each size class is represented by a single curve in a diagram. As also observed in previous studies, 8 the larger droplets have a smaller average velocity. In addition, a phase shift is visible between the smallest and the largest droplets, which is to be expected since large droplets cannot perfectly follow the rapidly changing flow field due to their inertia and corresponding Stokes number 22 .
Mean droplet velocity of various diameter classes for excitation frequency at X
Comparing this behavior with the corresponding behavior for the excitation frequency of 416 Hz shown in Figure 7(b), a number of outcomes arises. Of course, the same behavior is observed with respect to the average velocity for larger droplets. However, the phase shift between the different size classes is even larger. This is explained by the fact that the velocity of the air changes approximately four times faster in the case of 416 Hz compared to the 102 Hz case. Therefore, the delay of the large droplets is even more pronounced due to their inertia. Moreover, the shape of the droplet velocity curve deviates even more from the sinusoidal shape at higher frequencies, as already observed in Figure 4.
The behavior of the droplet velocity as a function of size class can be numerically validated by using the equation of motion for a single droplet, considering the forces acting on the droplet as it moves: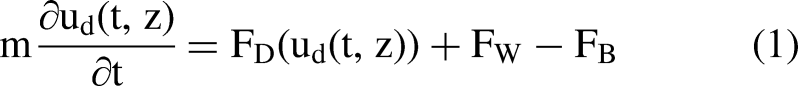
In solving the equation of motion of the droplet, of interest in this context is the velocity of the droplet at the downstream distance of 40 mm, which agrees with the experimentally measured position.
Figure 8(a) shows the numerical solution of equation (2) i.e. the droplet velocity over time as the droplet moves, for two different initial conditions regarding the phase of the air velocity at t = 0 s, for a droplet of a determined diameter. Depending on that initial phase shift of the air velocity, which is shown in dashed lines of red and blue color, the corresponding solution for the droplet velocity is shown in solid lines with the respective colors. The black dots marked on the solution curves denote the instant at which the droplet reaches the Z = 40 mm milestone, which is the location of interest Therefore, solving equation (2) for multiple initial conditions regarding the air velocity phase shift, the droplet velocity at Z = 40 mm as it changes over a period is shown in Figure 8(b). The different lines on this diagram denote the numerical solution for different droplet diameters.
Numerical solution of droplet motion equation at Z
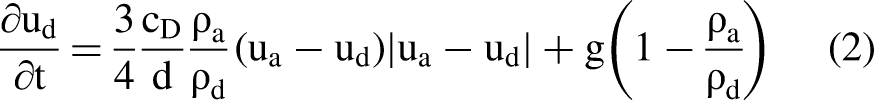
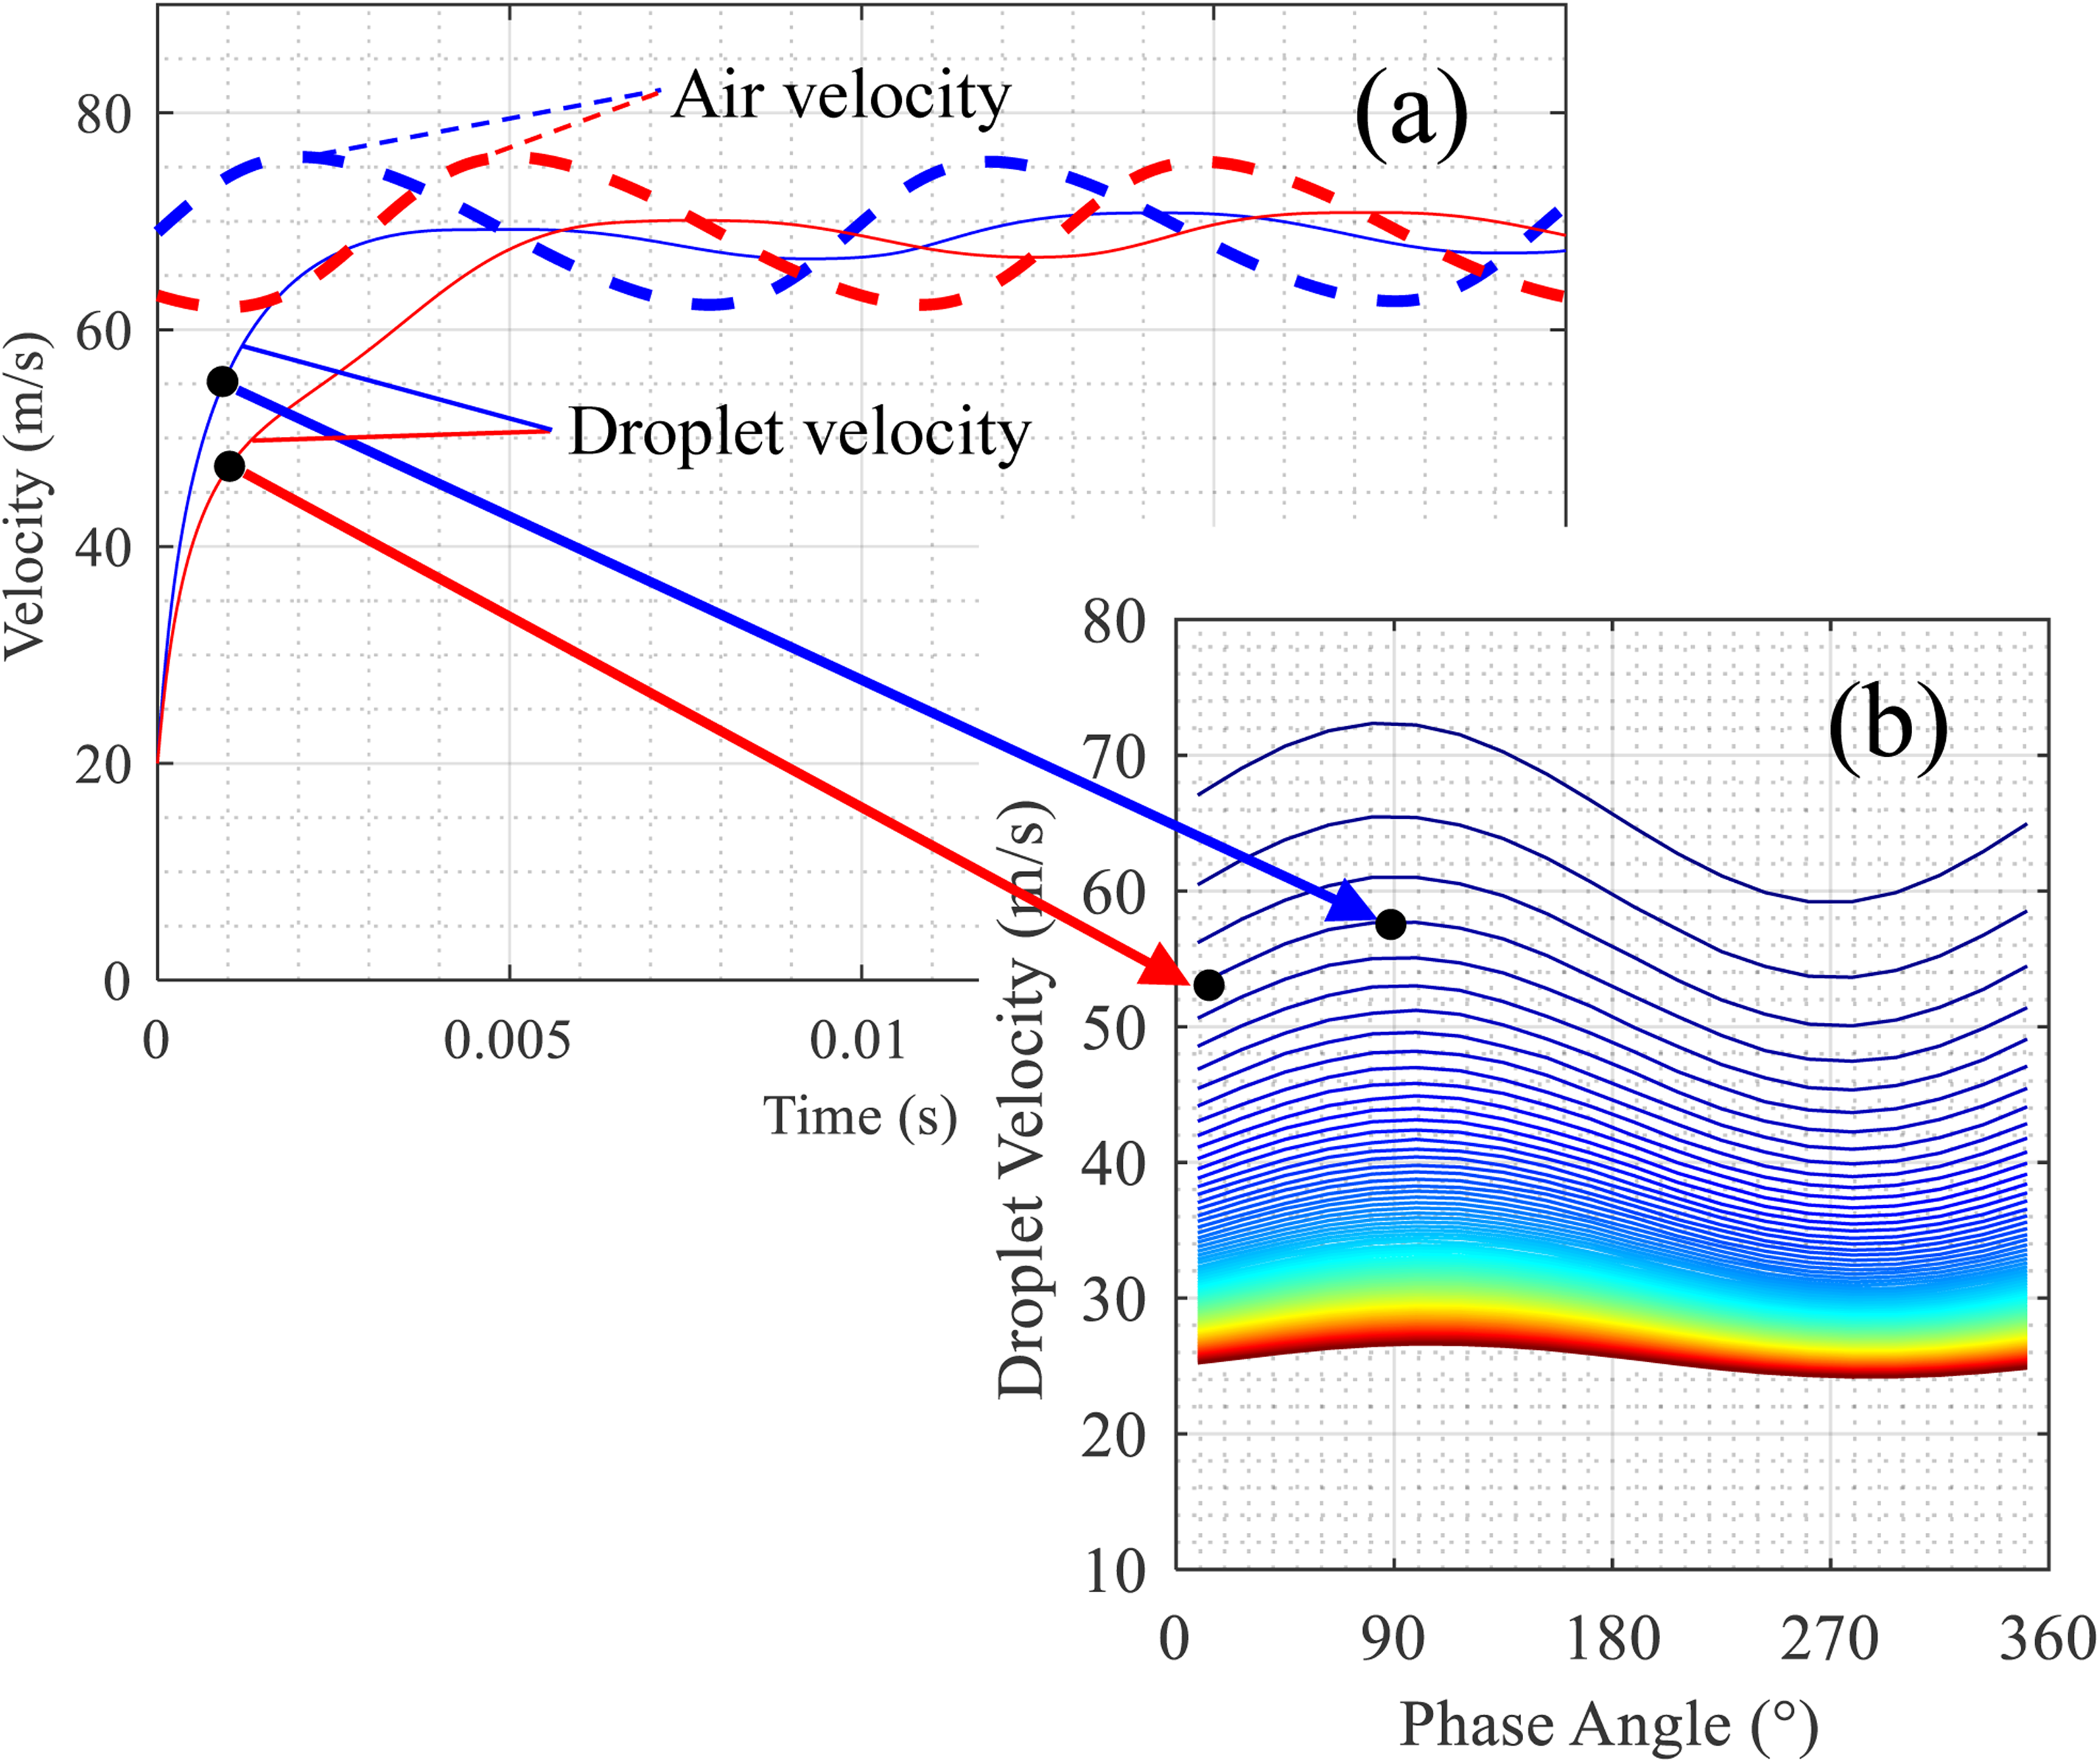
The equation of motion was solved for several droplet diameters from 1 μm to 300 μm and numerous phase angles as an initial condition. The outcome is represented in Figure 9. In the case of 102 Hz in Figure 9(a), the phase shift between the different droplet sizes is definitely present, but rather small, as also observed in the corresponding experimental case.
Numerical solution of droplet motion equation at Z
In contrast, at the highest frequency of 416 Hz, this phase shift is more pronounced. It is worth mentioning that apart from confirming the other results from the experiment regarding the average velocity and the amplitude, the velocity values also agree in most size classes when comparing the numerical with the experimental results.
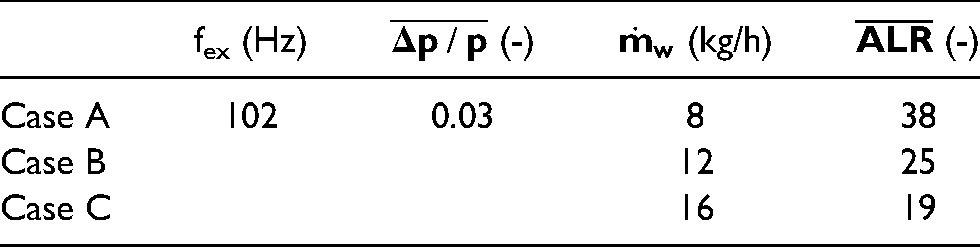
Having analyzed the influence of the excitation frequency on the spray characteristics, the variation of the average global ALR is of interest for a more complete systematic variation. Table 2 shows the operating conditions for the spray tests conducted at the three selected water flow rates. In all three cases, the average pressure drop across the nozzle was constant, as well as the excitation frequency. By increasing the water flow rate from 8 kg/h to 16 kg/h, the average global ALR is reduced by half. These tests were conducted at X = 0 mm for this study; since the spray angle changes with different water flow rates, the analysis at the fixed radial position of X = −5 mm would not provide a fair comparison between the three cases.
Operating conditions for the average ALR variation tests, conducted at X
The phase-averaged droplet velocity at the three different water flow rates studied is shown in Figure 10. With increasing liquid supply, the mean velocity reduces due to the inertia of the droplets, since the average air mass flow rate was constant. This was expected from a macroscopic point of view considering the conservation of momentum, since the air mass flow rate was the same but the liquid mass flow rate was reduced as the ALR increases. To correlate this with equation (2), as shown in the example of Figure 8(a), the droplets are still accelerating when they reach the measurement location of Z = 40 mm. Therefore, considering a larger droplet to compensate with the increased water flow rate in the 1D flow of equation (2), it would always have lower average velocity compared to a smaller droplet. The three cases show a similar phase angle without major differences from the reference case B, indicating that the phase-averaged mean droplet velocity is not delayed due to the variation of the total liquid supply in the atomizer.
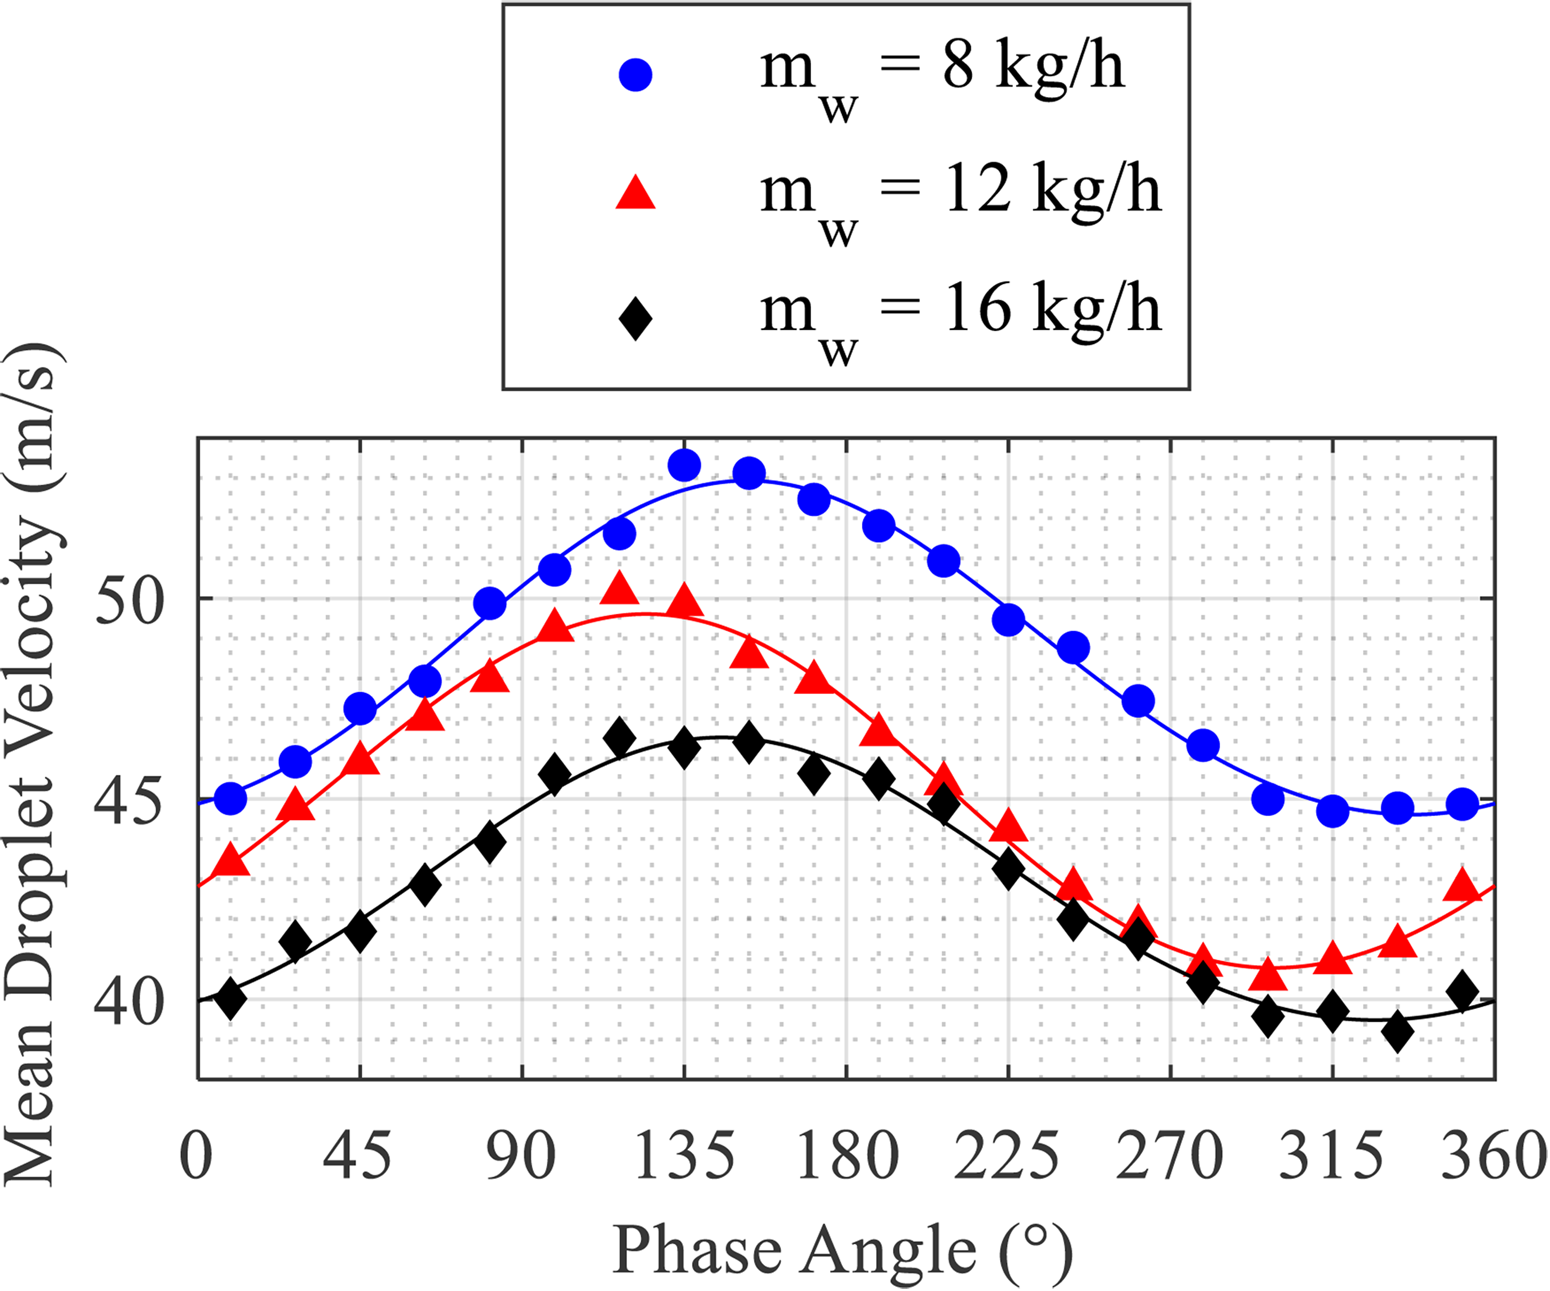
Phase-averaged droplet velocity for a variety of water flow rates.
Figure 11 shows the phase-averaged SMD for the three examined cases with a varying ALR. In all cases, the SMD fluctuates periodically and shows a similar behavior, with a slightly lower oscillation amplitude as the water flow rate increases. However, no significant difference is observed on the average SMD between the three cases. The small increase of the SMD with an increased liquid flow rate at constant air flow pressure was already observed in the literature, where a more significant increase on the SMD occurs with a decreased ALR but under constant liquid flow rate 30 . This may be explained due to the difference in the spray structure and its spatial distribution when the liquid mass flow rate changes substantially.
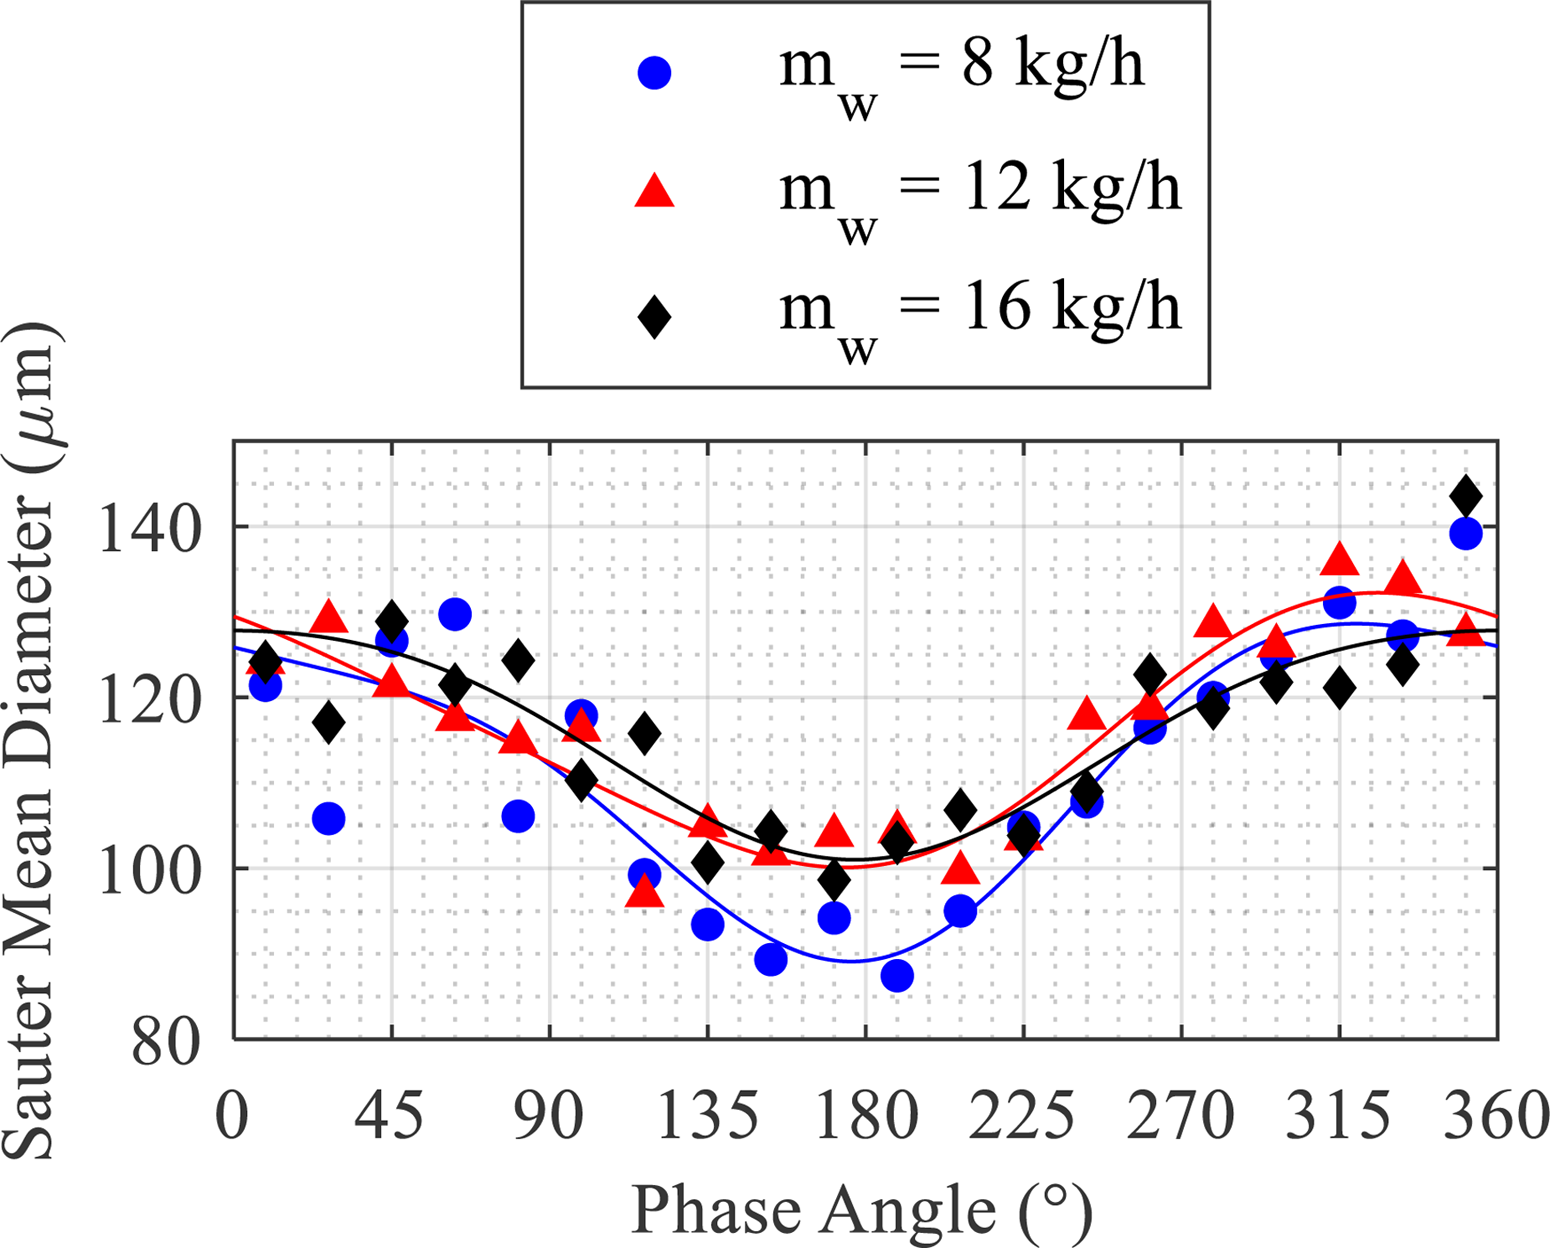
Phase-averaged SMD for a variety of water flow rates.
Finally, the spray mass flux is shown in Figure 12. In all three cases, the resulting mass flux is periodically oscillating based on the excitation frequency imposed, similar to the reference case B of Table 2 or case 1 of Table 1. As expected, with increasing water flow rate, the local mass flux also rises. This increase, however, is not as significant, due to similar reasons explaining the SMD behavior, namely the difference in the spray structure.
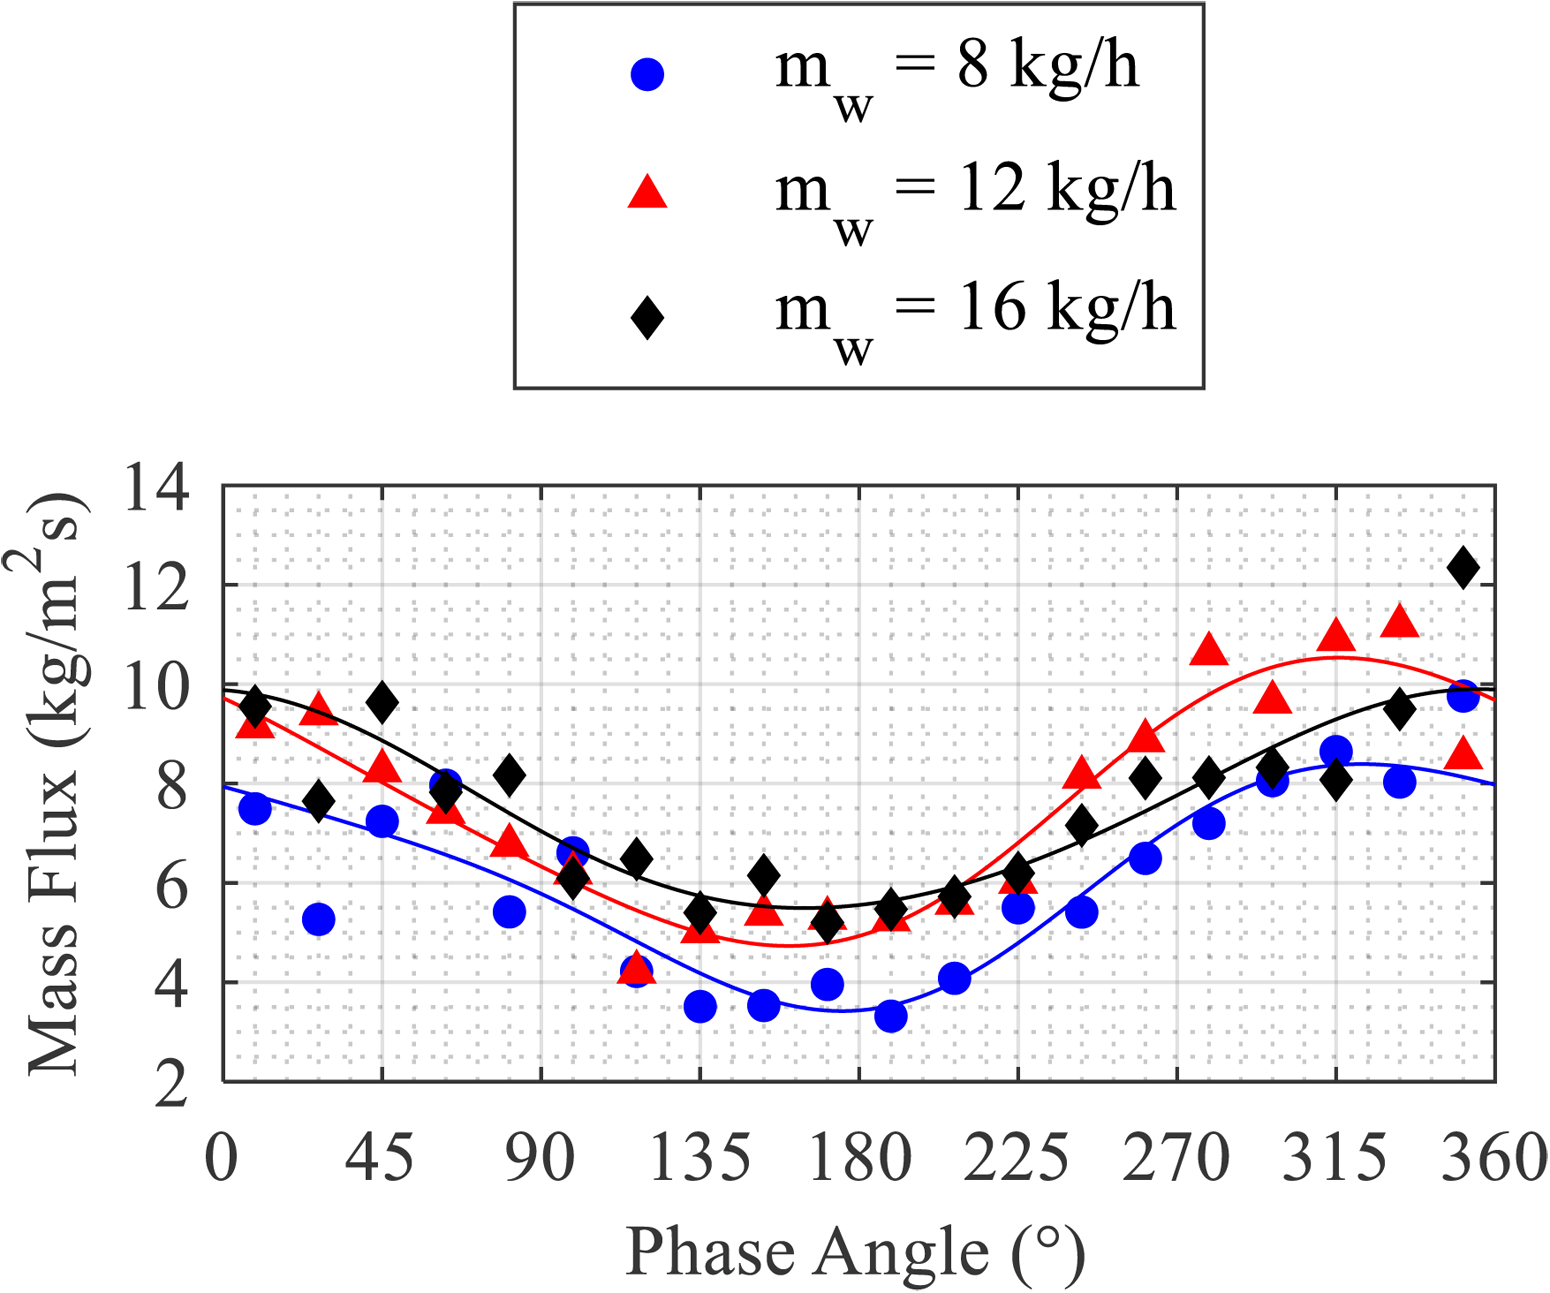
Phase-averaged spray mass flux for a variety of water flow rates.
Summary and conclusions
The spray characteristics of a planar prefilming nozzle were measured under atmospheric conditions using Phase Doppler Anemometry under oscillating flow conditions. A pulsating device introduced oscillations of specific frequencies into the airflow. The flow field oscillation generated by this device was investigated by hot-wire CTA measurements, and the resulting air velocity signal was post-processed using the Fast Fourier Transform, which provided information on the exact oscillation frequency of the velocity and its amplitude.
The forced flow experiment was performed at the excitation frequencies of 102 Hz, 206 Hz, 320 Hz, and 416 Hz, all of which had similar amplitude for the same average flow rate and pressure drop across the nozzle. All measurements for the characterization of the spray took place 40 mm downstream of the prefilmer, at two different radial positions of X = 0 mm and X = −5 mm.
The basic spray characteristics, namely the mean velocity, the SMD, and the mass flux, oscillated periodically according to the excitation frequency of each experiment. The average value and the amplitude of their fluctuation were similar in all cases, regardless of the excitation frequency. This indicated that excitation of constant amplitude does not affect the average or the amplitude of the oscillation on the droplet characteristics in the range of frequencies examined at the center of the spray. However, an influence was observed at the radial distance of 5 mm away from the centerline by varying the excitation frequency.
In order to thoroughly investigate the mean droplet velocity and how it is influenced by the various excitation frequencies, the velocity was divided into size classes similarly to previous studies 8 . In the case of the highest frequency, the delay of the larger droplets compared to the smaller is clear, as expected due to their inertia. To further support this observed behavior, the mean droplet velocity for the different size classes was also numerically calculated. By solving the droplet motion differential equation for different initial conditions and a variety of diameters, a result that matches the experimental observations was obtained.
Finally, the influence of the air-to-liquid ratio on the spray characteristics at the excitation frequency of 102 Hz was investigated. By varying the water mass flow rate supplied in the model atomizer, the phase-averaged mean droplet velocity, SMD, and spray mass flux were measured and the ALR influence on them was shown. These experiments were presented only for X = 0 mm since the spray angle is expected to change when the liquid supply significantly varies.
Summarizing the aforementioned outcomes of this study, it is evident that the spray characteristics, and especially the SMD and the mass flux, oscillate with a relatively high amplitude when the airflow is forced in frequencies of similar amplitude up to approximately 400 Hz. The oscillation amplitude was high in all examined cases of varying excitation frequencies, as well as the cases with varying air-to-liquid ratios.
For better understanding of the phenomenon in the literature, investigations with more parameters are necessary. A comparison with other liquids, in more positions in the radial direction, as well as a variation in the pressure drop at a constant liquid flow rate would provide more insight on the observations of Figure 11 and Figure 12. For even further relevance with realistic jet engine combustor conditions, future spray investigations on a closed chamber under high-pressure air supply would be necessary. Overall, the demand for more experimental data to validate the models that predict the thermoacoustic instabilities remains essential for the further research and development of jet engines for reduced emissions.
Footnotes
Declaration of Conflicting Interests
The author(s) declared no potential conflicts of interest with respect to the research, authorship, and/or publication of this article.
Funding
The author(s) disclosed receipt of the following financial support for the research, authorship, and/or publication of this article. This project has received funding from the European Union’s Horizon 2020 research and innovation programme under the Marie Sklodowska-Curie Agreement 766264 (MAGISTER). In addition, the authors would like to gratefully acknowledge the financial support by the German Research Foundation (DFG) for measuring equipment under HBFG programme INST 121384/178-1 FUGG.