
Abstract
This paper presents the investigation of high-frequency thermoacoustic oscillations and associated flame dynamics in an experimental gas turbine reheat combustor at atmospheric pressure. Examination of dynamic pressure measurements reveals bursts of high-frequency periodic oscillations which appear randomly amidst stochastic fluctuations in the reheat combustor. Analysis of the flame dynamics during these bursts of periodic behaviour reveals that increased heat release in the reactive shear layers of the reheat flame is associated with greater thermoacoustic driving potential. This redistribution of heat release is likely due to the stochastic nature of auto-ignition kernel formation. To determine the underlying flame-acoustic coupling mechanism behind the driving potential, phase-resolved flame dynamics over the acoustic cycle are investigated which reveal the presence of an oscillatory heat release pattern associated with the first transverse eigenmode. An in-phase interaction between the acoustic field and these heat release oscillations in the shear layer regions indicates that this phenomenon likely constitutes a thermoacoustic driving mechanism. This is an important step towards the development of models for high-frequency thermoacoustic driving mechanisms relevant to reheat combustion systems, which will allow accurate prediction and mitigation of thermoacoustic instabilities in future designs.
Introduction
One of the key challenges of modern energy infrastructures is consistently meeting fluctuating power demand with an increasing proportion of energy generated by volatile renewable sources. 1 To address this issue, reliable methods of power generation which can rapidly compensate for supply shortages and changing demand are required. Gas turbines with sequentially-staged combustion systems are a promising technology to fill this role as emissions regulations become increasingly strict. Furthermore, the two-stage combustor arrangement allows improvements on the key characteristics of part-load performance and fuel flexibility. 2 This concept is used in the GE GT24, GE/Ansaldo GT26 3 and Ansaldo GT36 4 gas turbines and is implemented as a premixed first stage followed by a second reheat stage. The second reheat stage is of particular interest as it takes advantage of the high outlet temperatures from the first stage by utilising both auto-ignition and propagation flame stabilisation. Conditions in the first combustion stage are kept roughly constant, with low firing temperatures and lean conditions to minimise emissions, while loading is adjusted by varying the reheat stage fuel input. 2 High efficiency can therefore be achieved even at very low load conditions by only running the first stage combustor with no additional fuel input to the reheat stage.
As is often the case in advanced lean premixed combustion systems, increased susceptibility to thermoacoustic instabilities accompanies improvements in emissions characteristics. 5 These instabilities occur when flame heat release fluctuations constructively interfere with combustor acoustics. The consequences of this coupling are high-amplitude pressure pulsations which increase emissions levels and mechanical fatigue. Typically, experimental studies concerning the self-excited thermoacoustic response are focussed on investigation of limit-cycle behaviour where oscillation frequency and amplitudes remain at approximately constant levels. 6 Recently, however, there has been an increased interest in the transition state between stable and unstable conditions where intermittent thermoacoustic behaviour is observed.6–9 This normally manifests as fluctuating oscillation amplitude and/or frequency in narrow operating condition ranges. The transition state where intermittent thermoacoustic behaviour occurs has not yet been investigated for reheat combustors, in which intermittency could be influenced by the stochastic nature of the autoignition flame. One objective of this investigation is therefore to provide insight into the underlying mechanism which leads to intermittency in reheat flames.
In this work, a distinction between low- and high-frequency thermoacoustic instabilities is made, with some significant differences between these two regimes. Firstly, for low-frequency instabilities, where acoustic pressure fluctuations are roughly constant across the combustion zone, the spatially-integrated heat release of the flame can be used as a measure to quantify acoustic driving. However, this is not the case for high-frequency instabilities where the acoustic mode can vary significantly across the combustion zone. The acoustically non-compact nature of the flame in this regime instead requires consideration of local interactions between the flame and the acoustic field. Secondly, instabilities in the low-frequency regime typically arise due to coupling of the time-delayed flame heat release response with convectively transported equivalence ratio, temperature and velocity oscillations. These convective effects attenuate with increasing frequency and are negligible in the high-frequency regime, 10 where the thermoacoustic feedback is instead dominated by local, in-phase interactions between the flame and the acoustic field. Finally, low-frequency instabilities most often exhibit longitudinal mode shapes, which can be considered essentially one dimensional, while high-frequency instabilities typically have more complex, three-dimensional mode shapes.
Thermoacoustics research for gas turbine applications has typically focussed on the low-frequency regime. This is also true for reheat combustors, with a number of studies investigating their low-frequency thermoacoustic characteristics.11–14 In recent years high-frequency instabilities have been recognised as a major challenge in the design of modern, low-emissions engines. A particularly relevant example is the recent work on high-frequency thermoacoustic instabilities in the reheat combustor of the aforementioned GT24/26 gas turbines.15,16 In this case, a redesigned front panel of the reheat combustor featuring built-in passive acoustic dampers was required to eliminate the limits imposed on operational flexibility by the instabilities. This example highlights the need for effective countermeasures for the high-frequency regime and for accurate methods for prediction of thermoacoustic instabilities to avoid their occurrence from early on in the design process. The latter in particular requires a strong understanding of the flame-acoustic interactions, or driving mechanisms, which give rise to high-amplitude thermoacoustically-induced pressure pulsations in order to develop robust predictive models.
The presence of both auto-ignition and propagation flame stabilisation in reheat combustors presents a significant challenge for the prediction of thermoacoustic instabilities, as distinct coupling mechanisms could arise from each stabilisation mechanism. It is assumed that the net thermoacoustic driving potential of reheat flames is likely a superposition of several mechanisms. The first step towards modelling these interactions is the identification of each of the individual sources of thermoacoustic driving. Previous work at the author’s institute on high-frequency thermoacoustic instabilities provides a strong foundation for this task. Initial experimental studies concerning high-frequency flame-acoustic feedback mechanisms in swirl-stabilised flames identified a periodic displacement of the flame by the acoustic velocity field as a source of thermoacoustic driving.17,18 This was followed by the subsequent determination of a second driving mechanism associated with flame deformation induced by the flame displacement. 19 In following studies, superposed analytical expressions for these driving mechanisms have been derived and validated against measured heat release oscillation fields20,21 which are also expected to be relevant for reheat flames. 19 Furthermore, a recent experimental study has indicated that modulation of the pressure sensitive auto-ignition delay time by acoustic oscillations also contributes to thermoacoustic driving in reheat combustors. 22 In addition to the initial observation of flame displacement by the acoustic velocity field, Schwing et al 23 also observed rotating transverse patterns associated with periodic, acoustically-induced vortex shedding associated with high-frequency transverse instabilities. Later studies found that in the case of swirl-stabilised flames, strong flame quenching in the shear layers resulted in very low levels of heat release fluctuations, 24 and the net effect of the vortex shedding contributed mainly to acoustic damping. 25 However, in the case of reheat flames, it is assumed that quenching in the shear layers is negligible, allowing the possibility that modulation of the reactive shear layers by shed vortices could represent a source of thermoacoustic driving potential.
This paper presents the observation of high-frequency thermoacoustic oscillations in an experimental gas turbine reheat combustor. Self-excited bursts of periodic pressure behaviour at elevated amplitudes occur irregularly amidst the stochastic combustion noise across a wide range of operating conditions. The objectives of this paper are to provide insight into the underlying cause of these bursts of high-frequency oscillations and to investigate the flame-acoustic coupling mechanism which drives the thermoacoustic instability. This supports the larger goal of increasing the understanding of high-frequency thermoacoustic driving mechanisms in reheat flames to allow the development of accurate predictive approaches for thermoacoustic mitigation.
Experimental Setup and Diagnostics
Experimental Setup
The experimental results presented in this paper have been obtained at atmospheric pressure from the reheat stage of a sequentially-staged combustor test rig. The two-stage setup consists of a vitiator followed by the secondary reheat combustor, imitating the combustion system of the Ansaldo GT26 2 and GT36 4 gas turbines. Design and commissioning of the test rig is described in detail by Berger et al. 26 with further details on its numerical design provided by Romero et al. 27 .
A schematic of the reheat combustor stage is provided in Figure 1. The hot-gas mixture from the vitiator (out-of-view to the left of the xy-plane image) enters the mixing section through an orifice which reduces the acoustic coupling between the two combustion stages. The mixing section features four delta-wing shaped vortex generators, which improve mixing quality and combustion chamber flow characteristics, followed immediately by secondary fuel injection in a jet in cross-flow configuration. A natural gas/propane blend is used to increase auto-ignition propensity at atmospheric conditions. The fuel-air mixture then passes through a convergent-divergent section and into the reheat combustion chamber through a diffuser-shaped outlet. The area jump from the mixing section to the combustion chamber of
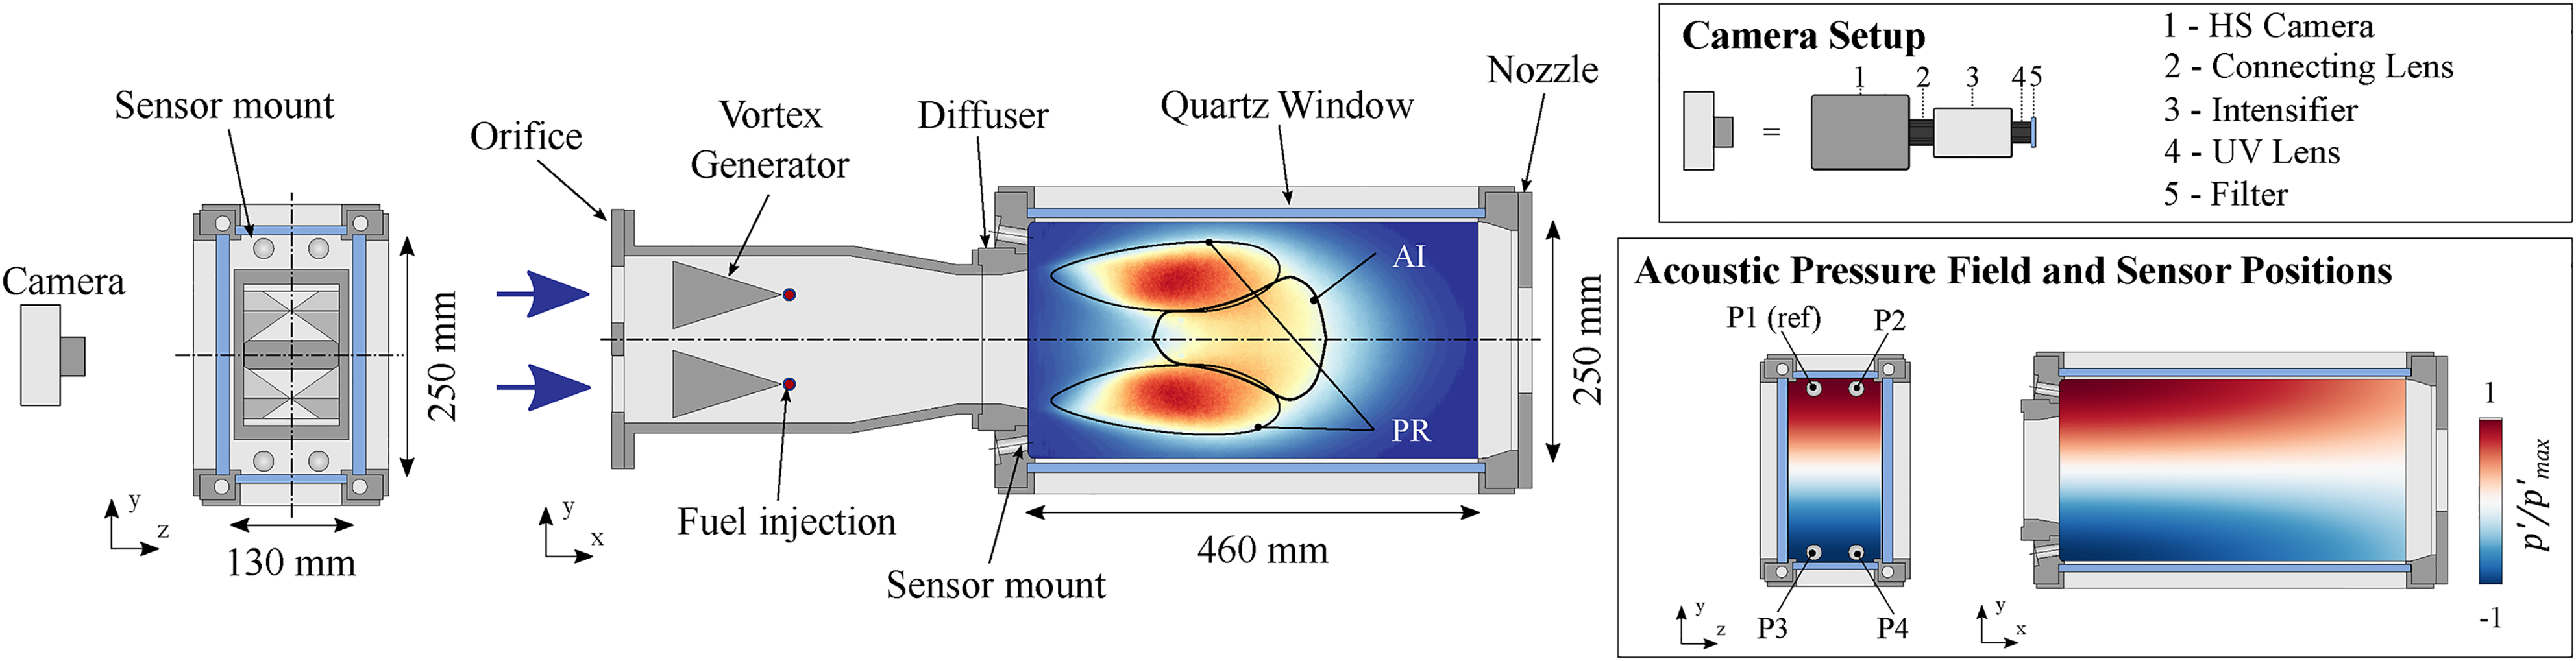
Reheat combustor setup. Flame regions containing mainly auto-ignition (AI) and propagation (PR) stabilisation are indicated. The acoustic pressure field of the first transverse mode is also shown.
The reheat combustion chamber is of rectangular cross-section with dimensions selected as non-integer multiples to avoid overlap of higher harmonics between orthogonal modes. The quasi two-dimensional design is chosen for two main reasons: suppression of rotating acoustic modes and simplification of optical diagnostics. As the geometry only induces recirculation in the upper and lower portions of the combustion chamber, distinct flame stabilisation regions are promoted which are indicated in Figure 1. Flame stabilisation in the homogeneous core flow is dominated by auto-ignition while the shear layers in the upper and lower regions are mostly stabilised by propagation, although it should be noted that auto-ignition activity is still present in these zones. 26 Longitudinal modes are suppressed by two components: Firstly, the orifice increases damping of longitudinal modes due to the reduced cross-section at the mixing section inlet and conversion of acoustic energy to vorticity, 28 while transverse modes are unaffected due to the aforementioned upstream attenuation. Secondly, a nozzle increases convective damping at the combustor outlet. Transverse modes are unaffected as the temperature, and sonic velocity, increase along the combustion chamber length, producing a downstream attenuation of these modes which can be seen in Figure 1.
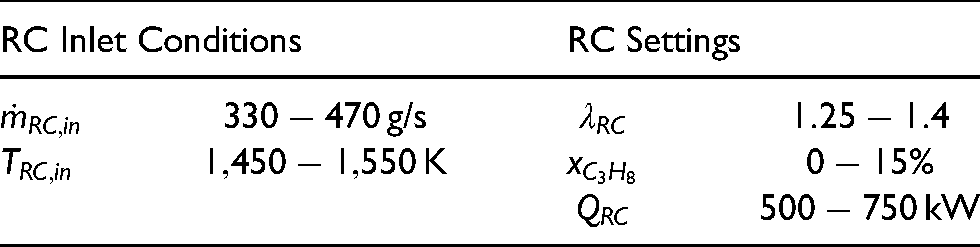
Operating conditions are varied in terms of the parameters shown in Table 1. These conditions most significantly differ in thermal power level, which is mainly dependent on the inlet mass flow,
Investigated range of mean reheat combustor operating conditions.
The behaviours observed in this investigation occur consistently across the operation range of the experiments.
1
Where results are presented from a single operating point for the sake of clarity, the corresponding conditions are as follows; inlet mass flows and temperatures of
Diagnostics
Acoustic pressure pulsations in the reheat combustion chamber are measured by dynamic pressure sensors mounted at the combustor faceplate (see Figure 1). This axial position is selected for acoustic measurements due to its proximity to the location of maximum transverse pressure oscillation amplitude. Water-cooled installation ports, fitted with piezoelectric pulsation probes, are distributed symmetrically around the y- and z-axes to characterise the oscillating pressure field in either orthogonal transverse direction. The simulated acoustic field of the first transverse mode in the y-direction, including the distribution of pressure measurement positions, is shown in the lower part of Figure 1. This acoustic field is obtained by solving the Helmholtz equation via FEM with an artificial temperature field to represent the downstream attenuation of the transverse mode.
27
Dynamic pressures are simultaneously sampled for all four sensors at a rate of
Simultaneously with the dynamic pressure measurements, line-of-sight CH* chemiluminescence (CL) imaging of the reheat flame is recorded using an intensified high-speed camera. The camera is equipped with a
To allow for the advanced image processing techniques described in the subsequent section, logical trigger signals for the camera record sequence and intensifier gating are also recorded synchronously with the dynamic pressure, which provides a precise time stamp for each image. The quasi two-dimensional design significantly simplifies postprocessing of optical measurements, as flame properties remain mostly constant across the relatively short width (z-extent) of the combustion chamber. It should be noted that as the reheat combustor operates under technically premixed conditions, CL measurements are only used as a qualitative indication of the spatial heat release distribution.
Postprocessing and Analysis Methods
Postprocessing of Dynamic Pressure Signals and Identification of Mode Orientation
The acoustic response of the reheat combustor is characterised using the highly temporally-resolved pressure signals measured by the four pulsation probes at the faceplate of the reheat combustion chamber. First, inspection of the amplitude spectra allows identification of the modal frequency of interest. A bandpass filter is then applied about the identified frequency peak as illustrated in Figure 2, with the bandpass filter limits indicated by the dashed vertical lines. The passband is symmetric about the peak frequency and the limits are selected based on the spectral distribution of this peak to filter out content from all other frequencies. In the case of the 
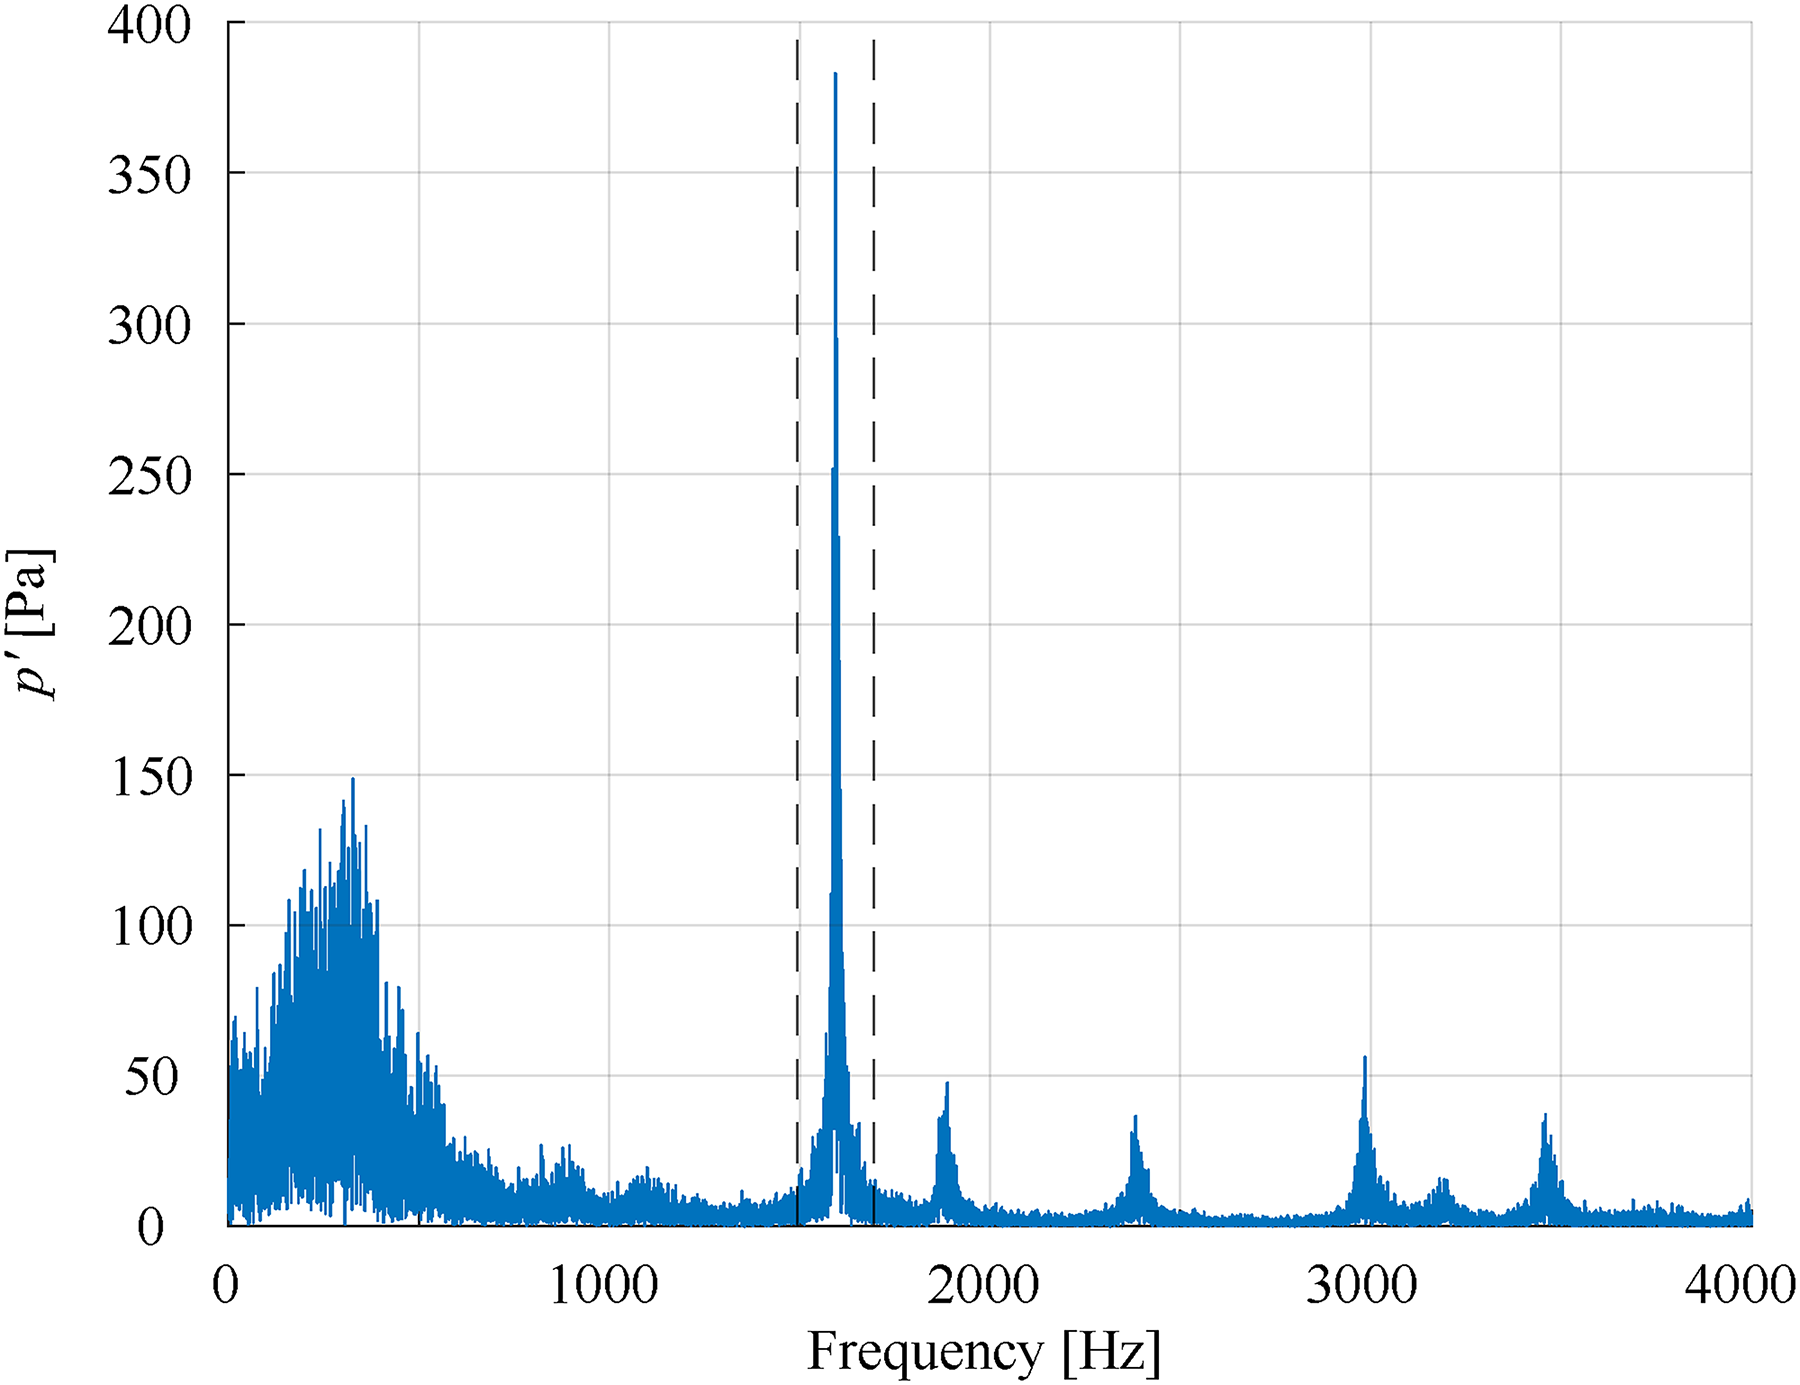
Amplitude spectrum with bandpass filter limits for Hilbert transform indicated by dashed lines.
Where 
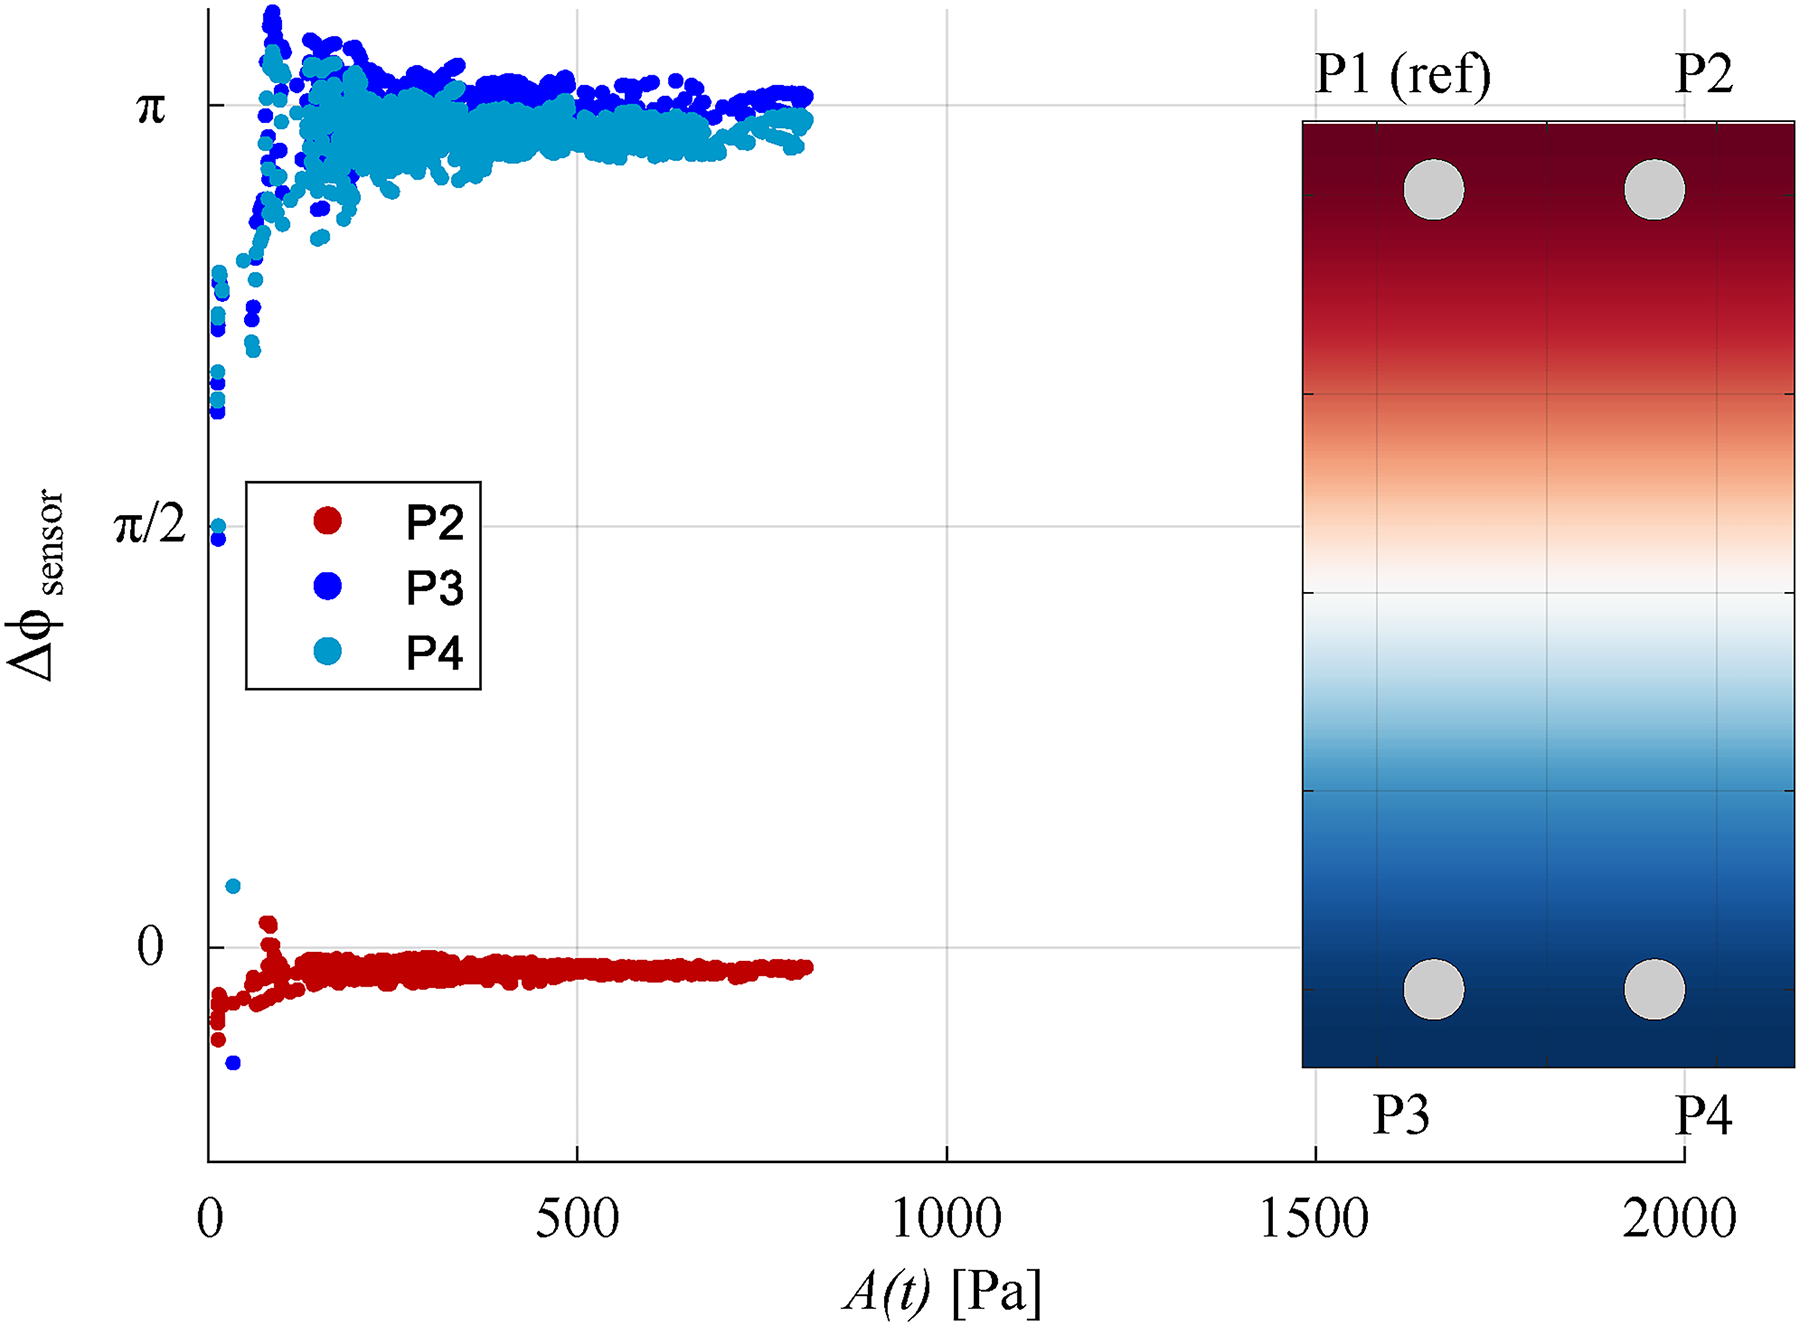
Phase difference of each pulsation probe relative to the reference sensor plotted against the pulsation amplitude.
Condition- and Phase-Locking of Pressure and Heat Release Measurements
To investigate conditions which lead to the intermittent bursts of periodic pressure pulsations, flame dynamics associated with growth and decay of these bursts are investigated. From inspection of the pressure signal, four distinct conditions are defined which describe the temporal evolution of the bursts. To determine differences in flame dynamics during each condition, condition-locking of the CL images is performed. In this approach, illustrated in Figure 4, the key parameter used for identifying intermittency conditions is the pressure amplitude. In particular, the gradient of the envelope amplitude over time is of interest. The envelope is first smoothed by a locally weighted linear regression, which removes most of the small-scale peaks not significant for condition identification. The effect of this smoothing can be seen in Figure 4 by comparing the dashed line with the amplitude of the blue bandpass-filtered pressure signal. Condition definitions are based on peak, trough and zero gradient positions. Minimum thresholds are applied in terms of the prominence and separation of peaks in the gradient to ensure only significant characteristics of pressure time signal are considered for condition identification. An example of the identification of each condition from the envelope amplitude is shown by the markers in Figure 4. In some cases, manual refinement of the identified positions is required, such as for the failure to identify the significant decrease of growth at
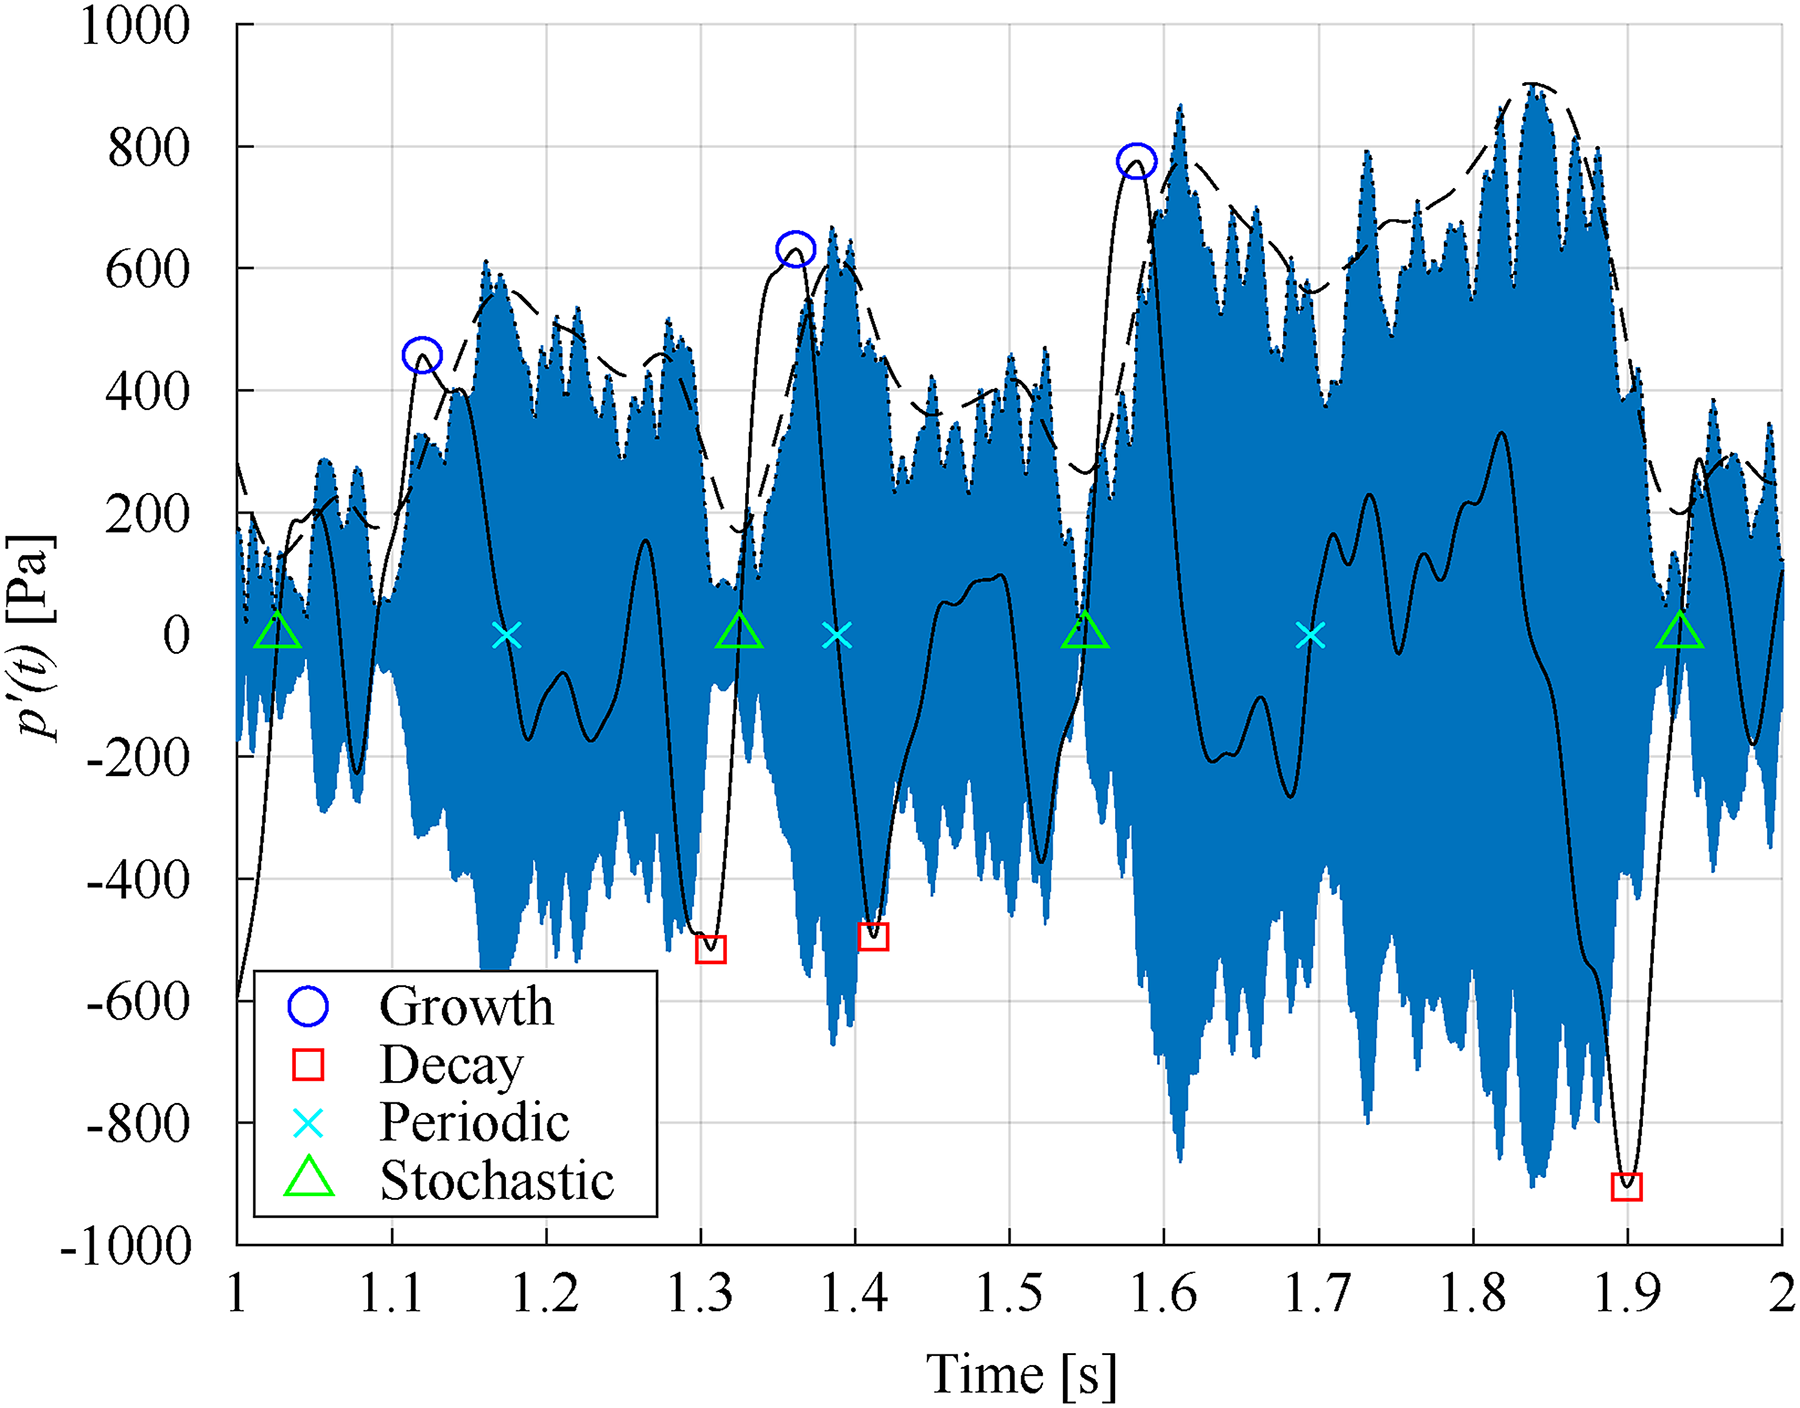
Example of the intermittency condition identification procedure. The dashed line indicates the smoothed envelope amplitude while the solid line indicates its gradient. The markers show identified centres for different condition regions.
Finally, phase-resolved heat release fields are evaluated from phase-locked ensemble-averaged images. In a similar approach to the condition-locking procedure, the phase-locked ensemble averages are calculated by grouping CL images based on the corresponding value of the instantaneous phase from the bandpass-filtered pressure signal. Twelve phase bins are defined in this work. All images in each phase bin are used for the calculation of phase dependant ensemble-averaged images. Further details on this procedure can be found in Refs.30,20
Results and Discussion
Observation of Intermittent Thermoacoustic Behaviour
The presence of intermittent thermoacoustic behaviour in the reheat combustor is first identified by analysis of the pressure time series data from the four dynamic pressure sensors mounted at the combustion chamber faceplate. The pressure signal, bandpass-filtered about the frequency of the T1y mode, is shown in the upper part of Figure 5 and the corresponding amplitude spectrum is shown in Figure 2. Inspection of Figure 5 reveals irregularly occurring bursts of significantly higher envelope amplitudes surrounded by periods of low amplitudes. This can be seen more clearly in the spectrogram in the lower part of Figure 5, which shows the time-dependent frequency content in the filtered pressure signal and was calculated using a window size of 1000 samples (
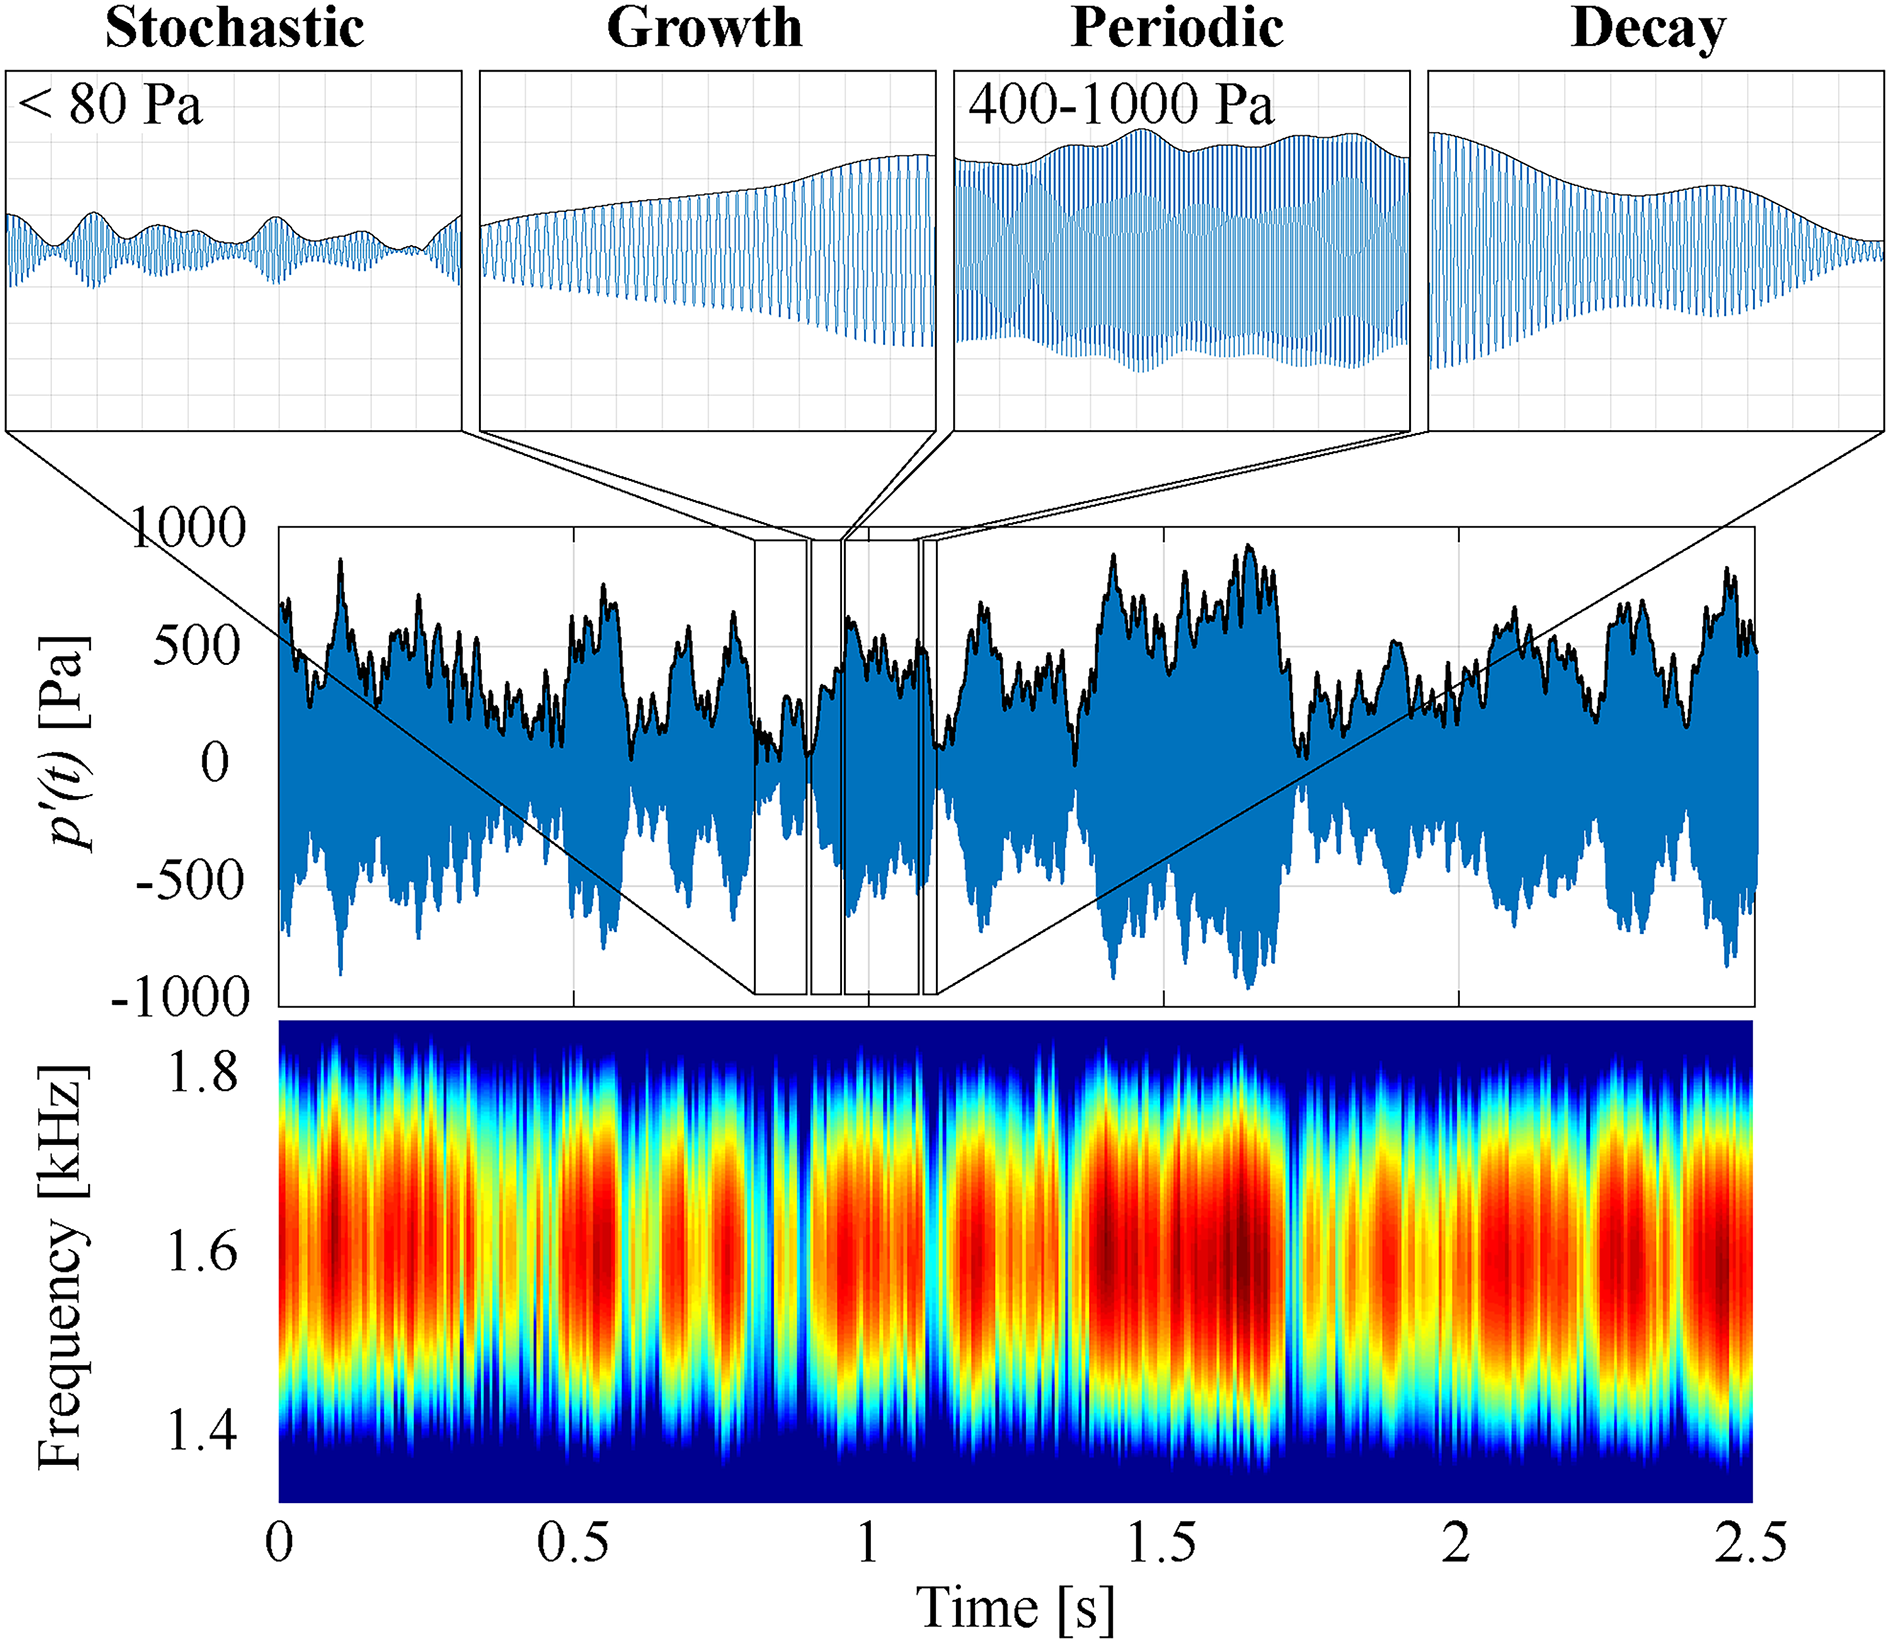
Bandpass-filtered pressure signal and corresponding spectrogram illustrating the intermittent bursts of periodic behaviour and the four defined intermittency conditions. Upper limits of pulsation amplitudes for stochastic and periodic conditions are included.
These four conditions are used in the subsequent section to investigate which flame behaviours lead to the occurrence of the bursts of periodic high-amplitude oscillations.
Flame Dynamics Associated with Intermittent High-Amplitude Pressure Oscillations
To determine the flame response during each intermittency condition, condition-dependent flame dynamics are investigated based on high-speed CL imaging. The upper row of Figure 6 shows ensemble-averaged mean CL images for the four intermittency conditions, while the lower row shows the difference between each of the upper images and the overall mean image, i.e. During stochastic pressure fluctuations, a greater portion of the heat release is located in the auto-ignition stabilised core Growth of pressure pulsation amplitudes is accompanied by a shift of the heat release distribution towards the propagation stabilised shear layers Once pressure oscillation amplitudes have reached their peak, heat release in the shear layers is also at its maximum Decreasing pressure amplitudes during the decay condition coincide with greatly reduced heat release in the shear layers, and a shift of maximum local heat release to the core
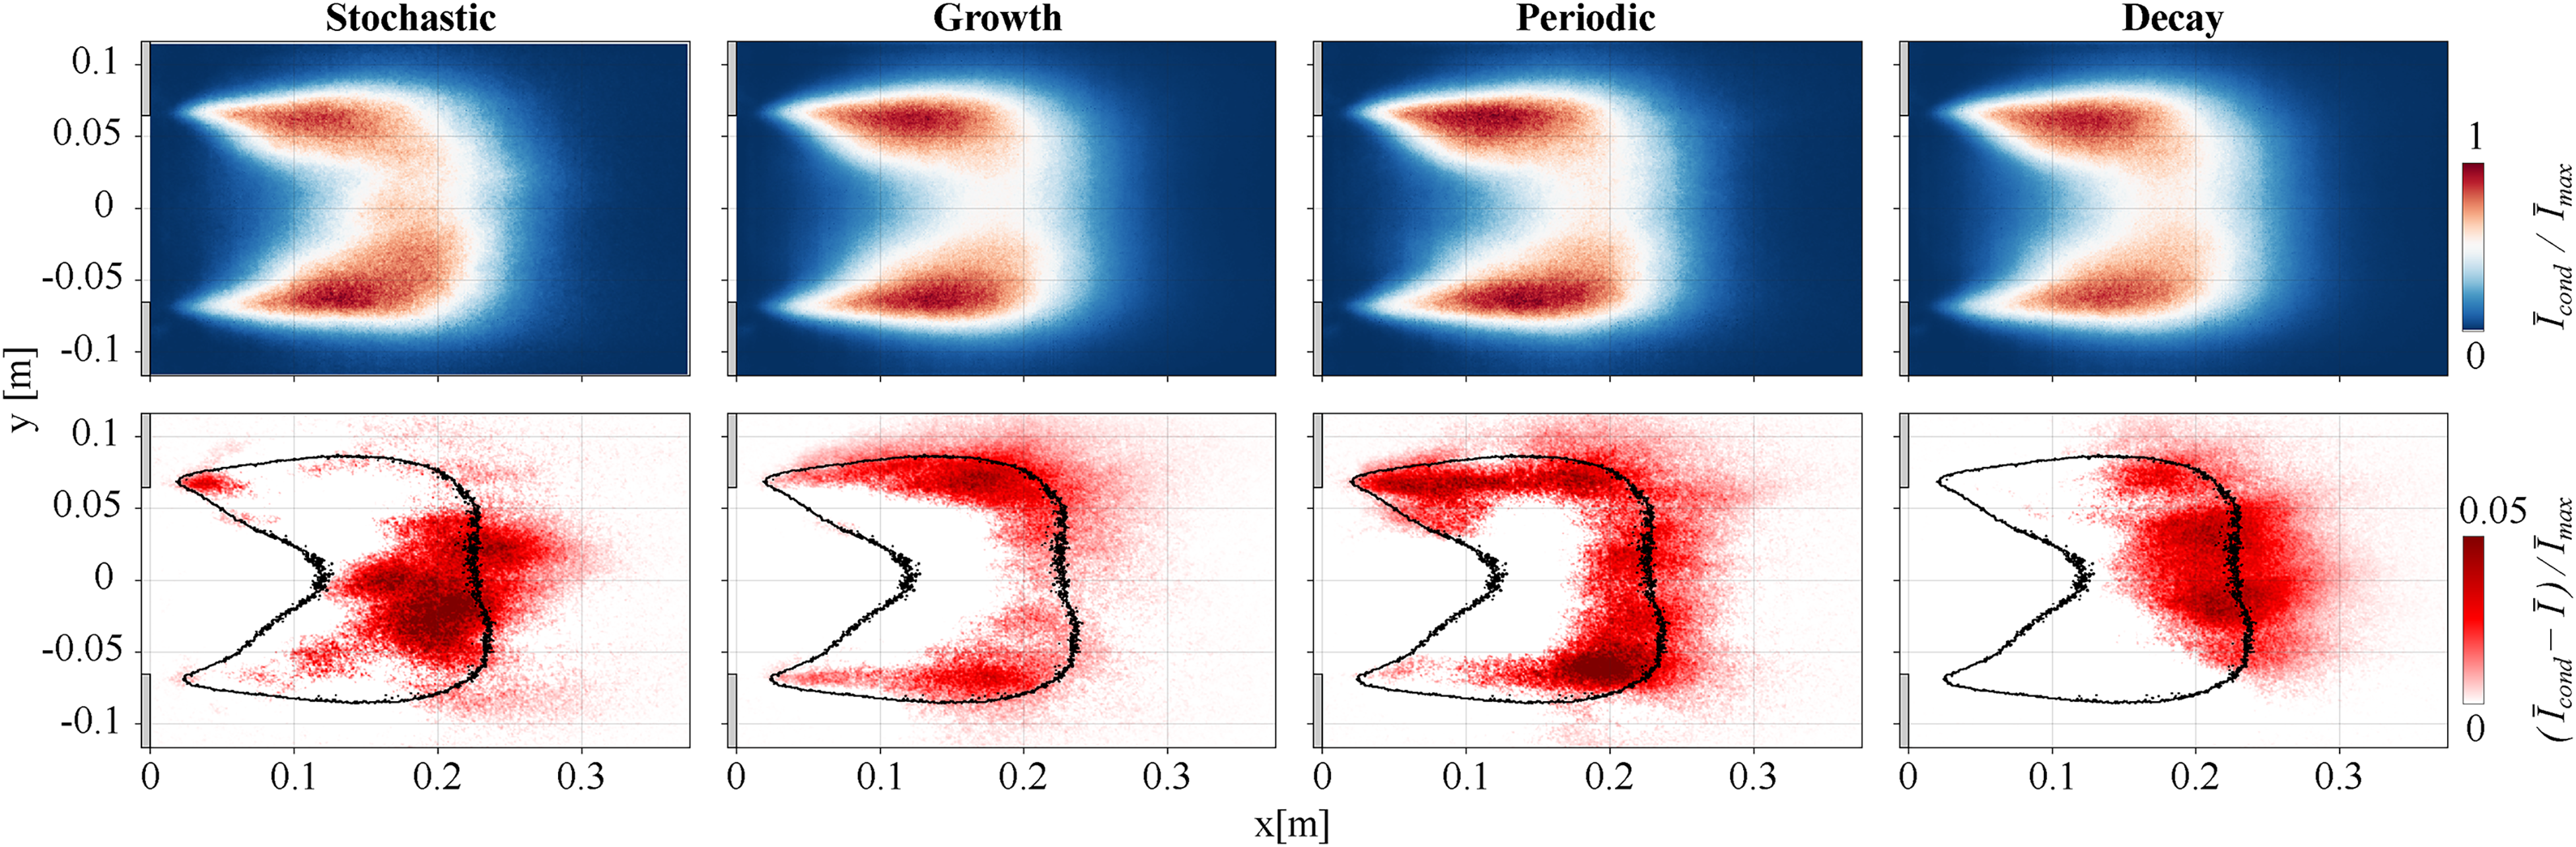
Condition-locked, ensemble-averaged CL images during each intermittency condition. Upper: mean images for a test at representative operating conditions. Lower: difference in CL intensity between the upper images and the overall mean image. The black contour represents the approximate flame boundary of the overall mean image for reference.
In each case, the difference images in the lower row indicates that the shift in CL intensity is of the order of
By comparing these effects with the transverse acoustic field of the T1y mode in the reheat combustor (see Figure 1), the link between the observed flame response and the different intermittency conditions can be described. As high-frequency thermoacoustic oscillations are driven by local interactions of the flame with the oscillating acoustic field, flame-acoustic interactions in regions where pulsation amplitudes are high represent significantly greater driving potential than in regions with small acoustic oscillations. In the case of the T1y mode, a pressure node exists at the horizontal centreline of the reheat combustor, while pressure antinodes are located at the upper and lower walls. Therefore, thermoacoustic driving would be strengthened during the growth and periodic intermittency conditions where there is more heat release towards the antinodes, while the shift of heat release towards the pressure node during decay and stochastic conditions would produce considerably less driving. Based on these observations, it is hypothesised that the intermittent behaviour is a result of a shift of the heat release distribution towards, and subsequently away from, areas of greater thermoacoustic driving potential. This produces the periods of growth, in which the increased thermoacoustic driving overcomes acoustic dissipation, and then decay once driving decreases and acoustic dissipation once again dominates. Additionally, the flame position relative to the acoustic mode may also partly explain why the transition to limit-cycle behaviour does not occur. Due to the regions without combustion in the upper and lower chamber extents, where flame-acoustic interactions would be strongest, T1y pressure oscillations cannot exceed moderate pulsation amplitudes and the transition to limit-cycle oscillations does not occur. The potential for feedback between the acoustic mode and the auto-ignition flame, which is also expected to contribute to thermoacoustic driving in reheat combustors, 22 is also limited due to small pressure pulsation amplitudes in the auto-ignition stabilised core region.
Underlying Flame Modulation Phenomenon
To identify the coupling mechanism behind the thermoacoustic driving, the spatially-distributed heat release is investigated in terms of phase-resolved CL intensity fields. In this case, the intermittency condition is not considered in the ensemble-averaging process to allow the maximum number of images in each phase interval. The upper row of Figure 7 shows a series of ensemble-averaged images from different phase intervals of the pressure oscillation cycle, while the lower row shows the corresponding difference images calculated analogously to the those shown in Figure 6 (
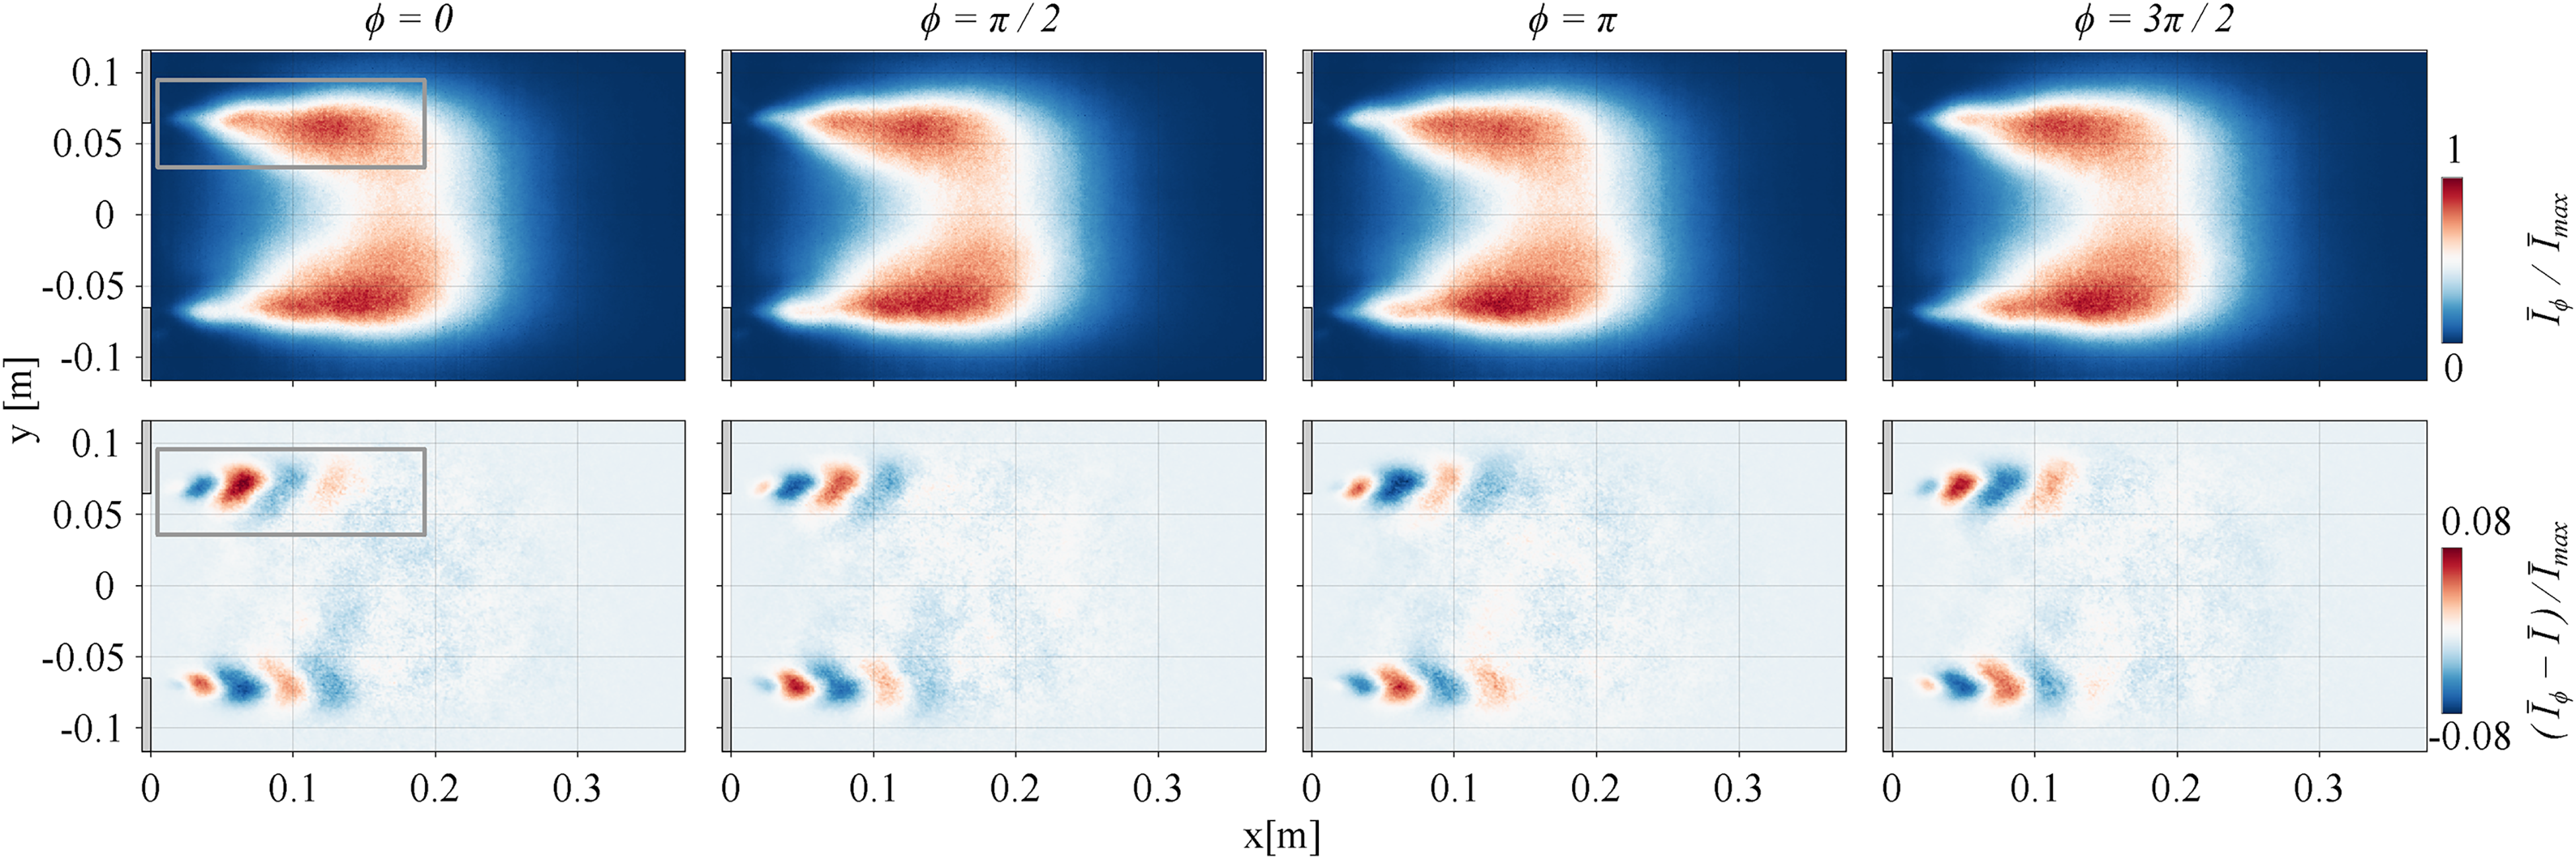
Phase-locked ensemble-averaged CL images of the flame for sample phase intervals (upper) and the corresponding difference images (lower). The grey box in the leftmost images indicates the location of the upper shear layer region.
A distinct modulation of the upper and lower shear layers can be observed from the mean images. This is consistent with previous numerical investigations of high-frequency thermoacoustic sources in reheat combustors, 19 in which acoustically-induced vortex shedding caused the shear layer modulation. Similar vortex shedding has been observed in experimental investigations of swirl-stabilised flames but did not produce a significant modulation of the heat release due to flame quenching associated with high local stretch rates23,24 and consequentially this phenomenon only contributed to acoustic damping. 25 It is possible that the modulation could be a result of equivalence ratio fluctuations induced by the oscillating transverse acoustic field, although these should be small due to acoustic decoupling of the mixing section and the combustion chamber. Identification of the root cause of the shear layer modulation is a key aspect of planned future work. This will include investigation of vortical structures in the shear layers via simultaneous PIV/LIF as well as measurement of acoustic velocity and equivalence ratio in the mixing section to determine the significance of equivalence ratio fluctuations for high-frequency thermoacoustic instabilities.
In either case, the resulting flame modulation produces a sequence of alternating sign intensity patches, shown in the lower row of Figure 7. Tracking of patches over time reveals they are convectively transported with the mean flow and are contained within the propagation stabilised reactive shear layers between the recirculation zones and the bulk flow. Note that the auto-ignition stabilised core flame zone does not show any distinct flame modulation at this frequency. A further observation is that these alternating patches are antisymmetric about the combustor centreline. Such counter-phase behaviour is typical for the flame response to oscillations of the first transverse eigenmode, which is likewise antisymmetric about the centreline.
To investigate if shear layer modulation contributes to thermoacoustic driving, the phase relationship between CL intensity oscillations in the upper combustor half and the acoustic pressure field is evaluated. Figure 8 shows the CL oscillations for two phase intervals corresponding to maximum and minimum acoustic pressure conditions in this part of the combustor. The spatially-integrated values of oscillation intensity in both the upper combustor half and the upper shear layer region is calculated for each phase interval and plotted over the T1y acoustic oscillation cycle in Figure 9. Firstly, the contribution of shear layer modulation to the overall oscillation can be seen by comparing oscillation intensity in the shear layer region to that in the entire upper combustor half. This reveals that the majority of the heat release oscillation is concentrated in the shear layers. Secondly, the trend of the oscillation intensity, shown by the fitted curves, demonstrates that the heat release oscillates in phase with the acoustic pressure. The first point demonstrates that shear layer modulation contributes significantly to total heat release oscillation, while the second point shows that the phase relationship between oscillatory heat release and the acoustic mode satisfies the Rayleigh criterion. It can therefore be assumed that shear layer modulation contributes positively to thermoacoustic driving of the T1y mode.
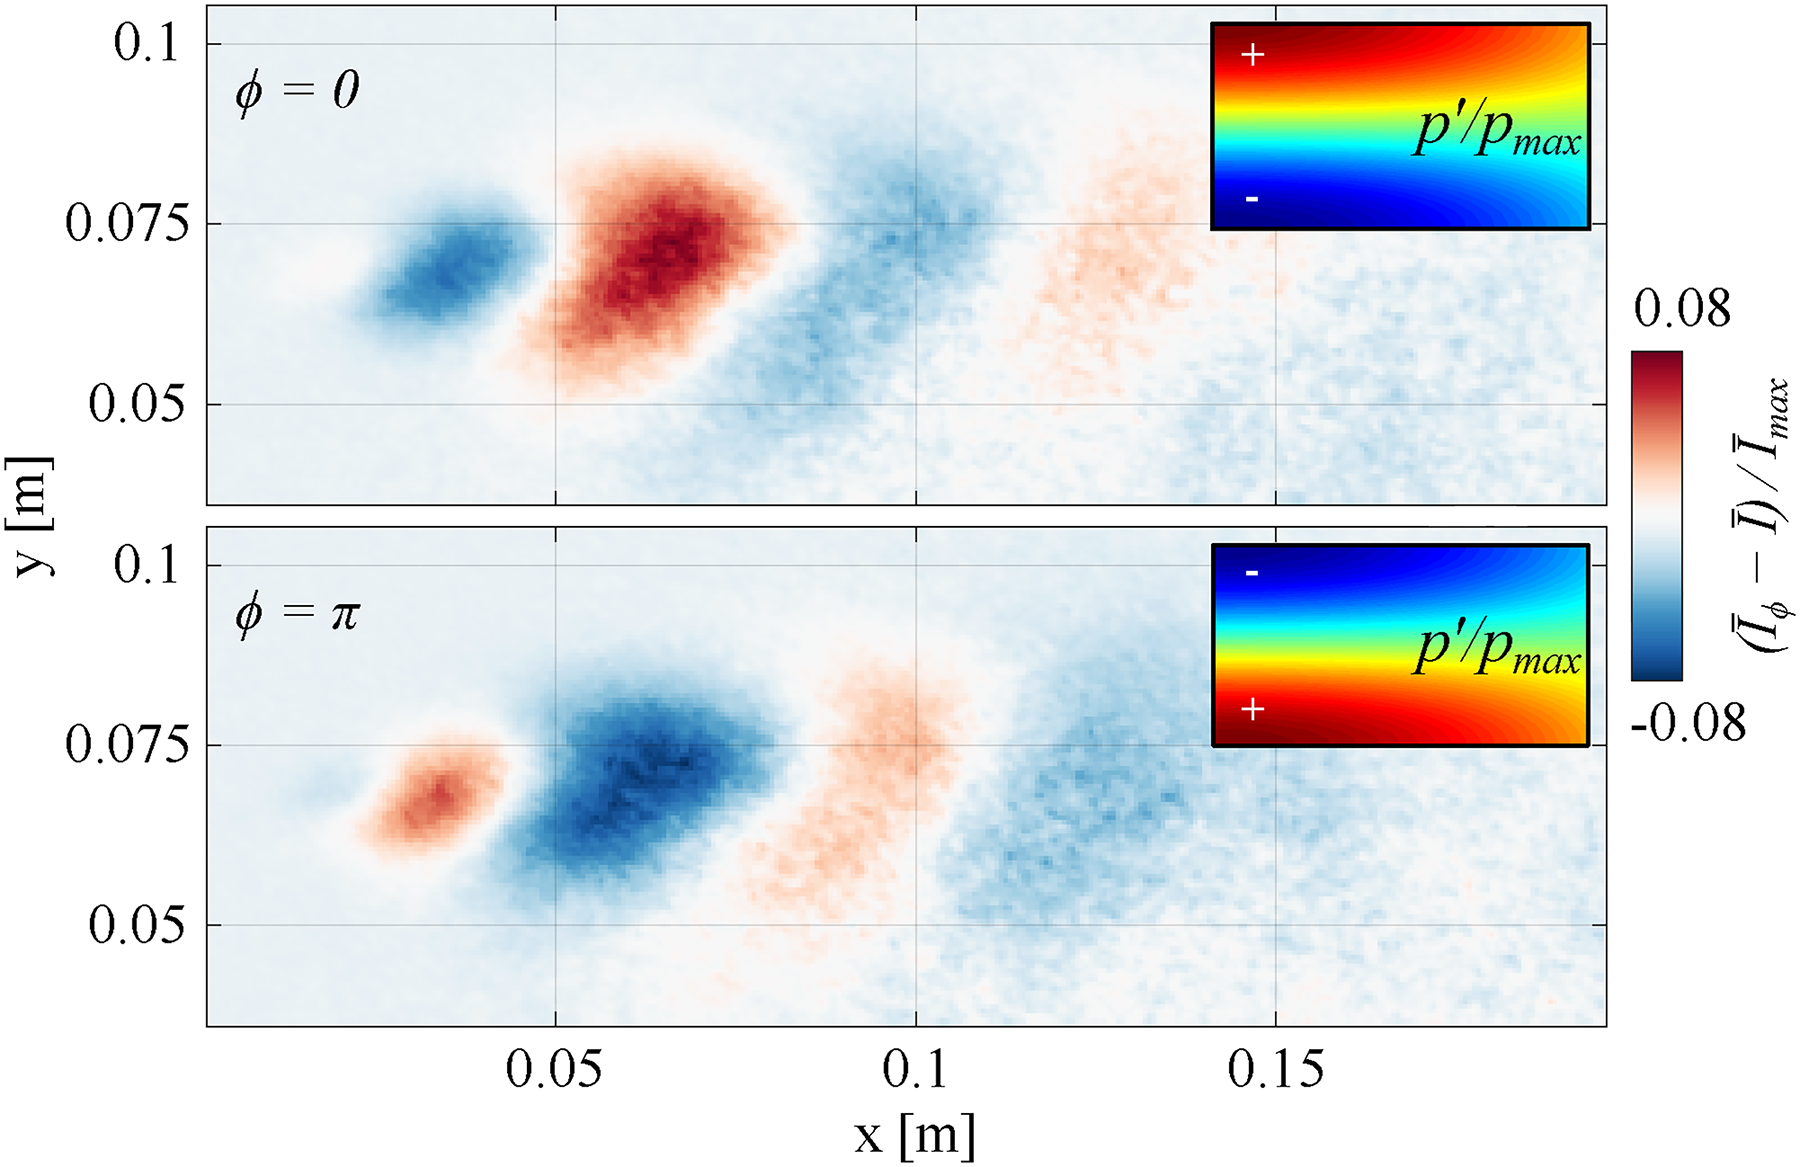
CL oscillations in the upper shear layer region (grey box in Figure 7) for phase intervals corresponding to maximum (upper) and minimum (lower) acoustic pressure. Insets indicate the acoustic pressure distribution in the combustion chamber (calculated via FEM) during each phase interval.
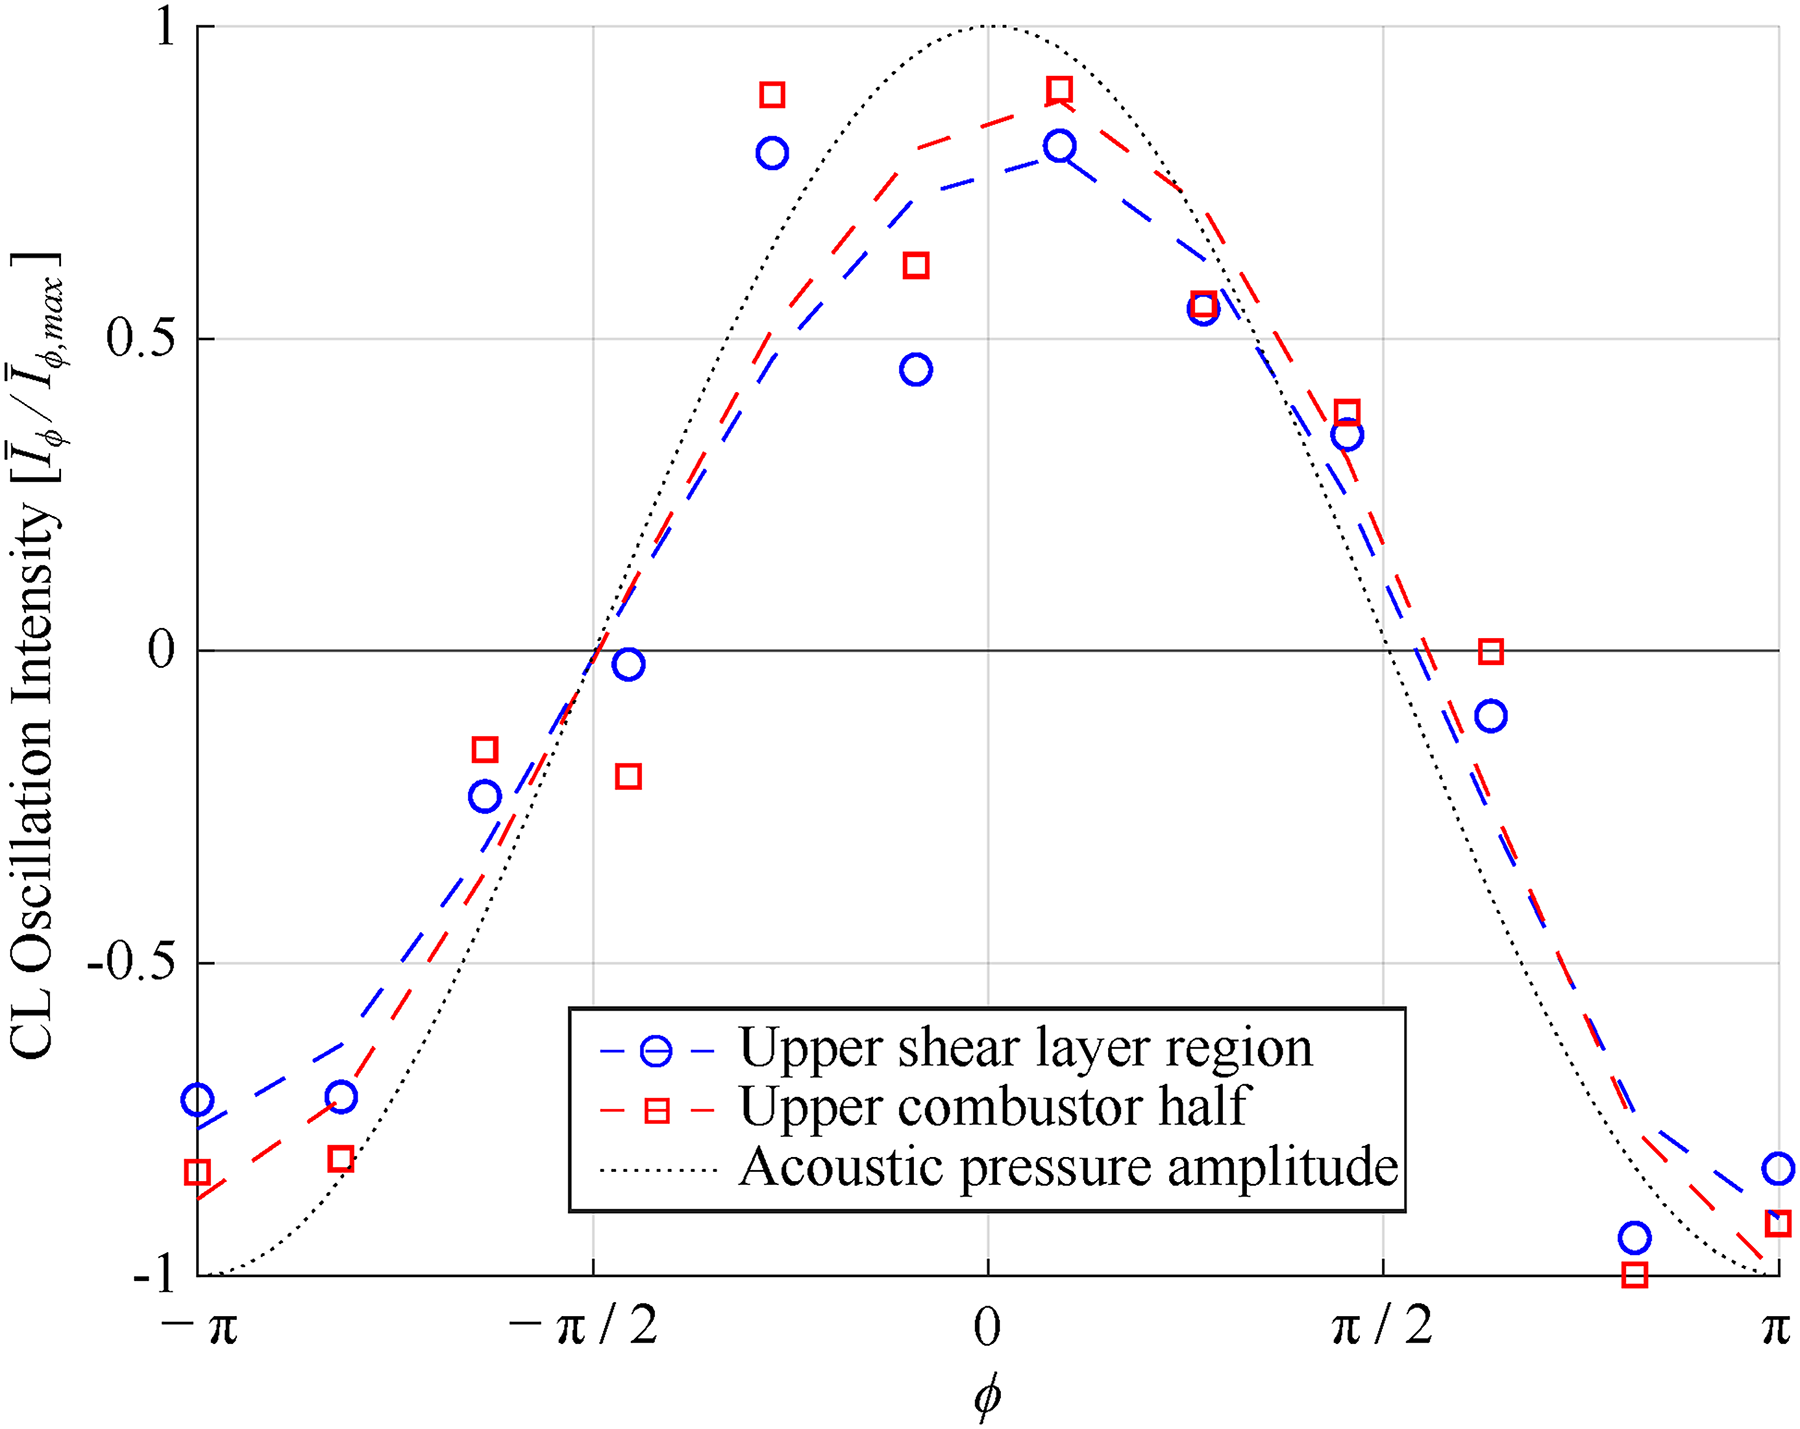
Normalised, spatially-integrated CL oscillation intensity over the T1y mode cycle in the upper shear layer region (blue circles) and the entire upper combustor half (red squares). Dashed lines are fitted in a least squares sense to the data points and the dotted line indicates the acoustic pressure.
Finally, the impact of the intermittent behaviour on this driving mechanism associated with reactive shear layer modulation is investigated by comparison of the oscillating intensity field during each intermittency condition. In this case, both condition- and phase-locking is applied in the calculation of the ensemble-averaged images. Figure 10 shows the oscillating CL intensity during a single phase interval for the four intermittency conditions. To allow a better comparison of how the intermittency alters the oscillatory heat release pattern, rather than the overall heat release distribution, the difference images are calculated relative to each condition-resolved mean image ( During stochastic conditions, the oscillatory pattern appears to have completely broken down. There is no coherent flame behaviour at the T1y frequency and the intensity field is dominated by random fluctuations With growing pressure pulsation amplitudes, the oscillatory pattern begins to show in the upstream parts of the shear layers Periodic pressure oscillation conditions produce a clear oscillatory heat release pattern During decay of pulsation amplitudes, the pattern begins to weaken. The intensity pattern is only seen in the upstream part of the shear layers while the downstream region is increasingly dominated by random fluctuations
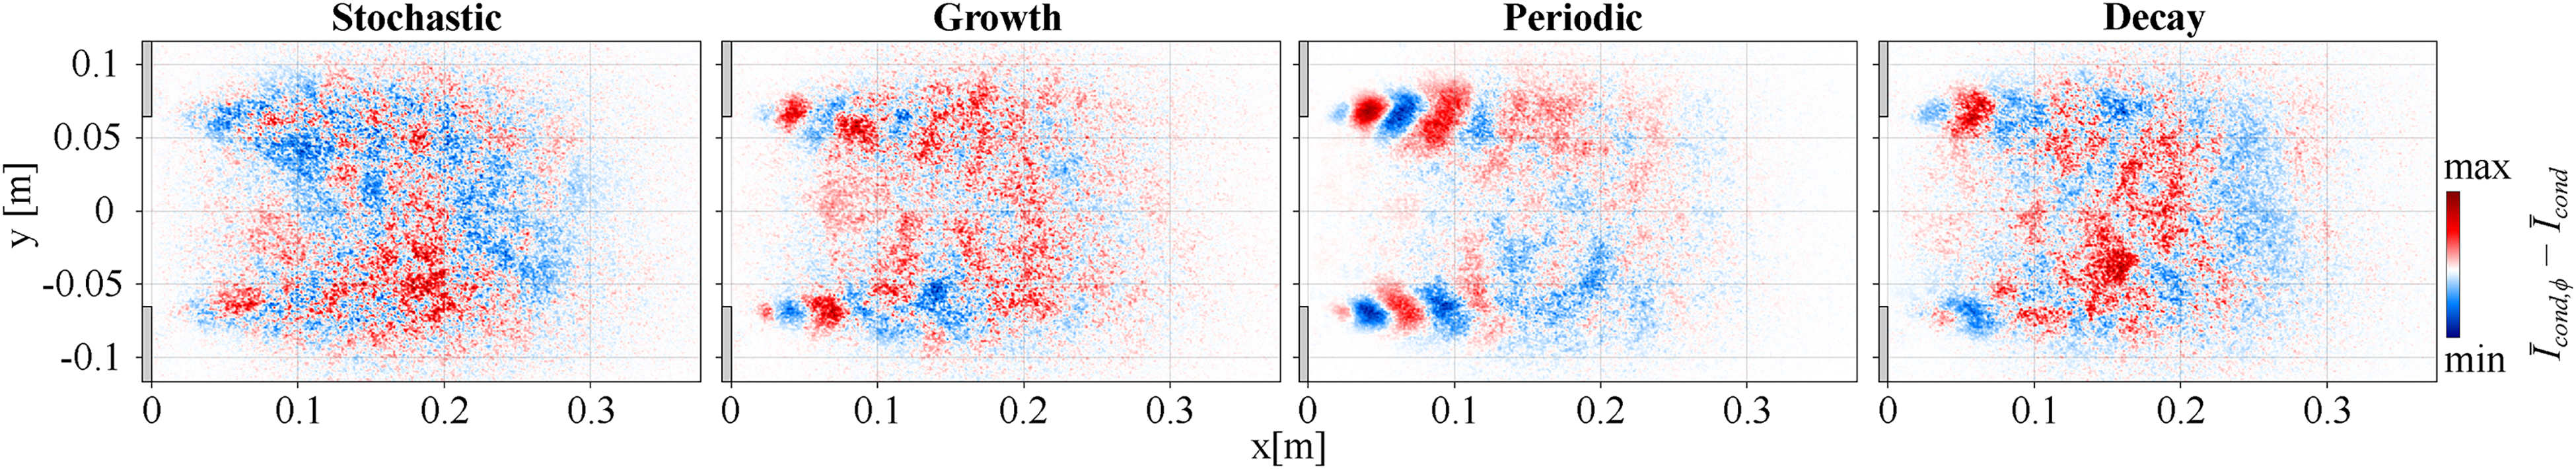
Condition- and phase-resolved ensemble-averaged difference images for a sample phase interval corresponding to each intermittency condition.
The exact reason for this change of the oscillatory pattern over the intermittency cycle depends on the root cause of the shear layer modulation. As described earlier, this is expected to be associated with acoustically-induced vortex shedding or equivalence ratio fluctuations. In either case, each intermittency condition would have similar effects as both are dependant on the strength of oscillations of the transverse acoustic field. The stochastic pressure fluctuations do not produce the oscillating transverse acoustic field required for the formation of periodic acoustically induced vortices or equivalence ratio fluctuations associated with the T1y mode, therefore the pattern is not present under this condition. As periodic pressure oscillations begin to develop and their amplitude rises, the pattern starts to form and thermoacoustic driving increases. The increasing pulsation amplitudes produce a more pronounced pattern which persists further downstream throughout the growth condition until it is at its strongest during high-amplitude periodic conditions. Once the heat release distribution shifts back towards the core flame region, driving potential reduces and pulsation amplitudes decrease during the decay condition. This is reflected in the weakening of the oscillatory pattern before returning to the stochastic condition.
The strengthening of the heat release pattern during conditions associated with increased thermoacoustic driving, and the subsequent weakening when driving potential is reduced, further indicates that the modulation of the reactive shear layer contributes to driving of the T1y mode. However, it should be noted that the total thermoacoustic driving of this mode is not solely due to shear layer modulation, and is instead the result of superposition of several mechanisms. Flame displacement by the acoustic velocity field, as observed in studies of swirl-stabilised combustors,20,21 is expected to contribute to driving in reheat combustors, as is compression and expansion of the flame due to deformation induced by the displacement. Furthermore, modulation of the auto-ignition delay time by the acoustic pressure likely also represents a source of thermoacoustic driving. 22 Effects related to these additional driving mechanisms cannot be discerned in the results presented in this paper. For the former two mechanisms concerning flame displacement and deformation, this may be due to low pressure amplitudes (and therefore low acoustic velocities), resulting in only a small impact on flame position and shape which cannot clearly be observed with the current diagnostic setup. In the case of the latter auto-ignition delay time modulation mechanism, the position the pressure node at the combustor centreline would produce negligible flame-acoustic feedback for the T1y mode in the auto-ignition stabilised core flame. Future work will focus on identifying the individual contributions of each mechanism, aided by the application of acoustic forcing and advanced diagnostic techniques.
Conclusions and Outlook
In this paper, the investigation of intermittent high-frequency thermoacoustic oscillations associated with the first transverse mode of an experimental reheat combustor is presented with the aim to determine the root cause of intermittent thermoacoustic behaviour and identify the likely flame-acoustic coupling which drives the associated thermoacoustic oscillations.
The first step is an evaluation of the intermittent periodic pressure oscillations. Four intermittency conditions, each with distinct dynamic characteristics, are defined as follows:
stochastic pressure fluctuations at low amplitudes growth of pressure amplitudes with a tendency towards periodic oscillations periodic pressure oscillations at elevated amplitudes decreasing pressure amplitudes and a tendency towards stochastic fluctuations
Based on investigation of the condition-dependant flame dynamics, the bursts of intermittent thermoacoustic oscillations are hypothesised to be due to a shift in heat release distribution between the auto-ignition stabilised core flame and the propagation stabilised reactive shear layers. This redistribution of heat release is likely due to the stochastic nature of auto-ignition kernel formation in the core flame. Thermoacoustic oscillations arise due to increased heat release away from the pressure node at the combustor centreline and towards the antinodes at the walls, resulting in stronger flame-acoustic feedback and greater driving potential.
The underlying flame-acoustic coupling mechanism which produces the thermoacoustic driving is identified from investigation of phase-resolved flame dynamics. An alternating, antisymmetric modulation of heat release in the shear layers is observed at the frequency of the T1y mode. The cause of the resulting heat release pattern cannot be directly determined with the current diagnostic approach; however, it is assumed to be associated with either acoustically-induced vortex shedding or equivalence ratio fluctuations. Future work will seek to identify which of these phenomena produces the heat release pattern.
To qualitatively determine if shear layer modulation contributes to thermoacoustic driving, the phase relationship between acoustic pressure and heat release oscillations in one combustor half is evaluated. This reveals an in-phase interaction of the flame and the acoustic field, satisfying the Rayleigh criterion. Furthermore, comparison between local oscillating heat release intensity in the shear layer and that of the entire upper combustor half indicates that the majority of the oscillatory heat release contribution is from the shear layers. It can therefore be inferred that modulation of the reactive shear layers contributes significantly to thermoacoustic driving of the T1y mode. Further investigations will aim to quantify this contribution with the application of acoustic driving and advanced diagnostic techniques.
Additional driving mechanisms are also expected to be present, although their effects cannot be discerned from the measurements presented in this paper. Flame displacement by the acoustic velocity, and the associated flame expansion and contraction due to the induced deformation, may not be observable due to the low pressure amplitudes associated with the T1y mode. Coupling between the auto-ignition delay time and acoustic pressure is also not seen; however, this is likely due to the presence of a pressure node in the vicinity of the auto-ignition stabilised core zone, resulting in negligible interaction between the core flame and the acoustic field. The main goal of future work is to determine the individual contributions of each driving mechanism and quantify them to allow accurate prediction of thermoacoustic instabilities in gas turbine reheat combustors.