
Abstract
Background:
Traditional pathological diagnosis methods have limitations in terms of interobserver variability and the time consumption of evaluations. In this study, we explored the feasibility of using whole-slide images (WSIs) to establish a deep learning model for the diagnosis of clear cell renal cell carcinoma (ccRCC).
Methods:
We retrospectively collected pathological data from 95 patients with ccRCC from January 2023 to December 2023. All pathological slices conforming to the standards of the model were manually annotated first. The WSIs were preprocessed to extract the region of interest. The WSIs were divided into a training set and a test set, and the ratio of tumor slices to normal tissue slices in the training set to the test set was 3:1. Positive and negative samples were randomly extracted. Model training was based on a convolutional neural network (CNN) and a random forest model. The accuracy of the model was evaluated by generating a receiver operating characteristic (ROC) curve.
Results:
A total of 663 pathological slices from 95 patients with ccRCC were collected. The mean number of slices per patient was 7.6 ± 2.7 (range: 3–17), with 506 tumor slices and 157 normal tissue slices. There were 200 tumor slices and 74 normal slices in the training set, and a total of 200,870 small images were extracted. There were 250 tumor slices and 63 normal slices in the test set, and a total of 39,211 small images were extracted. According to the CNN model and random forest model trained with the training set, 11 pathological slices in the test set were identified as false normal slices, and six pathological slices were identified as false tumor slices. The total accuracy was 94.6% (296/313), the precision rate was 97.6% (239/245), and the recall rate was 95.6% (239/250). The generated probabilistic heatmaps were consistent with the manually annotated pathological images. The ROC curve results revealed that the area under curve (AUC) reached 0.9658 (95% confidence interval: 0.9603–0.9713), the specificity was 90.5%, and the sensitivity was 95.6%.
Conclusion:
The use of a deep learning method for the diagnosis of ccRCC is feasible. The ccRCC model established in this study achieved high accuracy. AI-based diagnostic methods for ccRCC may improve diagnostic efficiency.
Introduction
Renal cell carcinomas (RCCs) are heterogeneous tumors with different histological and molecular characteristics, clinical outcomes, and responses to treatment. The most common types are clear cell renal cell carcinoma (ccRCC), papillary renal cell carcinoma, and chromophobe renal cell carcinoma. Histopathological examination (via light microscopy) plays a crucial role in determining the pathological type and malignancy grade of renal tumors. One challenge faced by pathologists is the variability among observers and the time-consuming nature of manual assessments of all nuclei in tissue sections. To overcome these limitations, automated methods and decision support systems can be used to reveal subtle morphological differences between clinical groups and accelerate the diagnostic process. 1
Artificial intelligence (AI) can be used to develop intelligent methods to make judgments in a human-like manner and simulate the human intelligence process. The field of AI relies primarily on machine learning (ML), in which specific datasets are used to simulate or replicate human “learning” behavior, thereby progressively increasing the capacity to accomplish specific tasks. The advancement and development of science and technology have facilitated the pervasive integration of AI into various fields of medicine.2–4 Pathology is a discipline based on imaging, making it ideal for using, expanding, and developing artificial intelligence technology. Consequently, there has been significant progress in the development and utilization of AI technology within the field of pathology in recent years.5–7 With the digitization of patient tissue samples, digital pathology has emerged at a pivotal moment, particularly with the advent of whole-slide imaging (WSI). In WSI, pathological sections are rapidly scanned into high-resolution electronic images that encompass comprehensive tissue information, transforming traditional physical slides into a new generation of digital pathological sections known as full-section images. WSIs are multiresolution pathological sections with high image quality and can be adjusted at any magnification, such as 40×, 20×, 10×, and 5×, and different fields of view in the microscope sense. The application of digital pathology in clinical practice is undoubtedly one of the most groundbreaking methods in the daily working environment of pathologists. 8
After successful digitization of pathological images, computer-aided diagnosis remains necessary. With the progressive advancement of ML techniques, such as neural networks and natural language processing, digital pathological image recognition has emerged as a pivotal research domain in computer vision technology applications. According to the literature, image recognition and detection-based computer-aided diagnostic systems can effectively support pathologists in their pathological diagnosis endeavors, achieving a level comparable to that of experienced senior pathologists. 9 The Fuchs T team from Memorial Sloan Kettering Cancer Center (MSKCC) published the test results obtained with a diagnostic system for digital pathological sections in the medical journal Nature Medicine. A total of 44,732 pathological sections from 15,187 cancer patients in 44 countries and regions were analyzed, and the diagnostic accuracy of common solid malignant tumors reached 98%. If the system can be put into use, it can reduce the reading workload of physicians by nearly 70%. 10
ccRCC is the most prevalent histological subtype of renal cell carcinoma. Histopathological observations typically reveal distinct demarcations between the tumor and normal tissue, well-defined intercellular boundaries, and prominent nucleus–cytoplasmic boundaries, which facilitate image feature extraction and AI-based pathological diagnosis and classification. In this study, we aimed to establish a deep learning model for the identification of ccRCC by collecting pathological sections and employing processes such as WSI establishment, manual annotation, and computer-aided diagnosis. The objective was to increase clinicians’ work efficiency and potentially utilize the proposed technology for the prognostic assessment of renal cancer in the future.
Materials and methods
Our dataset was acquired from the National Cancer Center/Cancer Hospital, Chinese Academy of Medical Sciences (NCC/CHCAMS) (institutional review board number: 21/405-3076) and included high-resolution digital WSIs of H&E-stained renal tissue slides. Given the retrospective nature of the study and the use of anonymized patient data, requirements for informed consent were waived. The reporting of this study conforms to the Standards for Reporting Diagnostic Accuracy (STARD) statement. 11 The clinical and pathological data for 95 patients with ccRCC who underwent surgical procedures between January 2023 and December 2023 were retrospectively collected. The study case inclusion criteria included the following: (1) the operation time ranged from January to December 2023; (2) primary RCC was observed; (3) the clinical data were relatively comprehensive, with a low rate of missing information (<10%); (4) complete pathological section data were available; and (5) the definitive histological subtype of the patients was ccRCC. The case exclusion criteria included the following: (1) metastatic RCC was observed; (2) relevant clinical data were absent (with a missing rate exceeding 10%); (3) pathological section data were missing; or (4) the pathological type was not ccRCC.
The recognition method for pathological images of RCC based on ML primarily consists of two stages: the training stage for model development and the test stage for model evaluation. The process of model construction is shown in Figure 1. The gold standard for patients in the training and testing stages was determined by a urologist to assess whether the patient met the enrollment criteria. All pathological sections from the case training and testing stages were reviewed by pathologists, and the final pathological diagnosis was used as the gold standard. During the training stage, the tumor tissue sections were manually annotated, accurately delineating both the tumor and normal tissue regions. These labeled digital sections, along with corresponding clinical data, were downloaded to a computer for image recognition analysis to determine the specific pathological type in each case. In addition, a subset of these pathological sections was utilized for preliminary verification. During the testing stage, the corresponding digital slice data for each case were used to determine the pathological type, and the result was then compared with the manual assessment results. On the basis of these comparisons, adjustments were made to fine-tune the computer-established model, ultimately leading to the development of a model for identifying ccRCC.

Technical route of model construction for diagnosing ccRCC based on the WSI. Black-and-white image displayed as a probability heatmap.
Pathological section scanning and labeling
The images are generated by specialized scanners equipped with a built-in hierarchical structure. The pathological image slices can be categorized into various magnification levels ranging from 0 to 9. The lower the level is, the higher the magnification. At level 0, pathological image resolution can reach millions of pixels. The study utilized a fully automated pathological section scanner (trade name: KFBIO; Jiangfeng Biology, Ningbo City, Zhejiang Province, China), featuring an image resolution of 0.23 µm/pixel and a maximum dimension of 100,000 × 100,000 pixels. The pathological slides were labeled via the Automated Slide Analysis Platform (ASAP). To increase the accuracy of the annotation results, two pathologists at level 0 labeled the pathological images, and a separate pathological expert reviewed the annotation outcomes (Figure 2).

Examples of the labeling of pathological sections at different magnifications.
WSI preprocessing
In this study, only the tumor area and normal area, also known as the region of interest (ROI), were extracted on the basis of the labeled results. The color and intensity variations in tissue sections stained with hematoxylin-eosin (H&E) may impede the effectiveness of quantitative image analysis; moreover, the entire digital pathological section contains numerous empty areas and fat tissue, which are less conducive to section recognition and extraction while occupying computational resources. The tissue areas in the slices were extracted separately, and the blank and fat areas were subsequently removed. The primary approach involved generating black-and-white binary image files for the entire tissue sample on the basis of fixed image magnification. The original preprocessing steps for the WSI images are as follows (Figure 3).
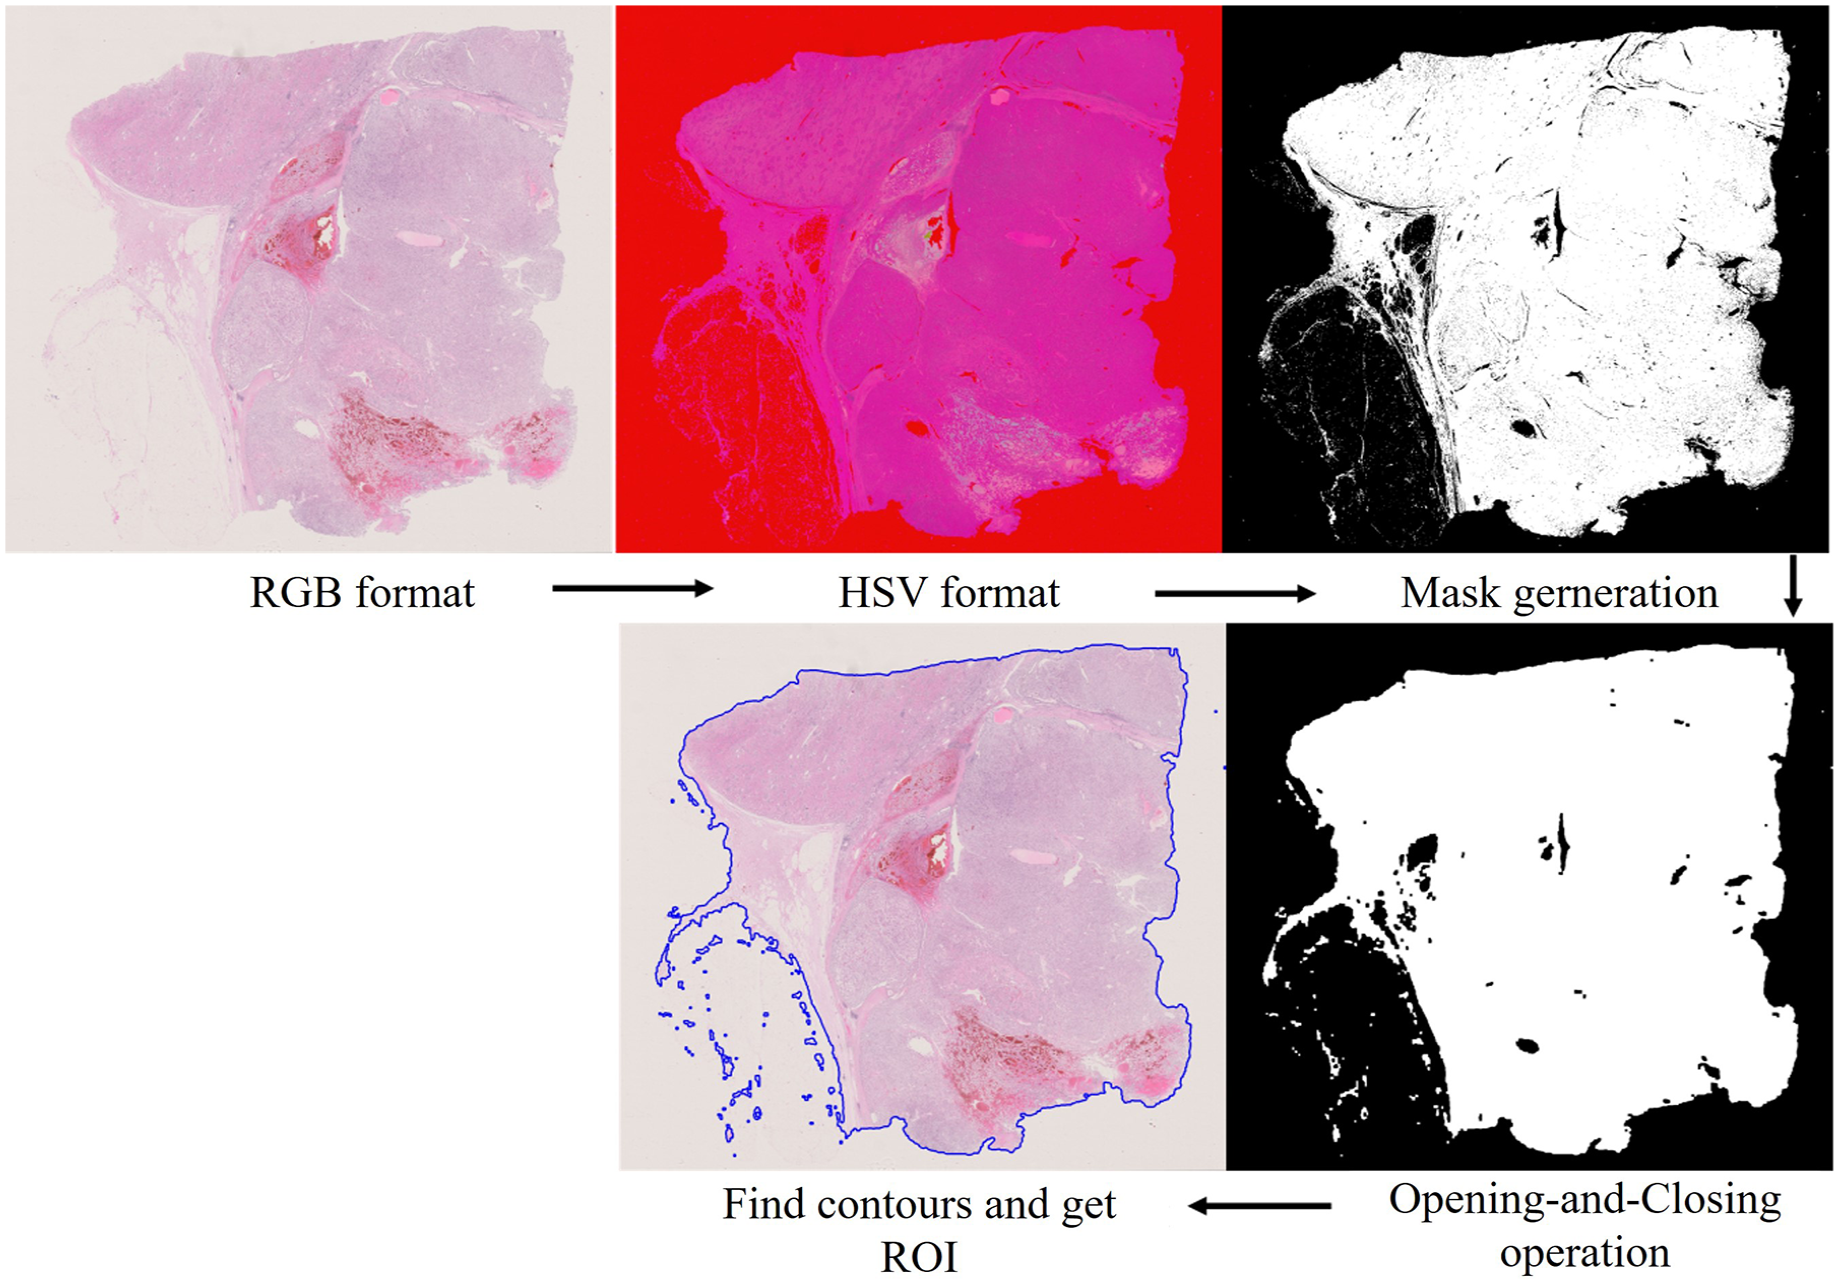
Core preprocessing steps for the WSI.
Training set construction
Given the inverse relationship between level and pixel, which makes it challenging to identify the characteristic morphology of tumor tissue and cells at high levels, this study was conducted using level 0 (the highest pixel) pathological images. WSIs were divided into fixed-size small images for extraction at a resolution of 256 × 256. Subsequently, positive and negative samples were randomly extracted at a ratio of 1:3 to construct the training set for the deep learning model. The positive samples corresponded to the subimages of the tumor areas, whereas the negative samples corresponded to the subimages of the normal areas. Ultimately, all these subimages were combined to form the training set for convolutional neural networks (CNNs).
Model inference and generation of probability heatmaps
A CNN model is adopted for the classification of small graphs. We adopted the Inceptionv3 model within our CNN-based classification and detection framework for identifying pathological sections of ccRCC. Once training was complete, we evaluated the performance of the Inceptionv3 model by generating a slice-based heatmap of the WSIs. This evaluation process involved two main steps: (1) the small images were extracted from the ROI of each WSI, containing all WSIs for the training set and test set, and (2) the trained CNN Inceptionv3 model was used to classify small images and combine the results into a WSI heatmap according to the corresponding coordinates.
Heatmap feature extraction and WSI classification
After CNN training to generate the model, the image features were presented in the form of a heatmap. A random forest model was used to further classify and extract features from the heatmap, which mainly included the pixel features of the heatmap, morphological features, geometric features, and other features. This task was divided into two steps: (1) the probabilistic heatmap of the training set was extracted to construct a machine learning-based WSI classification model, which was fitted with a random forest mode, and (2) the features extracted from the test set were utilized for classification via the slice classifier obtained in the initial step, ultimately yielding the area under curve (AUC) value of model classification.
Statistical analysis
In the data analysis in this study, Python 3.6.4 was utilized for model establishment and evaluation, and the recognition results were quantified in terms of sensitivity, specificity, positive predictive value, and negative predictive value. We employed the AUC value and plotted a ROC curve to assess the performance of the WSI classification model and determine the optimal diagnostic threshold. The horizontal axis of the ROC curve represents 1-specificity (false positive rate), whereas the vertical axis indicates sensitivity: (1) sensitivity = number of true positive samples/total number of positive samples and (2) 1-specificity = number of false positive samples/total number of negative samples.
Results
General clinical data
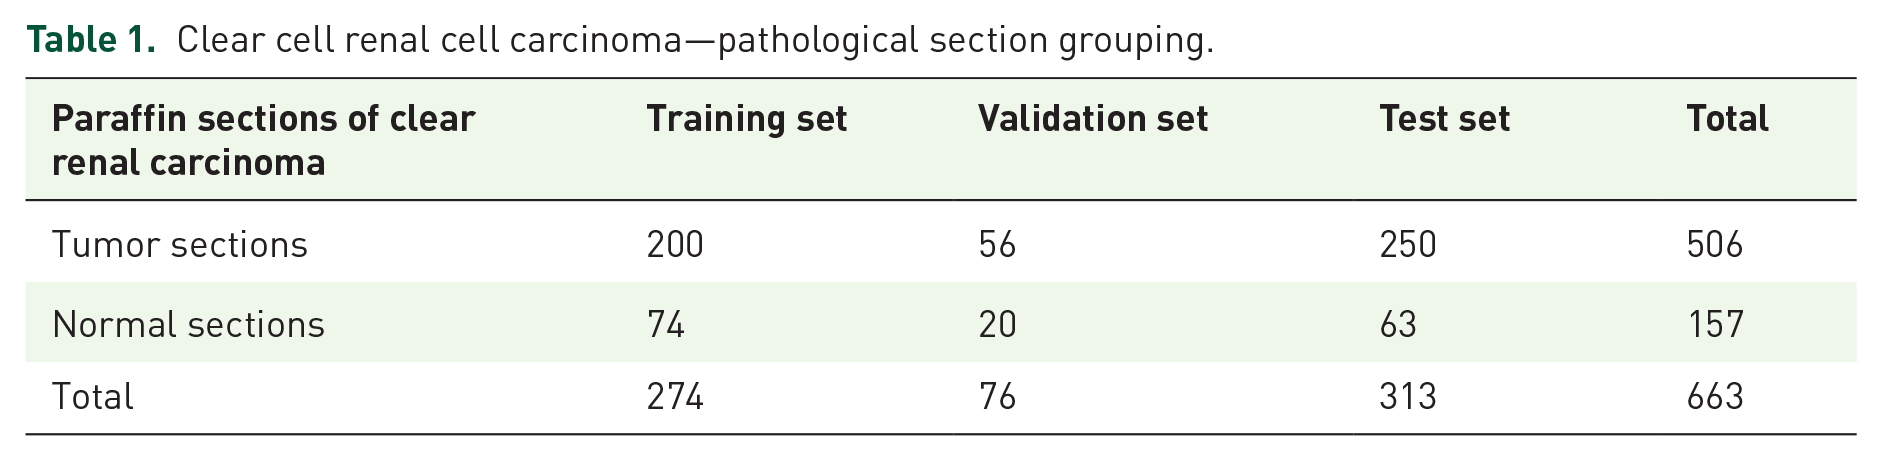
In this study, a total of 663 pathological sections were collected from 95 patients with ccRCC who underwent surgery between January 2023 and December 2023. On average, each patient had 7.6 ± 2.7 (range: 3–17) sections, with 506 tumor sections and 157 normal tissue sections in total. All the tumor sections were manually labeled for analysis. The training set consisted of 200 tumor sections and 74 normal tissue sections. The validation set consisted of 56 tumor sections and 20 normal tissue sections. The test set consisted of 250 tumor sections and 63 normal tissue sections (Table 1). WSIs were extracted at level zero for all the samples. During training with the Inceptionv3 model, positive and negative samples were randomly selected from the training set. A positive sample set consisting of approximately 270 small images was obtained for each tumor section, and a negative sample set containing approximately 550 small images was obtained for each pathological section, resulting in a total of 200,870 small images used for model training. In the test set, similar extraction methods were applied, with approximately 270 small images per tumor section in the positive sample set and 300 small images per pathological section in the negative sample set, resulting in a total of 39,211 small images used for testing (Table 2).
Clear cell renal cell carcinoma—pathological section grouping.
Clear cell renal cell carcinoma pathological section subplot data set composition preparation.

Positive sample: small pathology images with renal cancer cells; negative sample: small pathology images without renal cancer cells.
Training a random forest model on the basis of model heatmap features
After training with the 200,870 small images in the training set, we obtained the morphological features of the heatmap, such as pixel features, texture features, and geometric features (Supplemental Figure 1). The random forest algorithm was employed for training on the basis of these features.
Model test results
The CNN model and random forest model trained with the training set were applied, and the recognition results for 389 pathological sections revealed that 11 positive sections were misidentified (Supplemental Figure 2) and that six negative sections were misidentified (Supplemental Figure 3) in the test set. The overall accuracy rate was 94.6% (296/313), the precision rate was 97.6% (239/245), and the recall rate was 95.6% (239/250) (Table 3). The overall results revealed that the generated probabilistic heatmap and the manually labeled pathological images displayed good consistency (Figure 4).
Clear cell renal cell carcinoma biopsy test set results.
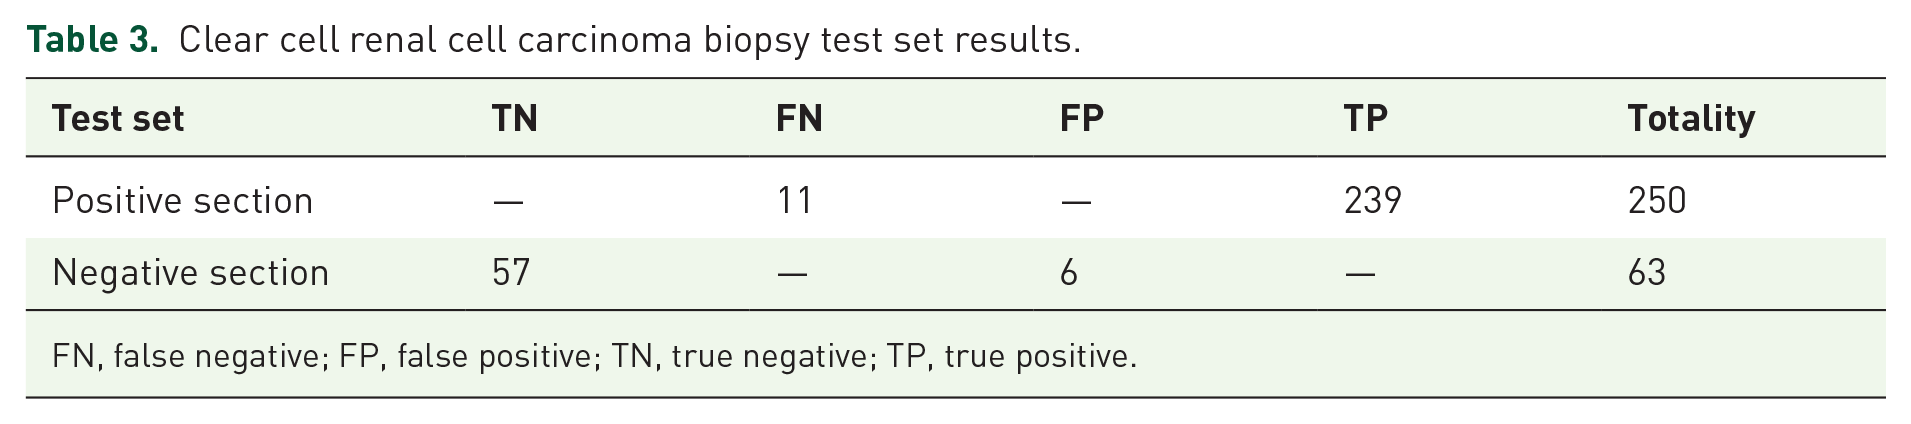
FN, false negative; FP, false positive; TN, true negative; TP, true positive.

Consistency of manually labeled pathological images and model-generated probabilistic heatmaps. Black-and-white image displayed as a probability heatmap. High-probability regions in the heatmap typically appeared as brighter tones.
The indicators are as follows:


The ROC curve was drawn according to the test results, and the results revealed that the AUC reached 0.9658 (95% CI: 0.9603–0.9713), the specificity was 90.5%, and the sensitivity was 95.6% (Figure 5).

The ROC curve and AUC value based on the test set.
Discussion
Traditionally, decision support systems for medical image analysis rely on manually extracted features on the basis of expert knowledge of pathology. However, these methods are highly reliant on the level of clinical experience and are based on the manual interpretation of pathological slides, which is a time-consuming process. Moreover, there is a significant degree of variability among observers, raising concerns about both generalizability and accuracy. The advent of digital pathology has paved the way for AI-based computer image analysis solutions that hold the potential for supporting objective and quantitative pathological diagnoses. The fields of pathology and computer science have recently converged, with computer scientists and pathologists collaborating to apply cutting-edge techniques in the analysis of pathological slides for diagnosis, prognosis, prediction, and other clinically relevant purposes.
ML is a subfield of AI that develops algorithms that enable computers to adapt to new problems without reprogramming. Most ML algorithms can be viewed as mathematical models that map a set of observed variables (“features” or “predictor variables”) for data points or samples to a set of result variables (“labels” or “targets”). The complexity of ML algorithms needs to be enhanced to accommodate the increasing complexity of the relationship between observed feature variables and desired outcome labels, such as mapping raw pixel values of an image to its semantic labels. Deep learning, a common technique of AI, can also use millions of units similar to neurons to learn the complex relationship between image pixel values and their semantic labels without manual engineering, and automatically learn features from data. 12 Currently, deep learning has made significant advancements and breakthroughs in tasks related to image classification. Moreover, high-capacity deep neural network models have surpassed human diagnostic capabilities, demonstrating their superiority. Pathological studies conducted on various solid tumors such as thyroid cancer, breast cancer, lung cancer, colorectal cancer, and liver cancer have further validated the applicability and advantages of AI.13–17 However, there are few research reports on the application of AI in the pathological diagnosis of renal cell carcinoma. Kruk et al. 18 developed a computer system for identifying the Fuhrman grades of ccRCC using pathological images. The present study employs the support vector machine method in conjunction with gradient and nuclear technology for the purpose of identification, classification, mathematical morphology, and further differentiation of Fuhrman grading. The findings demonstrate that algorithms based on diverse image features effectively describe nuclear grading while exhibiting a high degree of concordance with Fuhrman grading results. These descriptors have been used as diagnostic functions to form the input of the nuclei classifier, which is used to perform the final recognition of cells. Based on more than 3000 nuclei estimates, the average difference rate between the system score and the results of pathologists was less than 10%. Holdbrook et al. 19 also developed an image self-classification system that automatically classified renal cell carcinoma into low (Fuhrman 1 and 2) or high (Fuhrman 3 and 4) grades by detecting and analyzing nucleoli in pathological images of renal cell carcinoma. In addition to the above two studies, Yeh and Tian et al.20,21 also developed an automatic grading system for ccRCC diagnosis using WSI, and the latter also found that the grading generated by automatic diagnosis was closely related to prognosis. The above results indicate that at high magnification, the pathological image of ccRCC demonstrates excellent nucleus recognition ability. In contrast, histological identification of RCC is associated with significantly lower difficulty. ccRCC often exhibits distinct boundaries between tumor and normal tissue, as well as between cells and nucleus-cytoplasm compartments. Therefore, the application of ML in kidney pathology image analysis is feasible.
There have been some reports of the application of AI in the pathological diagnosis of RCC subtype classifications. Hishma et al. 22 used a CNN system to recognize pathological images of ccRCC and determine the pathological subtype. In this study, three patches of different sizes were used to recognize pathological images. Convolutional parameter features were used to perform a majority vote to identify and classify tissues and finally obtain the pathological type. The results revealed that the tissue types recognized on the basis of different-sized patches corresponded well with the pathological diagnoses made by pathologists. Tabibu et al. 23 also used the CNN model to distinguish different subtypes, which achieved a classification accuracy of 94.07%. Ponzio et al. 24 investigated the automatic RCC subtyping classification of 91 patients, diagnosed with ccRCC, papillary RCC, chromophobe RCC, or renal oncocytoma, through deep learning-based methodologies. They introduced a new classification model leveraging a combination of supervised deep learning models (specifically CNNs) and a pathologist’s expertise. Zhu et al. 25 established a neural network model that can accurately classify digitized surgical resection slides and biopsy slides into five related classes: clear cell RCC, papillary RCC, chromophobe RCC, renal oncocytoma, and normal (with AUC 0.98).
In our study, we initially acquired WSIs with scanning instruments. Subsequently, the blank areas and fat tissue components in the slices were eliminated through image preprocessing. Finally, we obtained the specific tissue area of interest. Pathologists manually delineated both the tumor and normal tissue regions, which were then uploaded to a server. To establish a diagnostic model for ccRCC, all slices were randomly divided into training and test sets at a ratio of 1:3. The WSIs were further partitioned into fixed-sized small images for random extraction. These extracted small images underwent CNN processing to generate corresponding probability values. On the basis of these probabilities, positive and negative samples were segregated, leading to the regeneration of a heatmap. The CNN model was trained by comparing this heatmap with labeled pathological slices. Following CNN model training, all the small images of each slice were again extracted to generate digital heatmaps via the trained CNN model. The feature extraction and classification tasks were performed on the basis of a random forest methodology. Notably, no relevant studies have reported the use of deep learning methods for diagnosing ccRCC. However, the accuracy of this study is similar to that of some studies conducted on other solid tumors.26–29
Although this study achieved high accuracy, it has certain limitations, and further optimization is needed. First, the AI-based method heavily relies on the quantity and quality of the input data, including the quality of the pathologists’ slices. The data used for training algorithms should be meticulously preprocessed, devoid of artifacts, and comprehensive to develop models with robust predictive performance. On the basis of the accuracy achieved in this study, future sample sizes should be expanded, and the quality of the included slices should be increased to further improve accuracy. Second, some tumor cells do not have the morphological characteristics of ccRCC but can be diagnosed as ccRCC on the basis of the results of immunohistochemistry analyses. These challenging samples lack both quantity and distinctive characteristics, which makes it difficult for computers to recognize them. As auxiliary diagnostic tools, computers cannot discern the cellular biological behaviors of tumors, such as protein expression. In future work, these challenging samples could be studied separately, and the number of relevant slices could be increased to increase accuracy.
With respect to future prospects, in the field of AI applications in medicine, many problems still need to be solved. It is crucial to develop sophisticated ML models for the pathological diagnosis of kidney cancer that are easily comprehensible, ensuring their compliance with legal and ethical standards. The complexity of the formulas and calculations involved in constructing ML models makes it challenging for individuals to assess their inherent functions. Consequently, developers must provide transparent and comprehensible models to maximize their acceptance. Moreover, repeatability and reproducibility pose significant challenges for the future of WSI-assisted pathological diagnosis. The standardization of extraction and identification processes for various pathological sections by researchers will contribute to the increased adoption of WSI technology. With the aid of AI technology, leveraging AI for accurate TNM staging of pathological results could become a prominent approach in future research. Furthermore, harnessing AI to seamlessly integrate a patient’s array of clinical data and offer a comprehensive diagnosis holds immense potential for facilitating informed decision-making by clinical practitioners.30–32
Conclusion
In conclusion, the application of ML models using WSIs for diagnosing ccRCC is feasible. The developed model for ccRCC demonstrates high accuracy. This technology has the potential to significantly improve clinicians’ work efficiency.
Supplemental Material
sj-docx-1-tau-10.1177_17562872251333865 – Supplemental material for Diagnosis of clear cell renal cell carcinoma via a deep learning model with whole-slide images
Supplemental material, sj-docx-1-tau-10.1177_17562872251333865 for Diagnosis of clear cell renal cell carcinoma via a deep learning model with whole-slide images by Weixing Jiang, Siyu Qi, Cancan Chen, Wenying Wang and Xi Chen in Therapeutic Advances in Urology
Supplemental Material
sj-docx-2-tau-10.1177_17562872251333865 – Supplemental material for Diagnosis of clear cell renal cell carcinoma via a deep learning model with whole-slide images
Supplemental material, sj-docx-2-tau-10.1177_17562872251333865 for Diagnosis of clear cell renal cell carcinoma via a deep learning model with whole-slide images by Weixing Jiang, Siyu Qi, Cancan Chen, Wenying Wang and Xi Chen in Therapeutic Advances in Urology
Supplemental Material
sj-docx-3-tau-10.1177_17562872251333865 – Supplemental material for Diagnosis of clear cell renal cell carcinoma via a deep learning model with whole-slide images
Supplemental material, sj-docx-3-tau-10.1177_17562872251333865 for Diagnosis of clear cell renal cell carcinoma via a deep learning model with whole-slide images by Weixing Jiang, Siyu Qi, Cancan Chen, Wenying Wang and Xi Chen in Therapeutic Advances in Urology
Supplemental Material
sj-pdf-4-tau-10.1177_17562872251333865 – Supplemental material for Diagnosis of clear cell renal cell carcinoma via a deep learning model with whole-slide images
Supplemental material, sj-pdf-4-tau-10.1177_17562872251333865 for Diagnosis of clear cell renal cell carcinoma via a deep learning model with whole-slide images by Weixing Jiang, Siyu Qi, Cancan Chen, Wenying Wang and Xi Chen in Therapeutic Advances in Urology
Footnotes
References
Supplementary Material
Please find the following supplemental material available below.
For Open Access articles published under a Creative Commons License, all supplemental material carries the same license as the article it is associated with.
For non-Open Access articles published, all supplemental material carries a non-exclusive license, and permission requests for re-use of supplemental material or any part of supplemental material shall be sent directly to the copyright owner as specified in the copyright notice associated with the article.