
Abstract
Background:
Cystitis glandularis is a chronic inflammatory disease of the urinary system characterized by high recurrence rates, the reasons for which are still unknown.
Objectives:
This study aims to identify potential factors contributing to recurrence and propose a simple and feasible prognostic model through nomogram construction.
Design:
Patients with confirmed recurrence based on outpatient visits or readmissions were included in this study, which was subsequently divided into training and validation cohorts.
Methods:
Machine learning techniques were utilized to screen for the most important predictors, and these were then employed to construct the nomogram. The reliability of the nomogram was assessed through receiver operating characteristic curve analysis, decision curve analysis, and calibration curves.
Results:
A total of 252 patients met the screening criteria and were enrolled in this study. Over the 12-month follow-up period, the relapse rate was found to be 57.14% (n = 144). The five final predictors identified through machine learning were urinary infections, urinary calculi, eosinophil count, lymphocyte count, and serum magnesium. The area under curve values for all three time points assessing recurrence exceeded 0.75. Furthermore, both calibration curves and decision curve analyses indicated good performance of the nomogram.
Conclusion:
We have developed a reliable machine learning-based nomogram for predicting recurrence in cystitis glandularis
Plain language summary
Cystitis glandularis (CG) is a chronic inflammatory disease of the urinary system with a high recurrence rate. However, the cause of the recurrence of cystitis glandularis has been controversial. This study aims to establish a reliable clinical model for predicting the recurrence of cystitis glandularis. The data of this study showed that the recurrence of cystitis glandularis was closely related to urinary tract infection, urinary calculi, eosinophil count, lymphocyte count, and serum magnesium ion concentration, and a reliable recurrence prediction model of cystitis glandularis was established by machine learning.
Introduction
Cystitis glandularis (CG) is a relatively uncommon chronic inflammatory condition of the urinary system, with a rising detection rate attributable to advancements in cystoscopy and pathological diagnostic technologies.1 –3 It frequently manifests with nonspecific symptoms, including frequent urination, painful urination (odynuria), hematuria, and dysuria,4 –6 which can markedly affect patients’ quality of life due to recurring episodes.
Although primarily a pathological concept, the most widely accepted theory regarding its pathogenesis involves epithelial metaplasia mediated by diverse molecular and intracellular environments, including factors like Cdx2. 7 This process contributes to its elevated recurrence rates even following primary treatments, such as transurethral resection of bladder lesions. Nevertheless, there remains controversy surrounding whether CG should be classified as a precancerous condition.8,9 As a result, it continues to pose a significant challenge for clinical diagnosis and treatment, largely due to its recurrent nature.
Simultaneously, previous studies have frequently been presented as case reports with limited sample sizes,10,11 impeding the systematic exploration of CG characteristics. Hence, the establishment of a comprehensive database comprising characteristics of patients with CG, coupled with the application of systematic methods to investigate recurrence factors, emerges as a pivotal concern in the domain of diagnosis and treatment. For example, various associated diseases and blood detection indicators are employed to predict disease outcomes; one notable correlation is the strong association between erythrocyte sedimentation rate and prostate cancer prognosis, 12 while blood white cell count serves as a significant predictor for rectal cancer. 13 Machine learning has found extensive application in disease prognosis prediction within the medical field in recent years. For instance, various machine learning methods have been employed to collaboratively predict the prognosis of distant metastasis in pancreatic cancer 14 and forecast new genes associated with community-acquired pneumonia. 15
This study involves the serological detection and examination of associations with related diseases among all patients diagnosed with CG at Xiangya Hospital of Central South University, Central Hospital of Shaoyang, The Second Affiliated Hospital of Nanhua University and the First People’s Hospital of Changde from 2010 to 2023. Machine learning techniques are employed to explore recurrence factors. Initially, a total of 378 patients were included, but some were subsequently excluded due to a lack of serological markers or unsuccessful follow-up. The objective of our study is to uncover the risk factors for CG recurrence and contribute to determining the prognostic risk for patients.
Methods
Patients enrolled
Ethical approval was obtained from the Ethics Review Committee of Xiangya Hospital, Central South University (Changsha, P. R. China), and written informed consent was obtained from all patients. Initially, 70 patients with more than 10% missing serological markers and 56 patients with failed follow-up were excluded. Following these exclusions, a total of 252 patients with pathologically confirmed glandular cystitis were included in this retrospective study, covering the period from July 1, 2013 to July 1, 2023. Subsequently, the entire CG patient cohort was divided into a training set and a testing set in a 7:3 ratio. All patients were followed up for 1 year, which included urinalysis, urosonography, cystoscopy, and biopsy of bladder lesions. The process is showed in Figure 1.
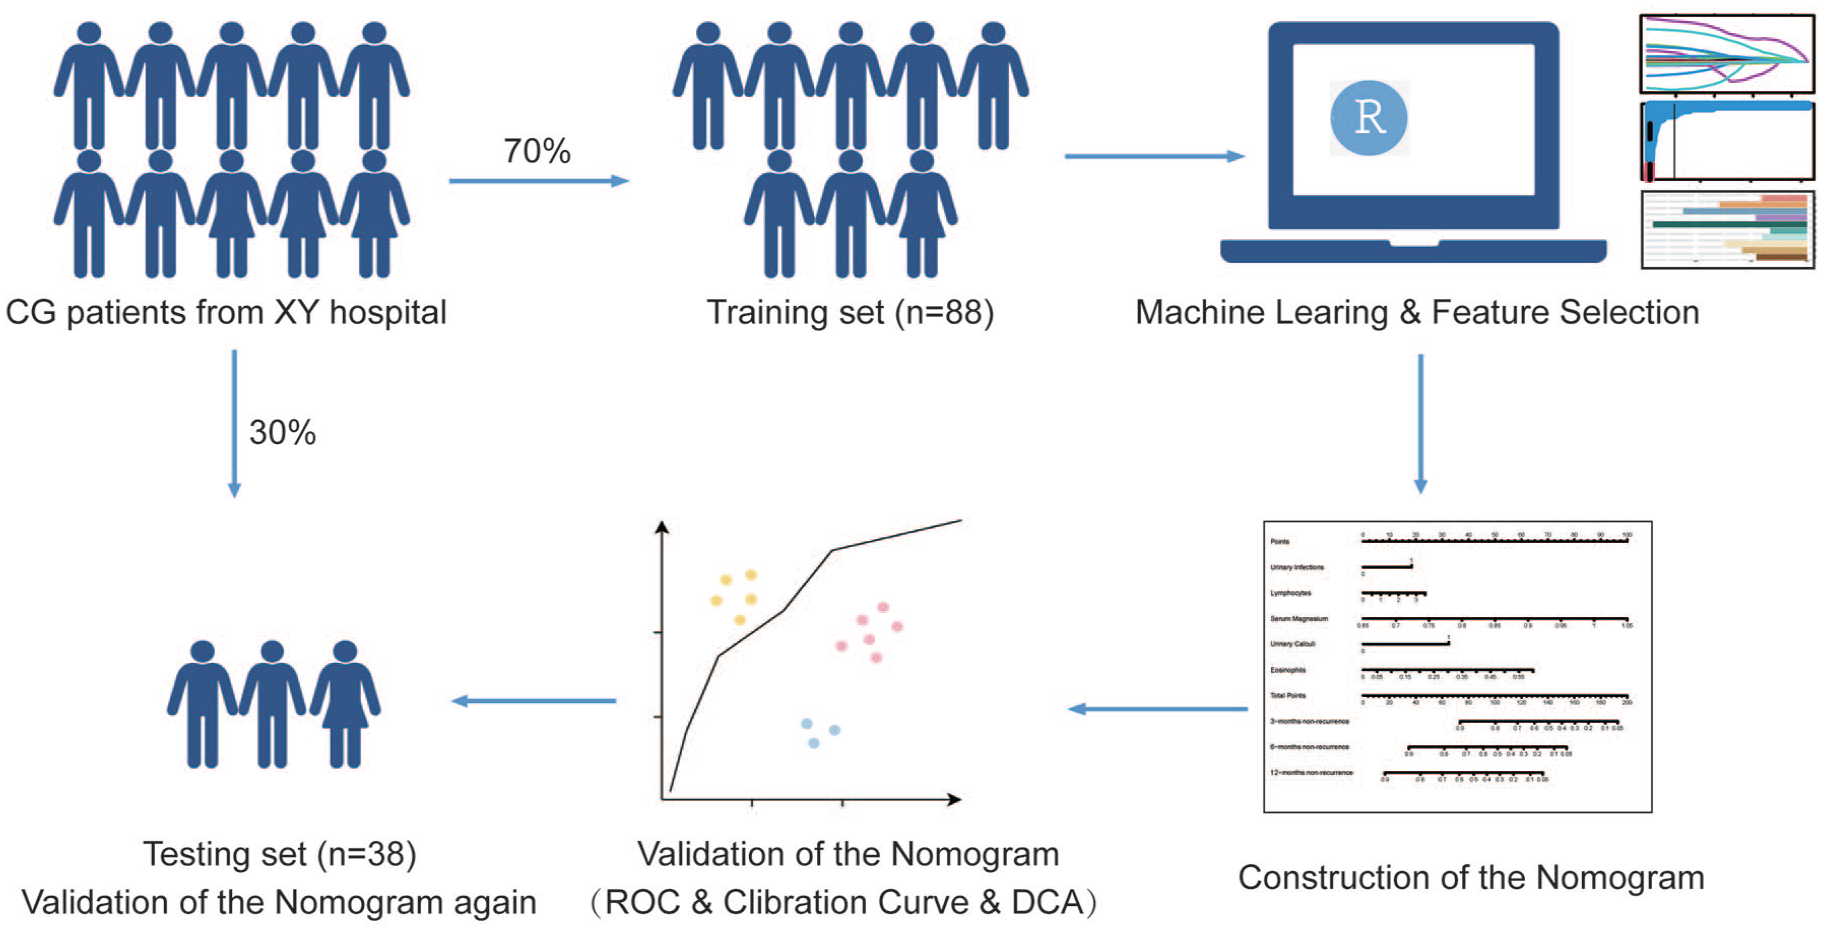
Flow chart of patient enrollment. After excluding patients who failed follow-up and with missing data, a total of 252 patients were enrolled. We constructed a training cohort and a validation cohort in a 7:3 ratio. In the training cohort, we used machine learning to construct a nomogram and verify its reliability. Finally, we validated the performance of the nomogram in the validation cohort again.
Data collection
We gathered demographic information (including age and gender), serological test indicators (such as white blood cells, red blood cells, platelets, serum ions), details of other urinary system complications or complications from other systems (e.g., urinary stones, urinary tract infections, hypertension), and follow-up information (including recurrence status and recurrence time). Missing serological test data were imputed using the mean or median based on their respective data types. In this study, CG recurrence was defined as the identification of a new CG lesion by cystoscopy following the complete removal of the primary CG lesion.
Feature selection by machine learning
Three machine learning algorithms were used to select the recurrence factors of CG, including random forests (RF) model,16,17 the least absolute shrinkage and selection operator (LASSO) regression model,18,19 and extreme gradient boosting (XGBoost) model.20,21 LASSO, employed as a dimensionality reduction method, was implemented using the R-package “glmnet” with the penalty parameter set through 10-fold cross-validation. RF performed recursive feature elimination to assess the weight of clinical features in CG and identified genes with relative importance greater than 0.025. Concurrently, XGBoost implemented variable filtering using the “XGBoost” package. The factors influencing CG recurrence were ultimately determined based on the overlapping results obtained from these three methods.
Construction of the nomogram
Utilizing the independent risk factors identified by the machine learning model, a nomogram was developed to predict the recurrence-free risk for CG patients at 3, 6, and 12 months, employing the “rms” package. Each variable was allocated on the nomogram based on its weight, resulting in a distinct line with points corresponding to each variable. The summation of points across all variables in the nomogram yielded a total score, enabling the determination of the recurrence-free risk rate at different time points.
Validation of the nomogram
The prediction ability of the nomogram was characterized using the receiver operating characteristic curve (ROC), and its area under the curve (AUC) was employed to assess its predictive efficacy. A larger AUC signifies a more accurate prediction by the model. Concurrently, the calibration curves, depicting the consistency between the model’s predicted survival probability and observed undesirable outcomes, were generated using the bootstrap method with 1000 re-samplings. Finally, decision curve analysis (DCA) was applied to evaluate the potential clinical utility of the new nomogram. ROC curves were plotted using the “pROC” package, calibration curves were generated with the “rms” package, and DCA was performed using the “ggDCA” package.
Statistics analysis
All statistical analyses were conducted using R 4.2 software (http://www.r-project.org) and SPSS (version 25.0, IBM). Continuous variables adhering to a normal distribution are presented as mean ± standard deviation, while variables not following a normal distribution are reported as “median Interquartile Range (IQR)”. T-tests and Mann–Whitney U tests were employed for the comparison of normally and nonnormally distributed variables, respectively. Categorical variables are described using frequency (%), and chi-square tests were used for the analysis of all categorical data. The statistical tests were two-sided, with p-values below 0.05 considered statistically significant. All relevant codes used in this article are included in Supplemental File 7.
Results
Patient characteristics
The patients were stratified into a training cohort (n = 176) and a validation cohort (n = 76), maintaining a 7:3 ratio. Among them, there were 154 males and 98 females, with recurrence rates of 53.4% in the training cohort and 65.8% in the validation cohort. The mean age was 46.216 ± 11.423 years in the training cohort and 47.947 ± 11.93 years in the validation cohort.
In both cohorts, seven clinical disease indicators, including urinary calculi and urinary tract infection, as well as 33 laboratory indicators such as white blood cell count, lymphocyte percentage, and serum magnesium ion concentration, were selected for data analysis. No significant differences were observed between the training cohort and the validation cohort concerning these variables (p > 0.05). In our study population, urethral stricture was present in 12.70% of patients, urinary calculi in 26.19%, urinary tract infection in 37.30%, hydronephrosis in 20.63%, coronary heart disease in 5.56%, hypertension in 16.67%, and urinary tract tumors (including kidney cancer, bladder cancer, prostate cancer, or renal pelvis/ureter tumor) in 6.35%. These baseline data are comprehensively presented in Table 1.
Patient characteristics table.

Coronary Heart Disease, **Mean Corpuscular Hemoglobin, ***Mean Corpuscular Hemoglobin Concentration.
Application of RF, LASSO, and XGBoost machine learning models
In this study, we utilized RF, LASSO, and XGBoost machine learning models for feature screening. Figure 2(a) depicts the results obtained through LASSO learning, highlighting the selection of eight predictors. Figure 2(b) illustrates the outcomes of RF screening, identifying predictors with an importance greater than 0.025. Additionally, Figure 2(c) presents the results of XGBoost screening, revealing the top 10 predictors. Integrating these screening outcomes using a Venn Diagram (Figure 2(d)), we ultimately identified five predictors—urinary infection, urinary calculi, eosinophil count, lymphocyte count, and serum magnesium ion concentration for constructing our prognostic model.
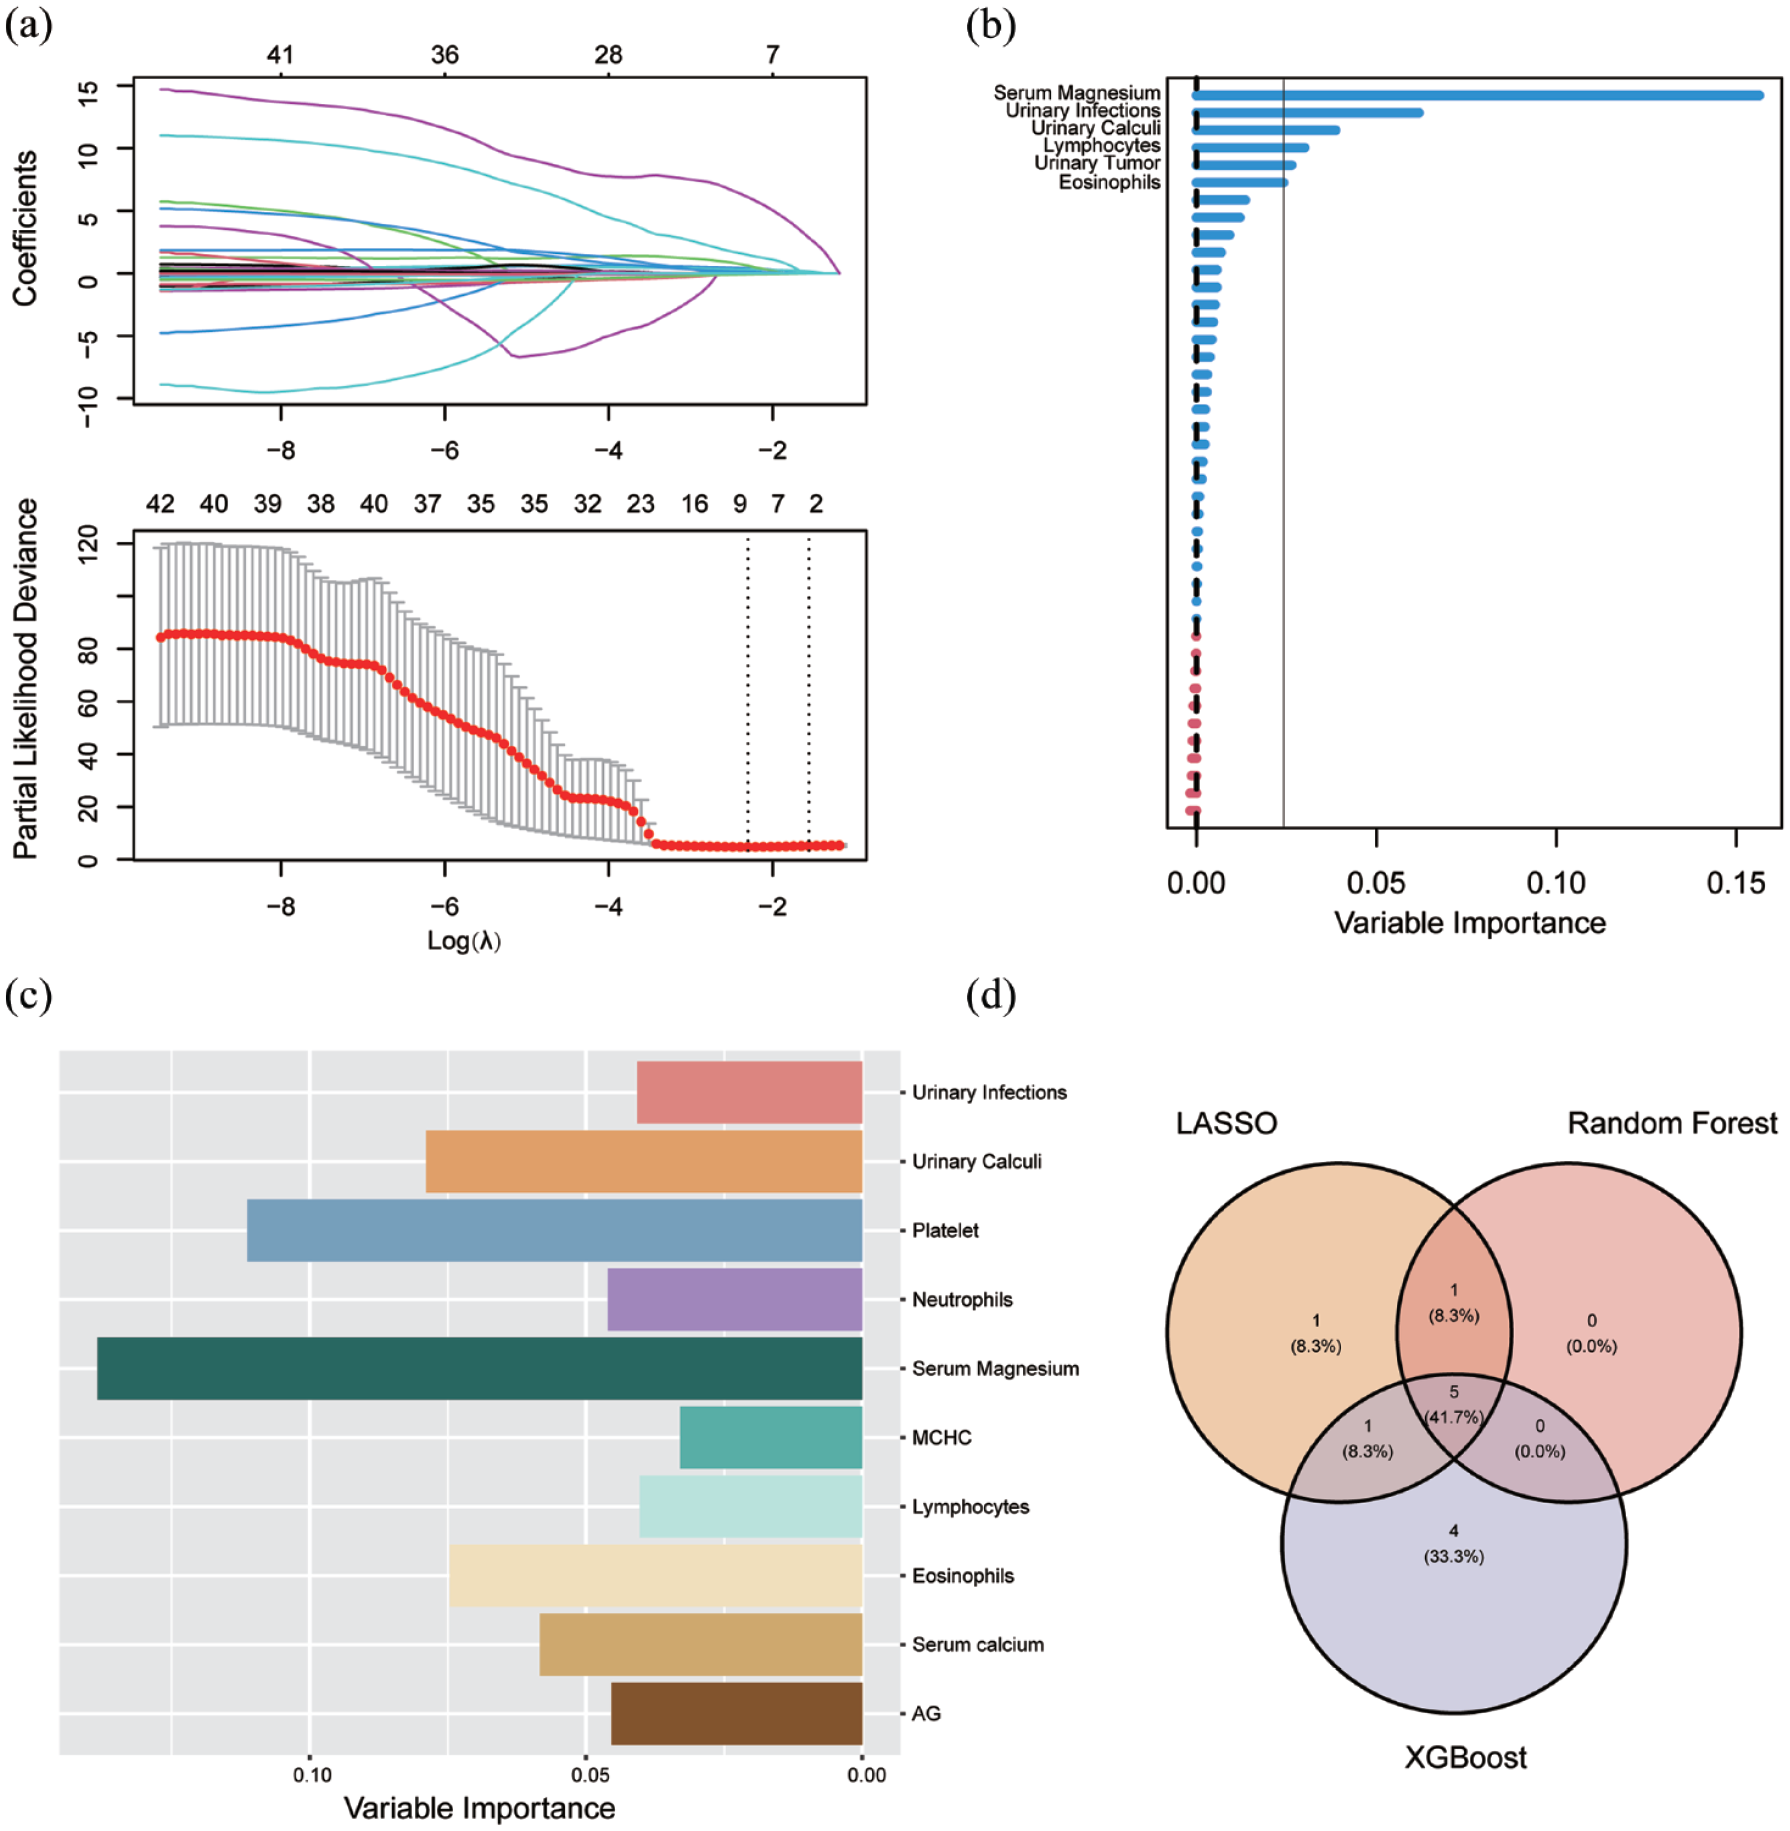
Outcomes of machine learning. Screening of possible prognostic factors for recurrence of cystitis using machine learning (a) data obtained by LASSO, (b) top five factors of significance screened by random forest, (c) top 10 factors of significance screened by XGBoost and (d) five common factors screened by Venn Diagram intersection of the above three methods.
Construction of nomogram
The five factors identified through the aforementioned regression analysis have been employed to construct a nomogram for predicting the recurrence of CG (Figure 3). Notably, serum magnesium ion concentration emerges as the most influential factor, with higher concentrations corresponding to greater point values. Eosinophil count ranks second in significance. Additionally, urinary calculi, urinary infection, and lymphocyte count are also recognized as risk factors for recurrence; among these three variables, urinary calculi exert a relatively stronger impact. By utilizing the provided data, one can derive a final score that enables the evaluation of the probability of recurrence at 3, 6, and 12 months using respective axes positioned at the bottom.
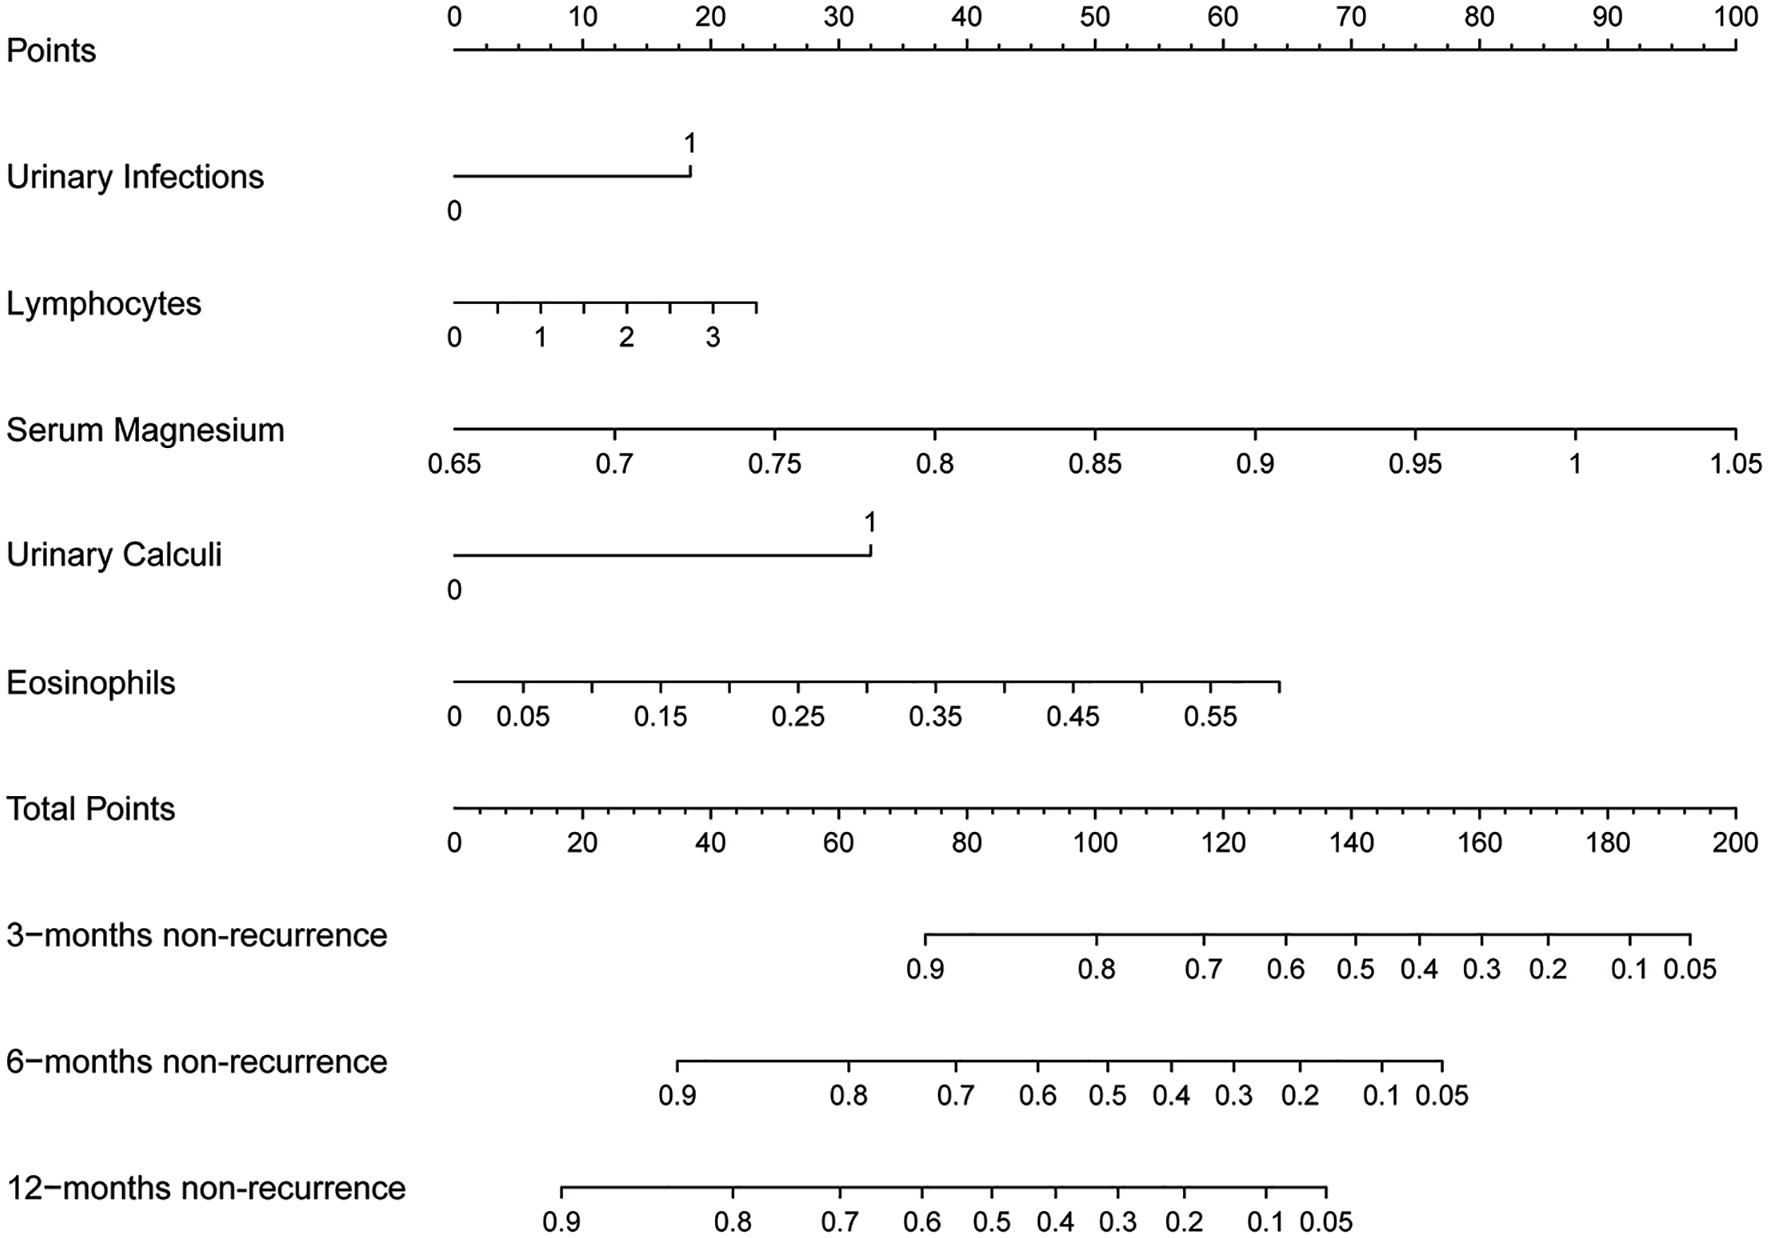
Nomogram of our prediction model.
Evaluation of machine learning model
The AUC was utilized in this study to assess and confirm the reliability and validity of the aforementioned nomogram. The AUC for 3-month recurrence was 0.855 in the training cohort and 0.95 in the validation cohort (Figure 4(a) and (d)). For 6-month recurrence, the AUC was 0.835 in the training cohort and 0.863 in the validation cohort (Figure 4(b) and (e)). The AUC for 12-month recurrence was 0.818 in the training cohort and 0.794 in the validation cohort (Figure 4(c) and (f)). These results suggest that our prediction model exhibits good performance.
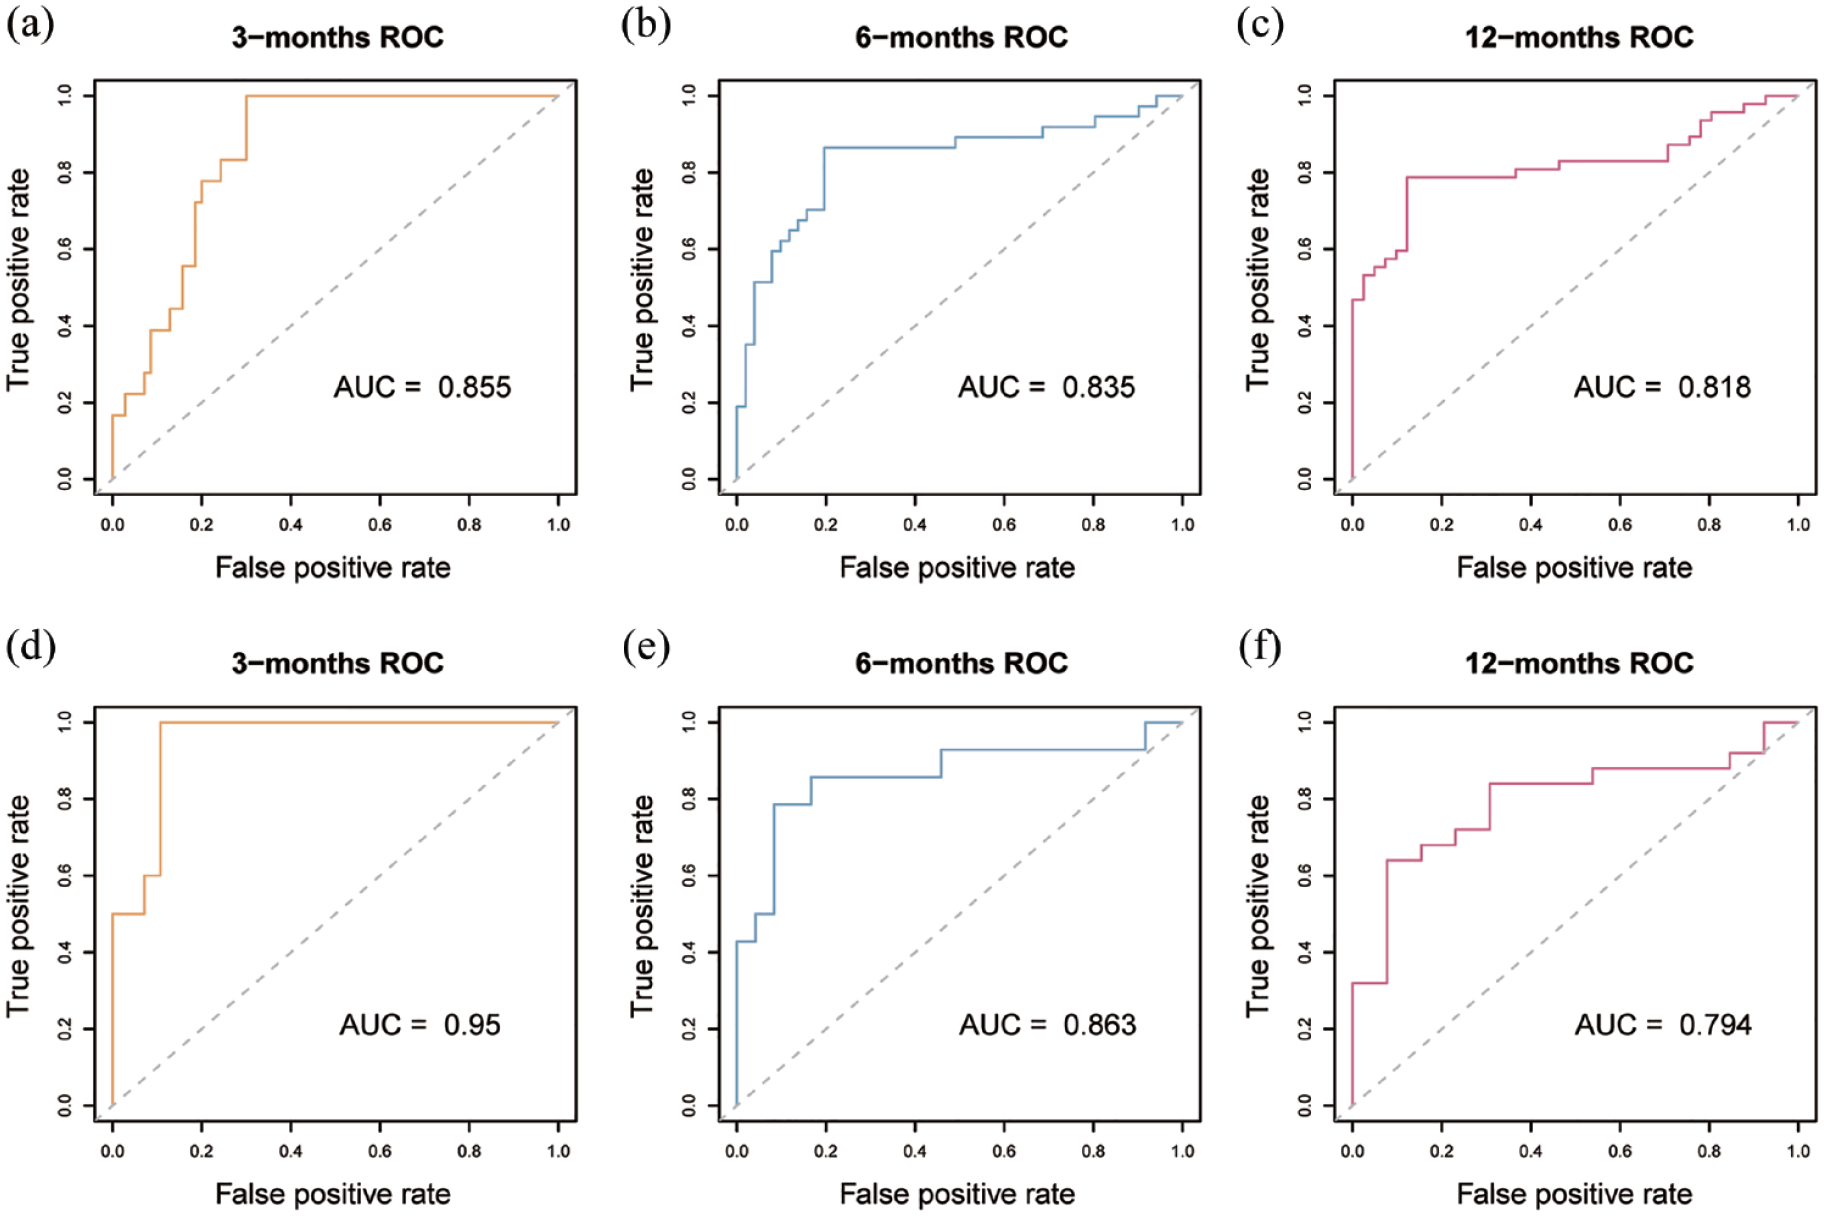
ROC curve of our nomogram. ROC curve for evaluating the performance of the nomogram The vertical axis is true positive rate, and the horizontal axis is false positive rate The gray dotted line has an AUC of 0.5, and the color broken line in the Figure is the research data (a) ROC of the training cohort for predicting 3-month recurrence, with an AUC of 0.855, (b) ROC of the training cohort for predicting 6-month recurrence, with an AUC of 0.835, (c) ROC of the training cohort for predicting 12-month recurrence, with an AUC of 0.818, (d) ROC of the validation cohort for predicting 3-month recurrence, with an AUC of 0.95, (e) ROC of the validation cohort for predicting 3-month recurrence, with an AUC of 0.863, and (f) ROC of the validation cohort for predicting 3-month recurrence, with an AUC of 0.794.
To assess the predictive performance of the regression line model in comparison to each individual factor, we concurrently generated ROC curves for all five individual factors (Supplemental Figures 1 to 5) and conducted a correlation analysis. The results indicated no significant correlation among the five factors (Supplemental Figure 6).
Evaluation and validation of nomogram
The performance of the nomogram was evaluated through clinical decision curves and calibration curves. Regarding calibration, both our training and validation cohorts illustrated that the nomogram prediction model closely aligned with the ideal condition represented by gray for 3-month recurrence (Figure 5(a) and (d)), 6-month recurrence (Figure 5(b) and (e)), and 12-month recurrence (Figure 5(c) and (f)), indicating its accurate predictive capability for CG recurrence. DCA further indicated that utilizing our nomogram model to assess recurrence and guide treatment decisions yielded greater benefits compared to employing all treatments directly at these three time points (Figure 6).

Calibration curves of our nomogram. Calibration curves for evaluating the performance of nomogram the vertical axis is the real probability of recurrence-free, the horizontal axis is the probability of recurrence-free predicted by the nomogram, the gray curve is the ideal case, and the blue broken line is the specific performance of the experimental data. (a–c) calibration curves for training cohort and (d–f) calibration curves for validation cohort.
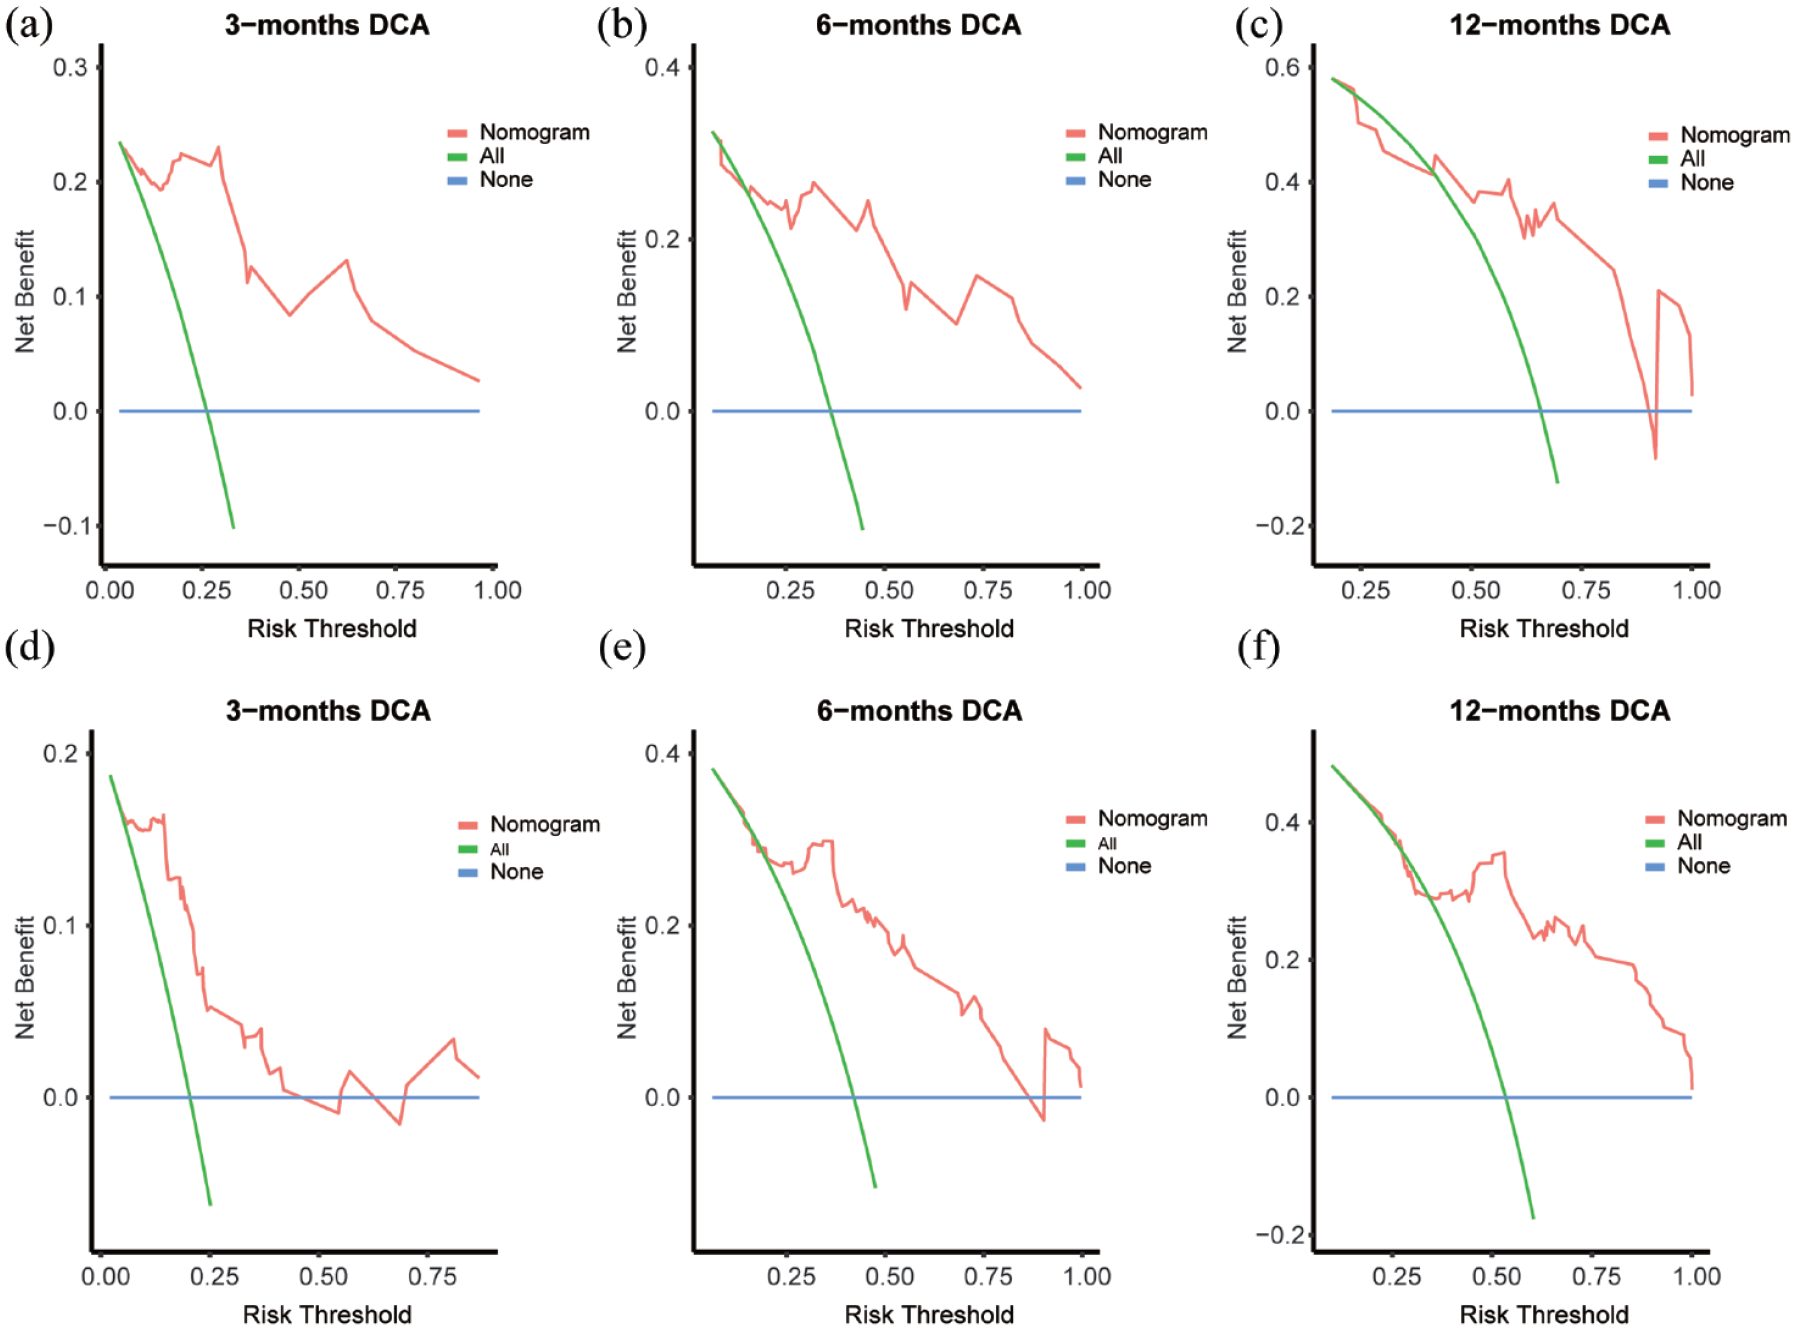
Decision curve of our nomogram. Decision curve for evaluating nomogram performance. The vertical axis represents benefit and the horizontal axis dipictsrelapse risk. The blue straight line indicates no treatment, the green curve suggests using all available treatments, and the red broken line suggests selectively using the corresponding treatment according to our predictive model. (a–c) training cohort decision curve and (d–f) validation cohort decision curve.
Discussion
Chronic diseases have emerged as significant contributors to the global economic and healthcare burden. They present challenges in terms of treatment, marked by a high risk of recurrence, prolonged symptoms, substantial financial costs, and diminished quality of life for patients, thereby exacerbating their overall impact.22,23 CG is one of the chronic inflammatory disorders that affect the urinary system. Patients may experience a range of symptoms, including increased frequency and urgency of urination, pain, hematuria, and, in some cases, dysuria, all attributable to cystitis. 4 In our study, we define CG recurrence as the reappearance of similar symptoms during follow-up after transurethral resection of bladder lesions in patients pathologically diagnosed with CG, while excluding other diagnoses (such as bladder cancer) or reoperations confirmed histopathologically as cystitis. This definition primarily emphasizes the recurrence of symptoms. Importantly, our survey data reveal an alarming total recurrence rate of 57.14% for cystitis, underscoring its chronic nature and highlighting the significance surrounding its recurrent manifestation. 24
Indeed, the etiology of recurrent CG remains a subject of extensive debate, encompassing various potential factors.25,26 For instance, various pathological features play a crucial role in the recurrence of adenomyosis. Specifically, the presence of metaplasia in patients may be associated with the malignant transformation of adenomyosis, warranting further investigation. 27
A major challenge in this field of research is the relatively low incidence of CG, which is significantly lower than that of urinary tract tumors such as bladder lesions. 28 Consequently, predicting the prognosis reasonably and effectively using systematic statistical methods becomes challenging, particularly due to the relatively low incidence of CG compared to urinary tract tumors such as bladder lesions. In this study, we retrospectively analyzed data from 252 patients with CG who underwent rigorous screening at four hospitals over a period of 14 years. Notably, our study uniquely combines nomogram and machine learning techniques for prognostic prediction. To the best of our knowledge, this study represents the inaugural application of machine learning techniques in generating a line chart for predicting factors contributing to adenomatous cystitis recurrence. In contrast to conventional statistical analysis methods, machine learning ensures analytical randomness and enhances result reliability, thereby rendering the line chart model more precise and applicable. The RF algorithm, chosen for its broad applicability irrespective of variable nature, provides visual insights into the importance of various predictive factors. This facilitates the selection of appropriate indicators for establishing a prognostic model. 29 On the other hand, XGBoost algorithm leverages decision tree theory to enhance accuracy in classification, regression, and sorting tasks. 30 The nomogram allows for visually evaluating individual recurrence risk by assigning specific scores based on indicator values; these scores can be conveniently and reliably summed up. 31
In our study, the prediction model comprises five predictive factors: urinary infection, urinary calculi, eosinophil count, lymphocyte count, and serum magnesium ion concentration. Notably, urinary calculi is a significant contributor to urinary tract infections and can lead to persistent complex infections that resist treatment.32,33 This perpetuates bladder wall inflammation and ultimately results in pathological changes associated with CG. Eosinophil and lymphocyte counts are commonly used serological indicators of inflammation and closely linked to pathophysiological processes such as infection and allergy.34 –36 Therefore, an increase in these cells may indicate local inflammatory reactions within the bladder and predict the recurrence of CG. Serum magnesium ion concentration is influenced by various factors, including abnormal thyroid hormone secretion, leading to magnesium ion imbalance. 37 In patients with CG, bladder lesions affecting the ureteral orifice can result in hydronephrosis 38 impairing renal function and obstructing magnesium ion excretion, thereby causing elevated concentrations. The AUC of our prediction model exceeded 0.75 at three time points for monitoring recurrence in both the training cohort and validation cohort, indicating excellent performance.
Numerous patients seek a follow-up examination for evident symptoms; however, a substantial number of patients experience asymptomatic recurrence following surgery. Without timely postoperative follow-up, the growth of CG tissue in the triangular area of the bladder may lead to ureteral orifice obstruction and subsequent hydronephrosis, potentially resulting in irreversible renal dysfunction in severe cases. This poses significant harm to patients. Our predictive model could predict the recurrence by considering various factors. For patients with a high risk of recurrence, we can implement more rigorous follow-up plans to facilitate early detection and provide appropriate clinical intervention to prevent both short-term and long-term complications.
Moreover, the ROC curve in this study offers the advantages of simplicity and reliability. The included factors are widely utilized in clinical practice, easily obtainable, and can be used by basic hospitals to conduct a preliminary assessment of patients’ risk of recurrence using simple blood tests, serum ion tests, and basic imaging examinations. This approach does not solely rely on pathological evidence, thereby helping to alleviate unnecessary economic burdens.
However, it should be noted that this study has certain limitations. First, given its retrospective nature, there might be a loss of follow-up bias and other confounding factors, potentially leading to inaccuracies in data analysis. Therefore, future prospective studies should be conducted to obtain more precise conclusions. Second, due to the small number of patients with CG included in this study, the final sample size after 14 years was only 252 cases. Gathering additional patient information in subsequent studies will enhance the reliability of our findings.
Conclusion
We utilized machine learning techniques to develop a nomogram for predicting the recurrence of CG, incorporating five predictors: urinary tract infection, urinary tract calculi, eosinophil count, lymphocyte count, and serum magnesium ion concentration. Our nomogram demonstrates good predictive ability, as assessed through the evaluation of AUC, decision curve, and calibration curve.
Supplemental Material
sj-doc-1-tau-10.1177_17562872241290183 – Supplemental material for A machine learning-based nomogram model for predicting the recurrence of cystitis glandularis
Supplemental material, sj-doc-1-tau-10.1177_17562872241290183 for A machine learning-based nomogram model for predicting the recurrence of cystitis glandularis by Xuhao Liu, Yuhang Wang, Yinzhao Wang, Pinghong Dao, Tailai Zhou, Wenhao Zhu, Chuyang Huang, Yong Li, Yuzhong Yan and Minfeng Chen in Therapeutic Advances in Urology
Footnotes
Acknowledgements
We would like to thank members of our team for their suggestions in processing the project and helpful feedback in drafting previous versions of this manuscript.
Declarations
The authors have no conflicts of interest to declare that are relevant to the content of this article.
Supplemental material
Supplemental material for this article is available online.
References
Supplementary Material
Please find the following supplemental material available below.
For Open Access articles published under a Creative Commons License, all supplemental material carries the same license as the article it is associated with.
For non-Open Access articles published, all supplemental material carries a non-exclusive license, and permission requests for re-use of supplemental material or any part of supplemental material shall be sent directly to the copyright owner as specified in the copyright notice associated with the article.