
Abstract
Background:
Oral testosterone undecanoate (TU) formulations may provide effective, safe, and easily titratable testosterone replacement therapy.
Objective:
Demonstrate efficacy and safety of a novel oral TU formulation.
Design:
An open-label, single-arm, multi-center trial treated 155 hypogonadal men for 180 days. Treatment began at 200 mg TU twice daily with meals; doses were titrated over two 28-day cycles to between 100 and 800 mg TU daily, measuring average testosterone (T Cavg) after 90 days. Ambulatory blood pressure monitoring (ABPM) occurred at baseline, 120, and 180 days.
Methods:
Titrations used a randomized blood sample taken 3-, 4-, or 5-h post-morning dose. Outcomes used sodium fluoride/ethylenediaminetetraacetate plasma testosterone (T) values; serum results were also reported. Blood pressure (ABPM and in-clinic) was evaluated for change from baseline.
Results:
After titration, 87.8% of KYZATREX™ treated participants (worse-case scenario) and 96.1% of 90-day completers achieved eugonadal mean plasma T values. Serum T Cavg was 452 ng/dL and maximum T concentrations (T Cmax) met all FDA criteria. Participant eugonadal percentages were comparable across subgroups for age, weight, and body mass index. Diet had no effect on participant eugonadal percentages. KYZATREX was well tolerated, with no drug-related serious adverse events (SAE) and one adverse drug reaction (hypertension) observed in 2% or more of participants. Systolic ambulatory blood pressure increased 1.7 mmHg (95% confidence interval: 0.3–3.1). At baseline, 36% of 155 participants were receiving anti-hypertensive medication and 22% were diabetic. No dose increases occurred in existing anti-hypertensive medication; five participants (3.2%) started anti-hypertensive medication.
Conclusion:
KYZATREX provided safe and effective testosterone levels within the normal range in hypogonadal male study participants.
Clinical trial registration:
URL: https://clinicaltrials.gov/ unique identifier NCT04467697, conducted under NCT03198728. Post-completion, clinicaltrials.gov requested creation of the separate NCT04467697 identifier. All subjects were recruited under NCT03198728.
Introduction
Male hypogonadism is a condition in which the testes fail to produce physiological levels of testosterone (T). 1 Primary hypogonadism may result from chromosome abnormality (e.g. Klinefelter syndrome), testicular surgery/disease, infection, mumps orchitis, radiation, and renal failure. Central or secondary hypogonadism involves disruption of the hypothalamic–pituitary–testicular axis and may result from hypopituitarism, selective gonadotropic deficiency, severe systemic illness, or the patient being severely underweight.
Hypogonadism is characterized by serum T levels <300 ng/dL in combination with at least one clinical sign or symptom consistent with diagnosis. 2 Signs of hypogonadism include absence or regression of secondary sex characteristics, anemia, muscle wasting, reduced bone mass or bone mineral density, oligospermia, and abdominal adiposity.
Symptoms of postpubescent hypogonadism include sexual dysfunction (erectile dysfunction, reduced libido, diminished penile sensation, difficulty attaining orgasm, and reduced ejaculate), reduced energy and stamina, depressed mood, increased irritability, difficulty concentrating, changes in cholesterol levels, anemia, osteoporosis, and hot flashes. 3
Testosterone deficiency in men is implicated as a risk factor for metabolic syndrome and Type 2 diabetes and is independently associated with components of the metabolic syndrome – visceral obesity, insulin resistance, hyperglycemia, hypertension, and dyslipidemia. 4 Epidemiological studies report increased mortality in men with low T. 5
Several products have been approved for testosterone replacement therapy (TRT) in the United States of America (USA). 1 They contain either T, a T prodrug (i.e. T ester), or an active derivative of T (i.e. methyl derivative). Testosterone and related substances are Schedule III non-narcotic controlled substances in the USA. Routes of administration include implantable pellets, intramuscular injections, transdermal, buccal, nasal, and oral formulations. T products are indicated for TRT in males with a deficiency or absence of endogenous T due to primary or secondary hypogonadism. Side effects common to all TRT products include increases in hematocrit and prostate-specific antigen (PSA), changes in lipid levels, sleep apnea, and increases in blood pressure. These side effects are well characterized in product labeling and scientific literature. Results of long-term cardiovascular safety of TRT in men 45–80 years with hypogonadism and preexisting or a high risk of cardiovascular disease (TRAVERSE; NCT03518034) were recently published. Testosterone-replacement therapy was noninferior to placebo with respect to the incidence of major adverse cardiac events (MACE). 6
Five oral preparations are currently available in the USA. The two oldest, methyltestosterone and fluoxymesterone, are associated with liver toxicity.1,2 Three oral testosterone undecanoate (TU) preparations have recently received approval from the US FDA: JATENZO™ was approved in March 2019, TLANDO™ was approved in March 2022, and KYZATREX™ was approved in July 2022.7–9
Materials and methods
MRS-TU-2019EXT was a 6-month single-arm phase III study performed to evaluate KYZATREX in hypogonadal men for efficacy and safety, including the use of ambulatory blood pressure monitoring (ABPM). Study subjects participated from November 2018 through October 2019 at 19 clinical sites located in the USA. Single-arm studies are appropriate for TRT products as the efficacy endpoint is pharmacokinetic measurement (PK)-based. An earlier phase III study, MRS-TU-2019 (ClinicalTrials.gov identifier: NCT03198728), was a 12-month randomized two-arm study of the same formulation in hypogonadal men with a safety control arm of a topical testosterone gel administered per the approved label; this study took place from July 2017 through March 2019.
Drug product
KYZATREX (known as SOV2012-F1 during clinical evaluations) is a Self-Emulsifying Drug Delivery System containing propylene glycol monolaurate (Type II), polyoxyl 40 hydrogenated castor oil, phytosterol esters, DL-alpha-tocopheryl acetate, and TU enclosed in a soft gelatin capsule. The drug product was provided in strengths of 100, 150, and 200 mg TU per capsule. 9
Bioanalytical methods
Testosterone in the study was measured using plasma and serum samples. Samples collected in standard serum tubes were allowed to clot for 30 min at ambient conditions and processed to serum. Plasma tubes contained sodium fluoride/ethylenediaminetetraacetate (NaF/EDTA) and were chilled immediately after collection and then processed to plasma. The sodium fluoride and chilled handling inhibit post-sample collection conversion of TU to T by endogenous esterases, which otherwise inflate the measured T concentration.10–12 Post-collection conversion of TU to T proceeds more rapidly in serum tubes and the ratio of the serum and NaF/EDTA plasma T values is diagnostic of proper sample handling. Sodium fluoride also contributes a matrix effect to the analysis of T and its metabolite dihydrotestosterone (DHT), and therefore, assessment of analyte normal ranges in NaF/EDTA plasma tubes is required for clinical trials of the safety and efficacy of TU medications. Analysis of T, DHT, TU, dihydrotestosterone undecanoate (DHTU), and estradiol (E2) were conducted using validated liquid chromatography-mass spectrometry/mass spectrometry (LC-MS/MS) methods.
Patient population
In MRS-TU-2019EXT, 155 men were treated and followed over a period of approximately 8.5 months (enrollment through 180 days of dosing and follow-up). The primary inclusion criteria were age between 18 and 65 years, hypogonadism diagnosed clinically by symptoms or signs consistent with diagnosis, and hypogonadism verified by morning serum T below the lower limit of normal (281 ng/dL) of the immunoassay used for screening (blood samples collected between 7 a.m. and 10 a.m. on two separate occasions, at least 3 days apart). Participants were either naïve to androgen therapy or were required to be washed out from previous treatment. Key exclusion criteria were having an unstable ongoing medical condition or a PSA above 2.5 ng/mL. As TRT is known to increase red blood cell mass, participants were required to have Hgb ⩽ 16 g/dL at baseline (⩽17 g/dL for TRT use within 30 days prior to screening). Prohibited medications included those that could affect total T-levels, -metabolism, or -metabolite levels (e.g. 5-alpha-reductase inhibitors, anti-androgens, estrogens, human growth hormone, or long-acting opioid analgesics), as well as any nutritional supplements that could affect T concentrations. Additional inclusion and exclusion criteria are found at ClinicalTrials.gov (NCT04467697).
Participants from either the KYZATREX or AndroGel™ arms of MRS-TU-2019 (NCT03198728) were eligible to enroll in MRS-TU-2019EXT after an 8-week washout period. Additionally, new participants were recruited, screened, and enrolled; those receiving prior TRT were enrolled only after adequate washout (up to 6 months for implanted pellets).
Normal range of testosterone
The normal range (2.5th–97.5th percentile) of T was determined in 105 healthy adult males using serum and NaF/EDTA plasma samples using validated assays. The volunteers had ages of 18–40 years (median 25 years) and body mass index (BMI) range of 17.7–30.0 kg/m2 (median of 24.7 kg/m2). For T in NaF/EDTA plasma samples, the normal range was 222–800 ng/dL. For serum samples, the normal range was 286–991 ng/dL. These normal ranges were used for efficacy outcome determinations. Analysis of normal range samples used the same sample collection procedures validated bioanalytical methods, and bioanalytical laboratory as the clinical study.
Primary and secondary study endpoints
The primary endpoint of this trial was defined as the percentage of participants with a 24-h mean concentration of T within the NaF/EDTA plasma assay normal range after 90 days of treatment and the change from baseline in the 24-h mean systolic blood pressure (SBP) as measured by ABPM after 120 days of treatment.
A key secondary endpoint of this study was the percentages of participants after 90 days of treatment with maximum T concentration (Cmax) versus three FDA-defined threshold levels and allowed percentages. The FDA thresholds were originally stated in terms of serum T values 13 and subsequently restated as multiples of the upper limit of the normal (ULN) range in the labels of the approved oral TU products.7–9 The thresholds and allowable percentages of participant T Cmax are listed in Table 1.
Secondary endpoint Cmax criteria.

EDTA, ethylenediaminetetraacetate; NaF, sodium fluoride; ULN, upper limit of normal.
Additional secondary endpoints included:
Change from baseline in 24-h mean SBP measured by ABPM after approximately 180 (±3) days of treatment,
Change from baseline in 24-h mean diastolic blood pressure (DBP) measured by ABPM after 120 (±3) and 180 (±3) days of treatment,
Change from baseline in 24-h heart rate (HR) measured by ABPM after 120 (±3) and 180 (±3) days of treatment,
Change from baseline in BP and HR measured in clinic after 120 (±3) and 180 (±3) days of treatment,
Correlation of T levels obtained in serum tubes and NaF/EDTA plasma tubes.
Safety endpoints included the incidence of adverse events (AE), serious adverse events (SAE), and AEs leading to study withdrawal during treatment; observed and change from baseline for in-clinic BP and HR; observed, change from baseline and percent change in laboratory parameters including liver function tests (LFT), hemoglobin (Hgb), hormone levels (luteinizing hormone, LH; follicle-stimulating hormone, FSH; DHT; sex hormone binding globulin, SHBG; and thyroid stimulating hormone, TSH), lipid profiles, blood chemistry, and serum PSA.
Study design and titration procedure
Participants were either newly recruited or participated in the previous 12-month study (MRS-TU-2019) of the same KYZATREX formulation which used different titration criteria and doses. All participants were completely washed out of any previously approved or investigational TRT for at least 2 weeks before the beginning of treatment (longer times for depot-type TRT). Figure 1 outlines the disposition of participants for MRS-TU-2019EXT.

Participant disposition for MRS-TU-2019EXT study population.
Prior to the beginning of treatment, all participants completed the National Institute of Health ASA24® dietary assessment tool to identify diet habits for meals to be consumed on trial days on which PK samples were obtained. 14 Participants were classified into low-, moderate-, and high-fat categories for each of breakfast and dinner. Breakfast and dinner meals were designed to deliver varying percentages of calories from fat: low-fat meals (⩽20% calories from fat), normal-fat meals (>20–35%), and high-fat meals (>35%). All lunches were normal fat as no drug was administered with lunch. Meal consumption for breakfast and dinner was recorded for all PK collection visits. Participants were instructed to take KYZATREX capsules with water 30 (±5) min after the start of the morning and evening meals (breakfast only for the 100 mg dose level).
Treatment was initiated with a starting dose of 400 mg TU given as 200 mg twice daily with breakfast and the evening meal. After 14 days, a 6-h PK sampling period was used to collect plasma (and serum) samples from which a titration decision would be based on the T-concentration in either the 3-, 4-, or 5-h plasma sample according to a randomization schedule. The titration decision was implemented on the 28th day of dosing. A second titration cycle was conducted in the same manner on the 42nd and 56th days of treatment. All titration decisions were determined centrally and communicated through interactive web response technology.
The primary endpoint of percent of participants in the normal range was assessed by a 24-h PK measurement (T Cavg) using NaF/EDTA plasma samples after 90 days of treatment. Serum T was assessed in a sub-study group on Day 90 as well. After the two cycles of titration, participants could be at daily dose levels of 100 (morning only), 200, 400, 600, or 800 mg using capsule strengths of 100, 150, and 200 mg. Participants continued at their Day 90 dose for the remainder of the study to 180 days.
The titration algorithm used is provided in Table 2, noting that all doses are taken with meals.
Titration algorithm of KYZATREX dose in MRS-TU-2019EXT.

EDTA, ethylenediaminetetraacetic acid; NaF, sodium fluoride.
The day prior to treatment initiation, a 24-h ABPM and in-clinic assessment (SBP, DBP, HR, arterial pressure, and pulse pressure) was completed to establish the BP baseline. After 120 and 180 days of treatment, the 24-h ABPM assessment was repeated. This design allowed assessment of whether treatment-related changes in BP and HR continued or plateaued between the Day 120 and Day 180 treatment assessments. In-clinic BP and HR were collected at scheduled visits.
Pharmacokinetic and efficacy assessments
Efficacy assessment was based on the percentage of treated participants whose 24-h T Cavg was within the NaF/EDTA plasma normal range. The T Cavg was calculated using actual sample times, and the percentage of participants within the normal range calculated using a worse-case scenario (WCS) that treated study drop-outs as treatment failures. The percentage of participants achieving T Cavg within the normal range was also assessed as a function of the Day 42 sample time (3-, 4-, or 5-h post-dose) used for determination of the titration decision.
Sample times for PK assessment were chosen to maximize the density of sampling around the expected time of maximum T concentration. Samples for PK assessments were collected at 0, 1.5, 3, 4, 5, 6, 8, 12, 13.5, 15, 16, 17, 18, 20, and 24 h after the Day 90 morning dose. On Days 14 and 42, samples (plasma and serum) were collected at 0, 1.5, 3, 4, 5, and 6 h only; the 3-, 4-, or 5-h plasma sample was used for making the titration decision as described above. Free T concentrations were calculated according to Vermeulen. 15
Safety assessments
Safety was assessed through the secondary endpoints and through recording SAE, treatment-emergent adverse events (TEAEs), and routine hematology and clinical chemistry [including glycosylated Hgb (HbA1c), PSA, and lipid profiles]. Hematocrit in blood samples is not stable over a period of days, and as clinical chemistry assessments were carried out by a central laboratory, Hgb was used to monitor red blood cell mass. 16
Vital signs were monitored in-clinic and ABPM (Spacelabs Medical Model 90207; Redmond, Washington, USA) was used to obtain 24-h profiles on Day 0 (pre-treatment), Day 120, and Day 180. In-clinic BP was obtained in triplicate using the non-dominant arm between 7 a.m. and 9 a.m. for all visits, using the same automated BP device and cuff for each visit to improve reproducibility.
Statistical methods and data analyses
The first approach to sample size considered the T Cavg and T Cmax endpoints: estimating 86% of subjects within the Day 90 normal range (based on phase II clinical results) and estimating 17% unevaluable rate, a total of 151 subjects should be enrolled so that the lower bound of the 95% confidence interval (CI) would be greater than 65%. The second approach to sample size considered the ABPM endpoints and is described in White et al. 17 All statistical analyses were conducted using SAS® Version 9.4 or higher (SAS, Cary, NC, USA). Summary statistics for continuous outcomes included number of non-missing observations, mean, standard deviation, coefficient of variation, median, minimum, and maximum values. Categorical variables were summarized using frequencies and percentages. Percentages were calculated using the number of participants in the analysis set or the number of participants with a non-missing value.
A logistic regression approach was used to assess the impact of body weight, diabetic status, and antihypertensive therapy status on the Day 90 final dose. Dose was assigned to three categories: 800, 600, and ⩽400 mg. Weight was categorized as >93 or ⩽93 kg, while the other categories were with or without diabetes (HbA1c below or above 6.5%) at baseline and with or without antihypertensive medications at baseline. The presence of antihypertensive treatment was considered a more reliable assessment of hypertensive status than the baseline BP measurement.
Serum sub-study
After initiation of the trial, a sub-study was added to the protocol for assessment of the Day 90 24-h PK of T and DHT by serum samples. Serum samples (in addition to NaF/EDTA plasma) were collected for 89 participants in the study and evaluated against the primary and secondary endpoints for T Cavg and Cmax.
Evaluation of food effects on efficacy
The effect of diet choice was explored in two ways: first, geometric least squares mean (GLSM) ratios were calculated for T Cavg and T Cmax across breakfast diet categories (low-, normal-, and high-fat); second, the percentage of participants achieving the normal range on Day 90 was evaluated for breakfast diet categories.
Results
Patient characteristics and disposition
A total of 155 study participants were enrolled who received at least one dose of KYZATREX, and of these, 153 had an evaluable ambulatory BP at baseline, and two were discontinued from study. One hundred forty-six participants attended Day 90 (94.2%), 140 (90.3%) participants attended Day 120, and 135 (87.1%) attended Day 180. The primary reasons for discontinuation of study drug were withdrawal by the participant (5.8%), lost to follow-up (3.9%), AEs (1.3%), and other (2.6%). Mean study drug compliance during the study up to Day 90 is reported in Table 3 (compliance = drug dispensed minus drug returned, divided by drug assigned).
MRS-TU-2019EXT study drug compliance at Day 90.
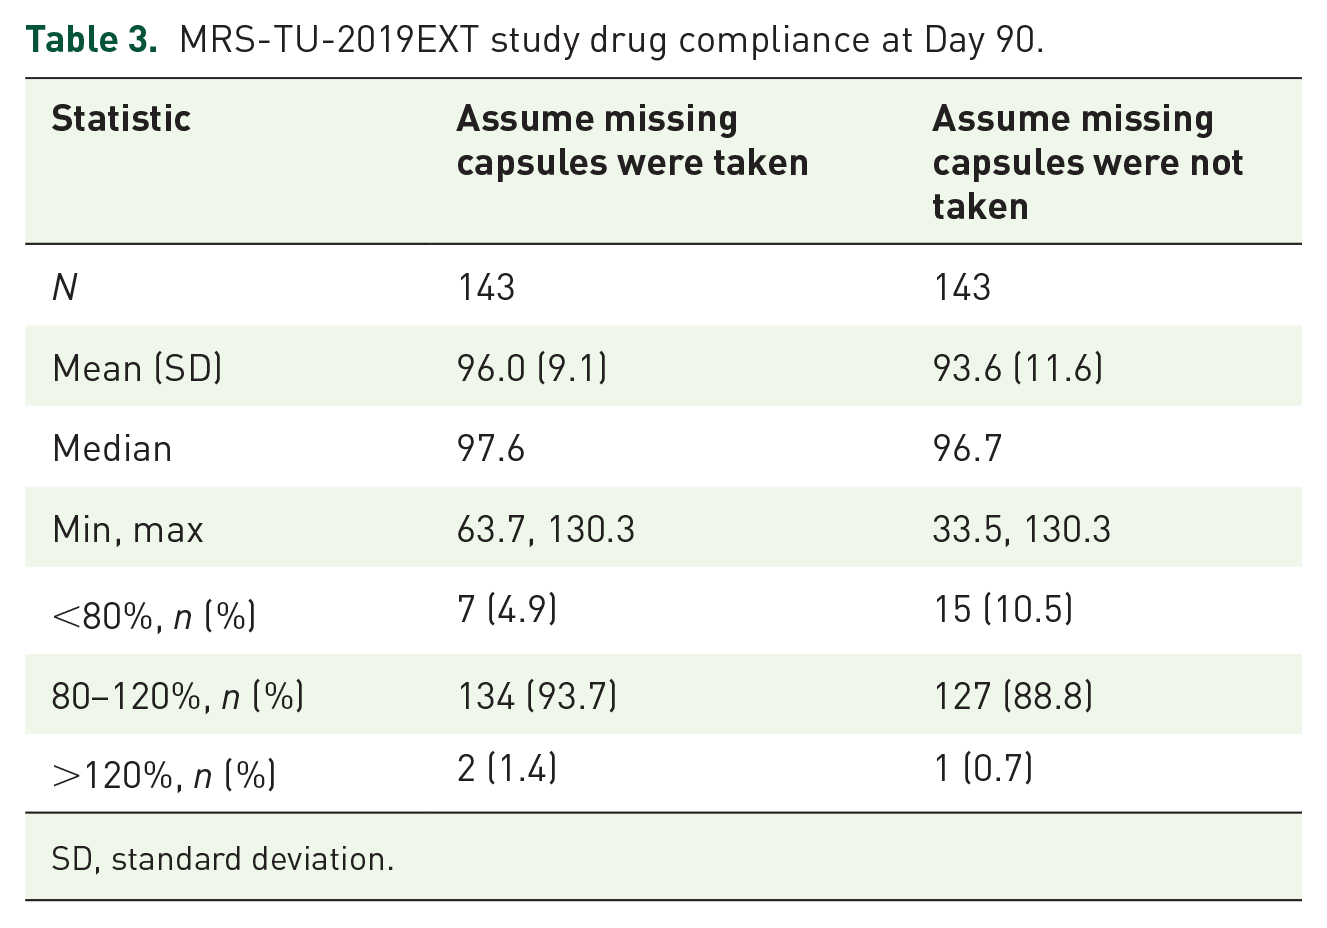
SD, standard deviation.
Table 4 presents demographic and baseline characteristics for participants completing Day 90 with valid PK samples. After conduct of the trial, investigation into unusual patterns of PK results convincingly identified sample mishandling at a single site, and that site’s 16 participants were not included in calculation of PK-based outcomes but were included in all non-PK (safety) analyses. This single site accounts for the difference between the initial N = 155 treated participants and the N = 139 of Table 4, which is the population for the reported primary efficacy and secondary Cmax outcomes. Primary hypogonadism at baseline was assigned on the basis of LH and FSH above the upper limit of normal; secondary hypogonadism was assigned on the basis of LH and FSH within or below the normal range.
MRS-TU-2019EXT participant demographic and baseline characteristics.
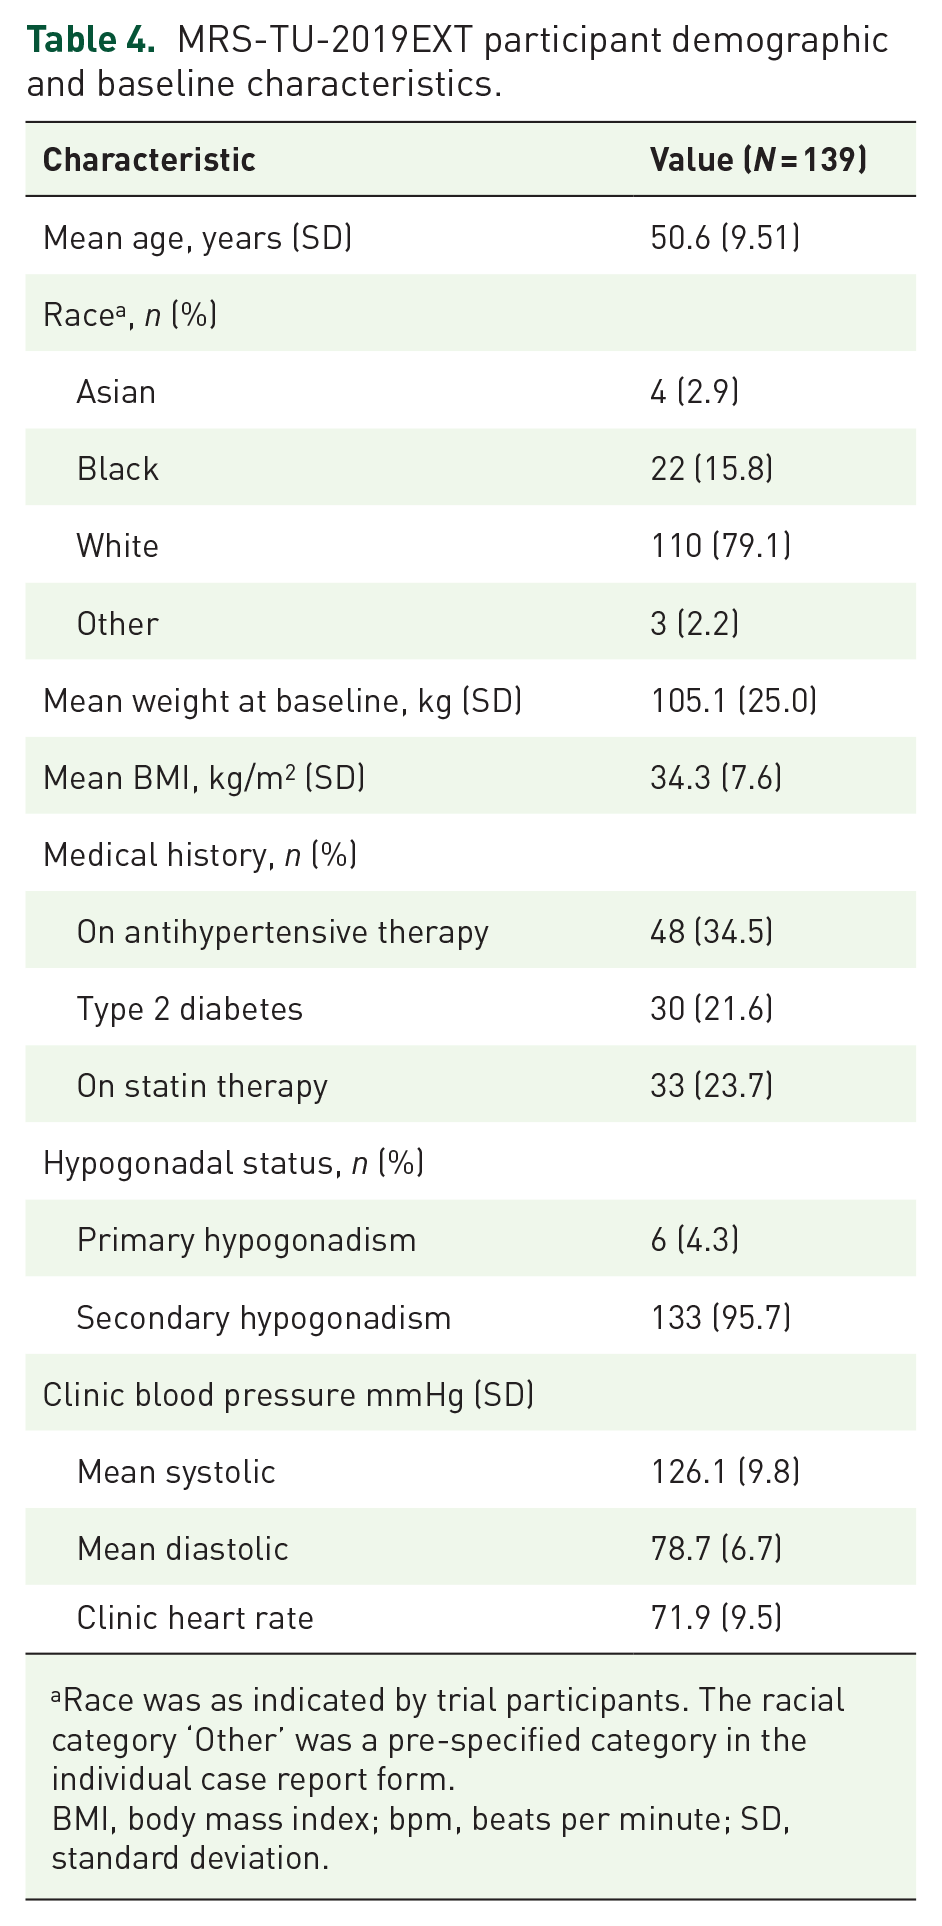
Race was as indicated by trial participants. The racial category ‘Other’ was a pre-specified category in the individual case report form.
BMI, body mass index; bpm, beats per minute; SD, standard deviation.
Primary endpoint: efficacy and titration scheme
The FDA criteria for efficacy of TRT requires at least 75% of participants, using a WCS approach, achieve a T Cavg in the normal range after 90 days of treatment, with the lower bound of the 95% CI ⩾65% of participants. Table 5 shows percentage in the normal range for the trial population, the serum sub-study, and subgroups of weight, age, BMI, and race.
Percentage in normal range, NaF/EDTA plasma testosterone. a .

Results for serum substudy only are reported for serum testosterone.
Race was as indicated by trial participants. The racial category ‘Other’ was a pre-specified category in the individual case report form.
BMI, body mass index; CI, confidence interval; T, testosterone; Wt, weight.
Translation of plasma titration results to serum titration scheme
To determine serum-based titration thresholds for use in clinical practice, the correlation between serum and NaF/EDTA plasma T-concentrations was used empirically to include contributions from all effects, including bioanalytical and sample stability. Figure 2 shows the regression of the serum results as a function of the NaF/EDTA plasma results from Day 14 and Day 42 for 3- to 5-h, the titration window used for dose adjustments. The vertical bars indicate the 400 and 900 ng/dL plasma titration thresholds used in MRS-TU-2019EXT.

Scatter plots of MRS-TU-2019EXT serum T versus plasma T concentration: Hours 3, 4, and 5; Passing–Bablok and ordinary least-squares regression.
Using the ordinary least squares regression equation from Figure 2, the equation for prediction of serum values from the NaF/EDTA plasma value is:

The resulting serum-based titration thresholds compared to the plasma thresholds are shown in Table 6. The Passing–Bablok regression was performed to check for the effect of uncertainty in the plasma results. Using the Passing–Bablok equation of fit, the predicted lower and upper serum thresholds are 433 and 974 ng/dL. These values approximate the ordinary least squares results, particularly at the upper threshold which serves to limit Cmax excursions and keep Cavg in the normal range.
Kyzatrex plasma-based and serum-based titration thresholds.

Calculated using ordinary least squares equation.
EDTA, ethylenediaminetetraacetic acid; NaF, sodium fluoride.
Dose and impact of baseline characteristics
The distribution of final doses is provided in Figure 3. The logistic regression analysis of the impact of baseline characteristics on final dose demonstrated that body weight and diabetic status were positively associated with higher final dose (⩽400, 600, or 800 mg) with odds ratios of 3.928 (95% CI: 1.896–8.137) and 2.646 (95% CI: 1.111–6.300), respectively. In contrast, use of antihypertensive medication had no influence on final dose.

Final dose distributions after 90 days of treatment with KYZATREX.
Effect of dose titration sample time on efficacy
To test the effect of titration time-point on efficacy results, analysis of the percentage of T Cavg within the normal range after 90 days of treatment was conducted as a function of the time point used from the sampling day. The percentages within the normal range after 90 days of treatment were compared for participants for which the Day 56 titration decision was based on a sample taken at 3-, 4-, or 5-h post-morning dose on Day 42. Use of the serum sub-study results also allowed comparison between serum and plasma T results. Overall, no significant differences in the percent of participants in the normal range, serum, or plasma were observed between the 3-, 4-, or 5-h post-dose sample collection times (see Table 7).
Percent in normal range where 3-, 4-, or 5-h samples from Day 42 were used for titration decision on Day 56.

EDTA, ethylenediaminetetraacetic acid; NaF, sodium fluoride; T Cavg, average observed testosterone concentration.
Effect of diet on efficacy
The impact of diet on T Cavg and percent of participants within the normal range following KYZATREX administration was evaluated in MRS-TU-2019EXT. Since titration sampling occurs after the morning meal, it is also important to show that participants can be titrated into the normal range regardless of morning meal type and that variation in meal type has limited effect on PK parameters.
The percentage of participants with plasma T Cavg within the normal range after 90 days is presented by meal type in Table 8. Meal type appeared to have little effect on the T Cavg on Day 90 when the normal-fat and high-fat diet groups were compared. Comparisons of Cavg and Cmax GLSM values as ratios between the breakfast types are shown in Table 9.
Day 90 plasma T Cavg and percent in normal range versus breakfast type.

CV, coefficient of variation; T, testosterone; WCS, worse-case scenario.
Comparison of testosterone pharmacokinetic parameters for Day 90 breakfast type categories.

CI, confidence interval; GLSM, geometric least squares mean.
Pharmacokinetic results
Table 10 presents selected Day 90 PK parameters for the efficacy population and the serum sub-study population (excluding the non-compliant site from both populations). The T, DHT, TU, and DHTU analyses were in NaF/EDTA plasma samples; E2 was measured in plasma. The Day 90 serum measurements for T and DHT were collected from the serum sub-study participants. Figure 4 presents the NaF/EDTA plasma and serum 24-h Day 90 PK profiles.
Testosterone pharmacokinetic parameters after 90 days of treatment with KYZATREX.
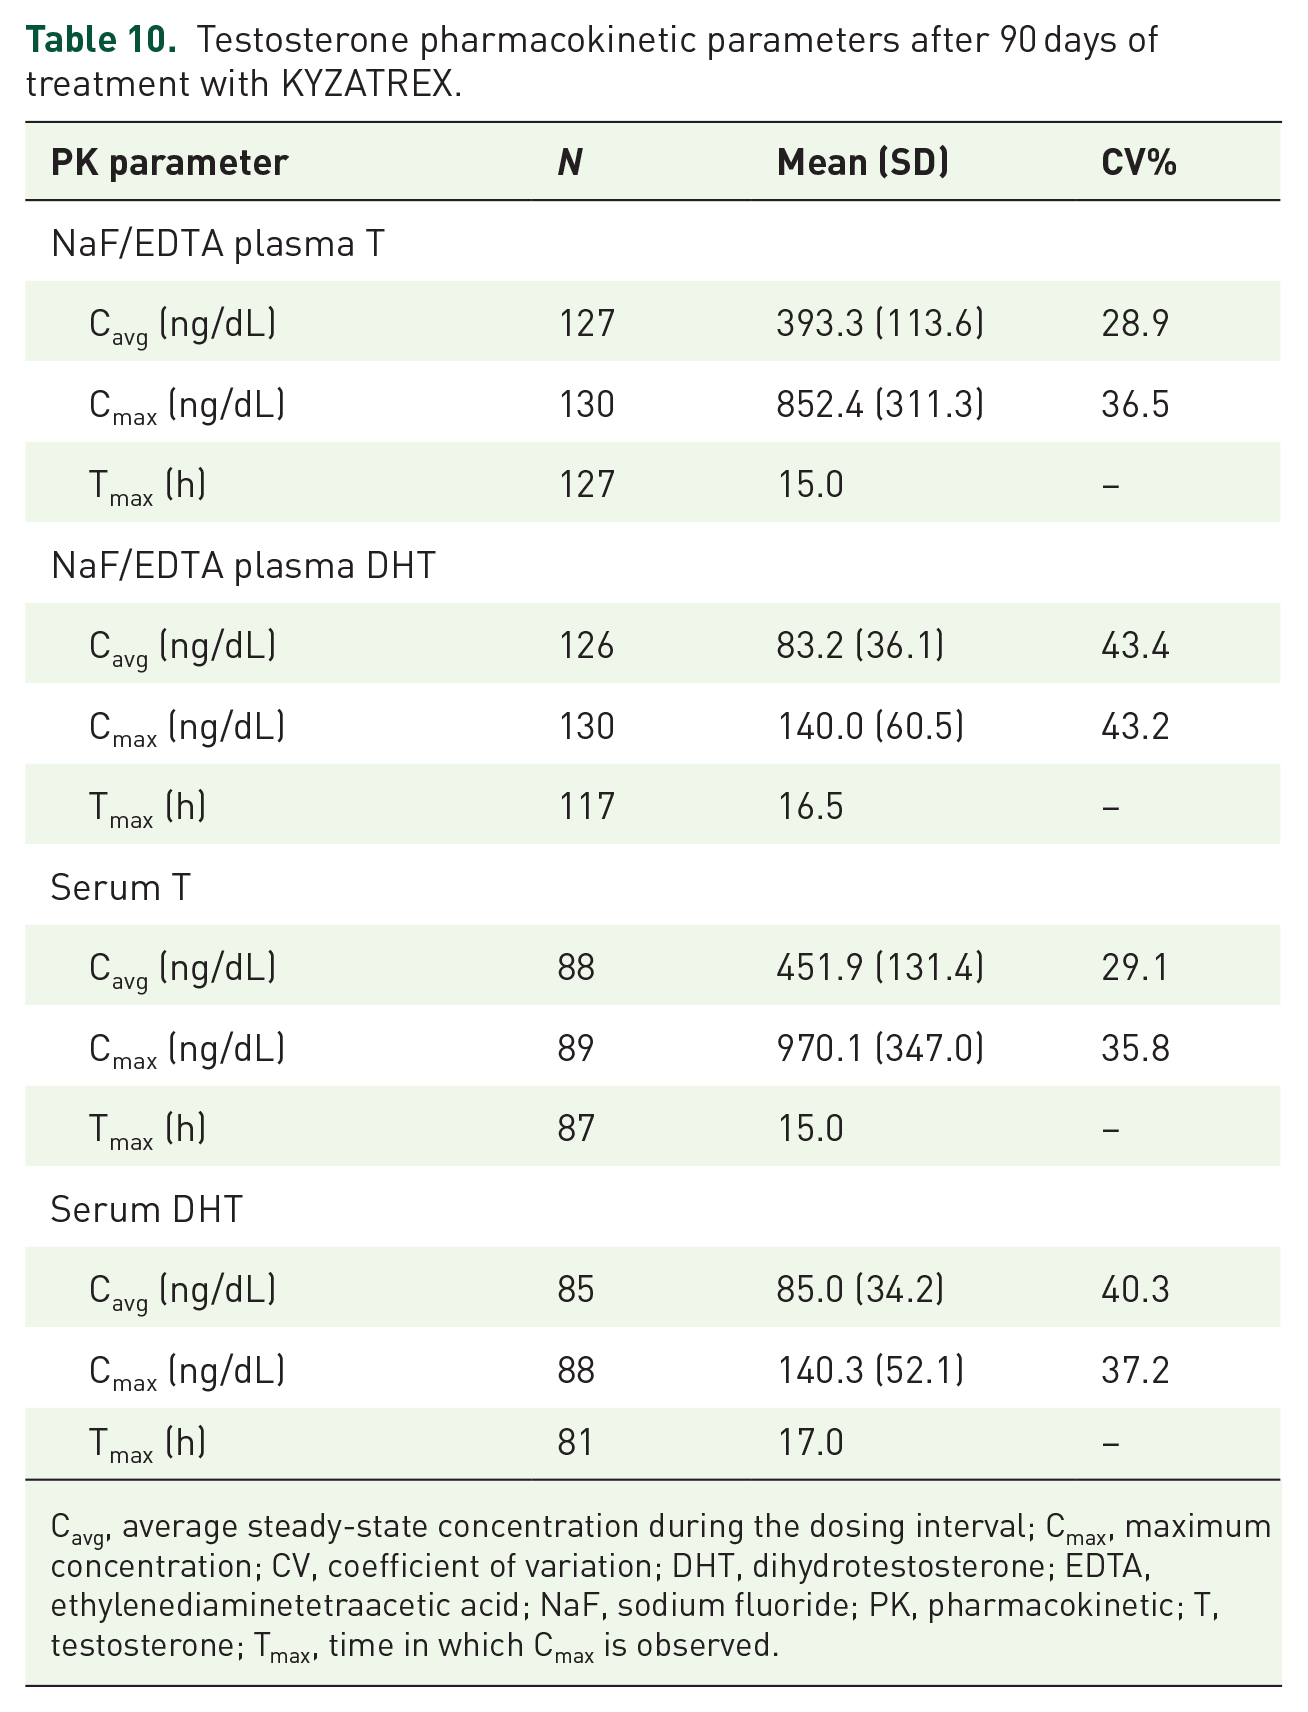
Cavg, average steady-state concentration during the dosing interval; Cmax, maximum concentration; CV, coefficient of variation; DHT, dihydrotestosterone; EDTA, ethylenediaminetetraacetic acid; NaF, sodium fluoride; PK, pharmacokinetic; T, testosterone; Tmax, time in which Cmax is observed.

Mean plasma and serum testosterone 24-h PK at Day 90.
The median time (Tmax) of Cmax was 15.0 h for T, 16.5 h for DHT, 13.5 h for TU, and 6.0 h for DHTU. The mean TU concentration at Day 90 was 7806.4 ng/dL versus a mean T concentration of 393.3 ng/dL, for a ratio of slightly less than 20-fold.
Primary and secondary endpoints related to blood pressure and HR
Results of the ABPM assessment in MRS-TU-2019EXT are presented in White et al. 17 and summarized here. After 120 days of treatment, a statistically significant increase from baseline in 24-h mean SBP from baseline of 1.7 mmHg (95% CI: 0.3–3.1) was recorded in MRS-TU-2019EXT. After 180 days of treatment this increase appeared stable, the change from baseline being 1.8 mmHg (0.3–3.2). Thus, a plateau for SBP increase occurred between 120 and 180 days in MRS-TU-2019EXT. DBP measurements at Day 120 resulted in a change from baseline of 0.6 mmHg (−0.3 to 1.6), which was not statistically significant. The highest subgroup increase in SBP after 120 days of treatment occurred in participants who were on antihypertensive medication at baseline, with a mean change from baseline of 3.4 mmHg (1.0–5.9). In this subgroup also the increase of DBP after 120 days of treatment is statistically significant at an increase of 1.8 mmHg (0.2–3.5) versus baseline. A small increase was reported in mean HR: 0.7 (−0.5 to 1.9) and 1.9 (0.6–31) beats per minute after 120 and 180 days of treatment.
Secondary endpoint of percentages of participants versus FDA thresholds for T Cmax
A key secondary objective of this study was to determine whether KYZATREX meets the FDA guidance for the percentage of participants with maximum concentration of plasma T against three thresholds calculated as multiples of the ULN range. Subgroup analyses were also conducted for the following subgroups: baseline weight, BMI, age, race, and ethnicity. Note that the FDA guidance does not specify the percentage of participants in the window from 1.5× to 1.8× of the ULN; thus, the percentages shown do not sum to 100%. The results are shown in Table 11.
Secondary efficacy endpoint thresholds and results.

Serum thresholds are: 1.5 × ULN = 1500 ng/dL, 1.8× = 1800 ng/dL, 2.5× = 2500 ng/dL.
Race was indicated by trial participants. The racial category ‘Other’ was a pre-specified category in the individual case report form.
BMI, body mass index; T Cmax, maximum observed testosterone concentration within a 24-h pharmacokinetic profile; ULN, upper limit of normal.
Hormonal parameters
The percentage of participants at Day 90 with DHT Cavg below the ULN was 41.3%. The percentage of Day 90 participants with DHT Cavg above 2× the ULN was 4.8%; one value was above 3× but less than 5× the ULN on Day 90. The DHT Cavg for 95% of participants was below 2× the ULN. The pre-dose values on Day 1 of plasma DHT and T were 14.2 and 231.5 ng/dL, respectively, for a pre-dose ratio (percent) of 6.1%. However, the limit of quantitation for DHT was 10 ng/dL, and the standard deviation reported for pre-dose DHT was 10.4 ng/dL; thus, the pre-dose ratio has significant uncertainty. At Day 90, the ratio of DHT to T increased to 21.0% (SD = 7.7%).
Figure 5 shows mean SHBG (5a), FSH (5b) and LH (5c) decreased from baseline to Day 90 and to end of treatment (nominally Day 180). While TSH levels decreased slightly at Day 90, they returned to near-baseline levels by end of treatment. Estradiol increased from 2.3 ng/dL (single sample, pre-treatment) to a Cavg of 3.5 ng/dL at Day 90. The estradiol/testosterone ratio at Day 90 remained unchanged from 1.00% at pre-treatment. The mean values of these hormones remained within the normal range.
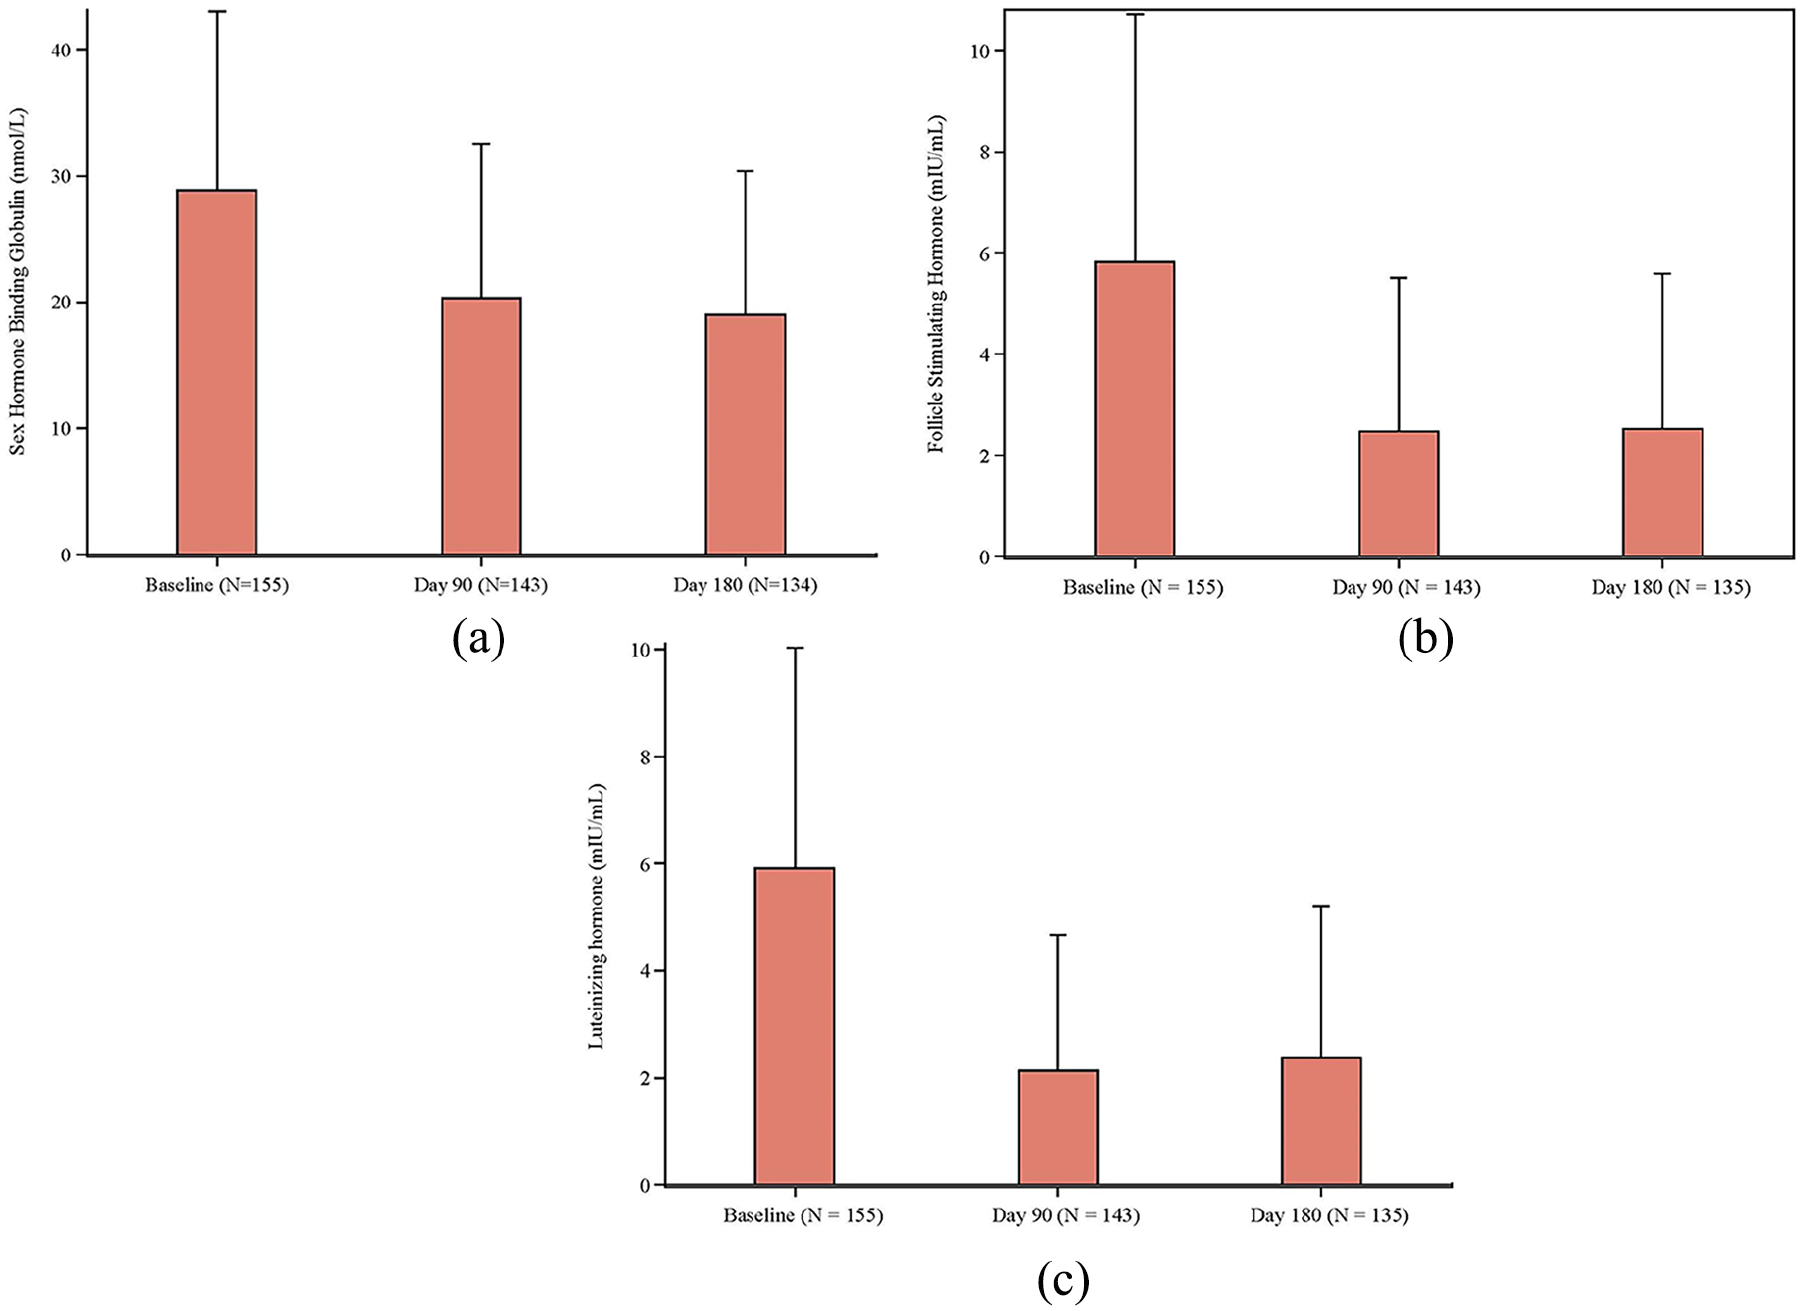
Changes in mean endocrinology parameters with KYZATREX.
Vermeulen postulated that the sum of free T plus T bound to albumin reflects the concentration available for androgenic activity more than total T. In place of direct measurement of free T, Vermeulen presented a simple method for calculation of free T using total T, SHBG, and albumin concentrations and showed good correlation of the calculated value versus measured free T. 15 Using Vermeulen’s calculation, the mean free T (SD) in serum at baseline was 7.0 (3.1) ng/dL; after 90 days of treatment with KYZATREX, the calculated mean free T was 14.1 (4.5) ng/dL.
Adverse events
Table 12 categorizes TEAEs observed in MRS-TU-2019EXT. The majority of TEAEs were of mild to moderate intensity. Treatment-related TEAEs occurring in more than 1 participant included (number of participants, percent of treated participants): Hgb increased (3, 1.9%), acne (2, 1.3%), and hypertension (2, 1.3%). There were six (3.9%) TEAE reports of hypertension or blood pressure increase; two were judged of moderate intensity and four of mild intensity. No cases of treatment-related SAE nor of treatment-related severe TEAE’s was reported for the MRS-TU-2019EXT trial. There were no deaths and no cases of MACE reported in this trial.
Safety results: TEAE.

BP, blood pressure; HTN, hypertension; MACE, major adverse cardiovascular event; TEAE, treatment-emergent adverse event.
The two serious TEAE were atrial fibrillation and diverticular perforation, neither of which was judged to be treatment related. Three participants account for the four severe TEAE observed: atrial fibrillation (1, SAE), diverticulum (1, SAE), diverticular perforation (1, SAE), and tendon rupture (1). The TEAE leading to discontinuation was acne of moderate intensity.
Red blood cell mass
Mean Hgb was 14.7 g/dL at baseline, 15.1 g/dL at Day 90, and 15.2 g/dL at Day 180, for a mean increase of 0.5 g/dL, appearing to plateau between 90 and 180 days of treatment. There were 21 (14.7%) study participants with Hgb values greater than the upper limit of the lab normal range (16.9 g/dL) at the final study visit. Three participants (1.9%) had a TEAE of increased Hgb, with maximum values of 18.7, 17.1, and 18.0 g/dL. As noted earlier, Hgb was used as an index of red blood cell mass.
Results of liver enzymes and blood chemistry
There was no clinically significant change in mean values for LFTs throughout the study. There were also no trends over time in the percent of participants LFT values between 1–2×, 2–3×, or > 3× the ULN for alanine transaminase (ALT), aspartate trans-aminase (AST), alkaline phosphatase (ALP), or bilirubin. One participant had elevated LFT values prior to the start of dosing and withdrew at Day 120 because of persistent elevation (ALP, ALT, and AST). There were no clinically significant changes in blood urea nitrogen, creatinine, sodium, potassium, or calcium.
Results of lipid profiles
From baseline, total cholesterol decreased 11.1 mg/dL (−5.2%), low-density lipoprotein cholesterol decreased 4.0 mg/dL (−0.8%), high-density lipoprotein (HDL) cholesterol decreased 6.9 mg/dL (−14.0%), and triglycerides decreased 18.6 mg/dL (−1.2%). The median decrease from baseline for triglycerides was 6.0 mg/dL (−6.1%).
PSA results, prostate, and physical examination
Mean PSA at baseline was 1.0 ng/mL. The mean change from baseline after 90 and after 180 days of treatment was an increase of 0.2 ng/mL. Two participants (1.5%) had an increase in PSA >1.4 ng/mL, and the same two participants had a PSA ⩾4.0 ng/mL. All participants had a normal digital rectal examination at baseline and end of treatment. No participants had clinically significant gynecomastia at any timepoint.
Changes in hypertensive medications
At baseline, 58.7% of participants were hypertensive as judged by in-clinic measurement (SBP ⩾130 mmHg or DBP ⩾80 mmHg), and 36.1% reported use of antihypertensive medication at baseline. Five participants (3.2%) began taking new antihypertensive medications during the study and four of these also experienced TEAE of hypertension or blood pressure increase; no participants reported dose increases in existing antihypertensive medication during the study.
Discussion
Efficacy
This phase III study of KYZATREX demonstrated that a flexible titration window (samples taken 3- to 5-h after morning dose) approach coupled with a novel formulation met FDA standards for efficacy and Cmax. The KYZATREX dose range is wide enough to treat both super-responders who require down-titration as well as poor responders requiring higher doses. Results show that for participants who completed two titration cycles and 90 days of treatment, the large majority (96.1%) achieved Cavg values within the normal range. The use of serum results (serum sub-study) gave very comparable results for the percent of participants within the normal range after 90 days of treatment (86.5% using WCS, lower bound of the 95% CI: 79.4%).
The trial participants were drawn from a geographically diverse population of men in the USA and included substantial sub-populations with respect to hypertension, diabetic status, weight, body mass index, ethnicity, and age. Representation from diverse racial groups was limited; about 16% of the participants identified as black, but significant participation from other racial groups was small.
Subgroup analyses showed that the percent of participants in the normal range was not affected by age, weight, and BMI subgroups (trends to lower Cavg were noted with weight >93 kg and BMI >30 kg/m2). The logistic analysis showed a relationship of dose and baseline body mass: higher body mass was associated with higher KYZATREX doses. Similarly, dose and diabetic status were related: the presence of diabetes at baseline (HbA1c >6.5%) was associated with higher KYZATREX doses.
With respect to the time at which the blood sample is obtained for adjusting or maintaining the KYZATREX dose level, analysis of the percentage of participants achieving the normal range outcome after two titration cycles and 90 days of treatment showed that regardless of whether the 3, 4, or 5-h timepoint was used on Day 42, more than 84% of participants achieved Cavg in the normal range.
Diet choices in MRS-TU-2019EXT had little to no observable effect on the percent of participants in the normal range or on PK parameters of T. In contrast to single-dose food effect studies in which a food effect for the highly lipophilic TU is usually observed, 18 the phase III results for KYZATREX show that patient diet choices have minimal or no effect on the percentage of participants achieving the normal range for T Cavg. This may be due to participants consuming enough lipids even in low-fat meals such that sufficient absorption of TU occurs. The Day 90 GLSM ratios have a narrow range, even when comparing the low-fat versus high-fat breakfast, indicating that patients can achieve Cavg within the normal range regardless of diet choices.
A direct approach was used in calculating titration thresholds for use of serum samples, rather than a model-based approach. The data set for this direct approach used serum and NaF/EDTA plasma samples collected simultaneously at both titration visits (0–6 h collected, hours 3, 4, and 5 used in defining the relationship). A regression analysis using the 3-, 4-, and 5-h timepoints yields an empirical relationship between the serum and plasma values based on samples from 18 clinical sites and 139 participants. This empirical relationship incorporates the stability and bioanalytical factors that are modeled separately in other studies. 12
Safety
Within the constraints of a 180-day treatment period and 155 treated participants, the safety profile of KYZATREX included only one drug-related AE (hypertension or blood pressure increase) in more than 2% of the participants with a mean increase of 1.7 mmHg in the average ABPM SBP after 120 days and a demonstrated plateauing of this increase by 180 days. The reported mean increase in systolic BP is the lowest of the label-reported BP increases for the three FDA-approved oral TU products.12,17,19 Possible increases in BP require monitoring and are the subject of class ‘Boxed’ warnings on recently approved TRTs. In-clinic BP effects in a 12-month safety study (ClinicalTrials.gov identifier: NCT03198728) of KYZATREX versus AndroGel® has also recently been reported, although this study used different titration thresholds and dose strengths than MRS-TU-2019EXT. 20
Oral TRT products avoid the risk of T transfer between a patient and another person and do not have the objections associated with injected forms of TRT. 21 With any TRT, there are several safety considerations that must be addressed. These include changes in vital signs (blood pressure, pulse, and weight), urological symptoms and prostate disease, gynecomastia, psychological issues (anxiety, depression, aggression), Hgb and hematocrit, lipids, and adrenal function. In addition, with oral T therapy the incidence of gastrointestinal (GI) symptoms needs to be considered. Finally, because the safety effects of above normal-range T levels have not been established, the FDA has established guidelines for allowable Cmax percentages within 1.5×, 1.8×, and 2.5×, the upper limit of normal. 13
The T Cmax results obtained in this study demonstrate that KYZATREX achieved all three of the FDA-defined T Cmax safety criteria for the study population. Subgroup analyses by age and race were consistent with the overall Cmax findings, with >85% of each subgroup having plasma T Cmax <1200 ng/dL, except for the BMI subgroup <30 kg/m2 (81.6%). The serum sub-study results also fully meet the FDA Cmax criteria.
Increases in Hgb and hematocrit are known side effects of TRT, and the Hgb changes observed are consistent with observations from other studies of TRT.12,21 Patients on TRT should be monitored for increases in hematocrit or Hgb above the normal range.
Because KYZATREX is an oral medication, AEs involving functional GI symptoms (preferred terms included nausea, dyspepsia, diarrhea, constipation, upper abdominal pain, abdominal discomfort, and abdominal distension) are especially relevant. In this study there was a low rate of GI AEs, with 2 of 155 participants with an AE of diarrhea and 1 participant with an AE of constipation.
There were no clinically significant changes in mean values for LFTs throughout the study. None of four hepatic AEs observed were judged to be related to the study drug; one participant developed elevated LFTs pre-treatment and withdrew during treatment. There was minimal change in serum glucose and HbA1C in either study, both in participants with and without diabetes. There were no clinically significant changes in blood chemistry parameters. Lipid changes with KYZATREX (small decreases) are consistent with what is known about TRTs as a class, with a decrease in HDL the only clinically significant change (decrease of 14.0%).
A minority of elevated PSAs were suspicious for prostate cancer, and many were isolated increases. It is also clear that PSA should be monitored in any older man receiving androgen replacement therapy.
Conclusion
The authors conclude that within the limits of the study reported here, KYZATREX is a safe and effective means to treat hypogonadal men, with a safety profile consistent with other TRT products and as an oral medication without the constraints of other routes of administration. Oral TU products are associated with blood pressure increases in some men, with a statistically significant mean increase reported for SBP. In this study, a very high percentage (96.1%) of the trial participants completing 90 days of treatment achieved average T-levels within the normal range. KYZATREX met all FDA safety guidance regarding the maximum T concentrations for all three threshold groups. The majority of the recorded TEAEs were of mild-to-moderate intensity, and no drug-related SAE were observed in this study. The type of diet (low-, normal-, or high-fat) did not significantly affect the percentage of men achieving T values in the normal range. The flexibility of obtaining a blood sample within a window of 3- to 5-h after the morning dose improves the convenience of titrating KYZATREX.
Supplemental Material
sj-docx-1-tau-10.1177_17562872241241864 – Supplemental material for A phase III, single-arm, 6-month trial of a wide-dose range oral testosterone undecanoate product
Supplemental material, sj-docx-1-tau-10.1177_17562872241241864 for A phase III, single-arm, 6-month trial of a wide-dose range oral testosterone undecanoate product by James S. Bernstein and Om P. Dhingra in Therapeutic Advances in Urology
Supplemental Material
sj-docx-2-tau-10.1177_17562872241241864 – Supplemental material for A phase III, single-arm, 6-month trial of a wide-dose range oral testosterone undecanoate product
Supplemental material, sj-docx-2-tau-10.1177_17562872241241864 for A phase III, single-arm, 6-month trial of a wide-dose range oral testosterone undecanoate product by James S. Bernstein and Om P. Dhingra in Therapeutic Advances in Urology
Footnotes
Acknowledgements
The authors gratefully acknowledge Syneos Health as clinical research organization, Susan Walker (Apex Biostatistics) and Lei Wang and associates (PharStat) for statistical analysis; Ivy Fowler for her expert oversight of the clinical studies; Craig Metz PhD for regulatory leadership, Roger Rittmaster MD for clinical guidance, Amit Patel MD (Marius Pharmaceuticals) for helpful review of the manuscript, and Natasha Wadlington PhD, Jessica Chang PharmD, and Cheryl Rauh (SB Pharma Solutions) for assistance with preparation of the manuscript.
Declarations
Supplemental material
Supplemental material for this article is available online.
References
Supplementary Material
Please find the following supplemental material available below.
For Open Access articles published under a Creative Commons License, all supplemental material carries the same license as the article it is associated with.
For non-Open Access articles published, all supplemental material carries a non-exclusive license, and permission requests for re-use of supplemental material or any part of supplemental material shall be sent directly to the copyright owner as specified in the copyright notice associated with the article.