
Abstract
Background:
Multiple sclerosis (MS) is a complex and heterogeneous disease characterized by variable clinical outcomes.
Objective:
We aimed to develop a predictive model combining principal component analysis (PCA) and clustering techniques to identify biomarker sets associated with MS and characterize distinct phenotypes.
Design:
A monocentric, cross-sectional study on treatment naïve patients at the time of MS diagnosis.
Methods:
Clinical, laboratory, and neuroimaging data were collected, including retinal layer measurements via optical coherence tomography and neurofilament light (NFL) chains levels.
Results:
The cohort included 71 MS patients with mean age 35.7 years (SD = 9.8). PCA yielded five components with eigenvalues >1.0, explaining 68.1% of total variance. Component 1 showed strong negative coefficients for retinal thickness (ganglion cell-inner plexiform layer: −0.82, peripapillary retinal nerve fiber layer (RNFL): −0.79, macular RNFL: −0.75) and moderate positive coefficient for serum NFL (0.45). Component 2 featured high positive coefficients for NFL in cerebrospinal fluid (0.88) and serum (0.56). K-means clustering identified two distinct groups: one (n = 33) with thicker retinal layers, better cognitive performance, and unexpectedly higher serum NFL levels compared to the other group (n = 38).
Conclusion:
These findings suggest that MS may present with distinct phenotypic profiles even at diagnosis. Future longitudinal studies are needed to validate these early biomarkers and refine personalized treatment approaches.
Keywords
Introduction
Multiple sclerosis (MS) is a chronic inflammatory and neurodegenerative disease of the central nervous system (CNS) characterized by significant inter and intra heterogeneity in clinical presentation, disease course, and treatment response.1,2 This heterogeneity poses substantial challenges for clinicians in predicting individual disease trajectories and optimizing therapeutic strategies, particularly at disease onset when critical treatment decisions are needed. 3
Traditional clinical measures, such as the Expanded Disability Status Scale (EDSS) and relapse rate, showed limited sensitivity to capture the full spectrum of MS progression and provide insufficient information for patient stratification at the time of MS diagnosis.4,5 Consequently, there is growing recognition of the need for more objective and sensitive biomarkers that can detect subtle disease-related changes and reflect different aspects of MS clinical courses.6 –9
In recent years, several promising biomarkers for MS have been proposed. Among them the most prominent are neurofilaments light (NFLs) chain, a structural protein of neuronal cytoskeleton, has gained significant attention as fluid biomarker of neuroaxonal damage and inflammatory processes. 10 Elevated levels of NFLs in cerebrospinal fluid (CSF) and serum have been associated with disease activity, disability progression, and treatment response in MS. 11
Optical coherence tomography (OCT) has emerged as noninvasive imaging technique that allows precise quantification of retinal layers damage, particularly in the peripapillary retinal nerve fiber layer (pRNFL) and the ganglion cell-inner plexiform layer (GCIPL). 12 These retinal measures serve as surrogate markers of anterior visual pathway integrity and correlate with global brain atrophy and disability in MS. 13
Cognitive impairment affects a substantial proportion of MS patients, often beginning in the early stages of the disease and significantly impacting quality of life. 14 The Brief International Cognitive Assessment for MS (BICAMS) has been validated as a brief, sensitive screening tool for cognitive dysfunction in MS. 15 Cognitive measures provide valuable information about functional neural integrity that may not be captured by other biomarkers. 16
While each of these biomarkers offers valuable insights into specific aspects of MS pathophysiology, their individual utility for patient stratification at disease onset is still debated. We hypothesized that the combination of these complementary biomarkers would reveal patterns of disease heterogeneity not apparent through conventional clinical assessment or individual biomarkers alone. Principal component analysis (PCA) is usually used to find characteristic patterns associated with specific diseases by reducing variable numbers based on their correlation with a principal component (PC).17,18 The first two or three PCs account for the greatest proportion of the variance in the dataset. Usually, these components are then used to determine whether individuals can be clustered into classification groups based on predefined parameters.
Our aim was to weight different biomarkers at the time of MS diagnosis and then to identify distinct phenotypes applying a PCA.19,20
In this study, we have developed a prediction model that combines PCA and cluster analysis for identifying sets of biomarkers associated with MS at the time of diagnosis and for characterizing, if any, distinct MS phenotypes.
Methods
Study design and setting
A monocentric cross-sectional, observational study was conducted at our tertiary neurological referral center, specializing in MS care.
The data entry portal was iMED© software (iMed, Geneva, Switzerland) and we followed a rigorous quality assurance procedure with a double entered data system. All data were extracted from the electronic health record in February 2025.
Participants
All patients were enrolled consecutively at the time of diagnosis, within June 1, 2024 and January 31, 2025 (index window). The data of diagnosis served as the baseline of the study.
Inclusion criteria comprised (1) age ≥18 years; (2) diagnosis of Relapsing MS according to revised McDonald criteria 21 ; (3) being naïve to any disease modifying therapy.
Exclusion criteria were (1) previous immunomodulatory or immunosuppressive treatment use; (2) ocular pathologies that could confound OCT measurements (e.g., glaucoma, diabetic retinopathy); (3) other neurological or psychiatric disorders that could affect cognitive performance; and (4) acute relapse or corticosteroid treatment within 30 days of assessment.
Procedures and covariate definition
Demographics, clinical, and radiological data
Demographic parameters (age at diagnosis, sex) and clinical variables were recorded, including disease duration, the baseline EDSS, and the number of relapses 12 months before diagnosis. Neuroradiological assessments included gadolinium-enhancing lesions on TI weighted sequences at baseline Magnetic Resonance Imaging (MRI), 3-Tesla, Siemens Magnetom Skyra.
Disease duration was defined as the interval between the first symptom and the study baseline.
Baseline EDSS was assessed at the time of diagnosis confirmation. EDSS scores were obtained by a Neurostatus-certified neurologist. Baseline MRI was defined as obtained within 3 months from diagnosis confirmation.
Cognitive evaluations
The BICAMS battery, which comprises the Symbol Digit Modalities Test (SDMT), California Verbal Learning Test-II (CVLT-II), and Brief Visuospatial Memory Test (BVMT) was used to assess cognitive performance. 15 Raw scores were converted to z-scores based on established normative data.
Cognitive evaluation was carried out by a trained neuropsychologist and was obtained during the diagnostic workflow.
OCT acquisition and analysis
OCT scans were acquired using a Spectralis device (Heidelberg Engineering) in a darkened room without pupillary dilation. Measurements included the pRNFL, macular RNFL (mRNFL), and GCIPL thicknesses. Eyes were categorized as “affected” or “unaffected” by optic neuritis based on predefined RNFL thinning cut-offs from validated protocols.22 –25 As analyses revealed no statistically significant differences between affected and unaffected eyes, the average value from both eyes was used for subsequent analyses (Supplemental Table 1).
OCT examinations were conducted for all participants within 4 weeks from the BICAMS and EDSS assessment.
Laboratory procedures and NFL assessment
NFL concentrations in CSF and serum were measured using the ELLA technique with a Simple Plex Human NF-L Cartridge®, following a 1:2 dilution, with all samples processed in duplicate and demonstrating coefficients of variation <10%. 26
Statistical analysis
Categorical variables are presented as counts and proportions, while continuous variables are expressed as mean ± standard deviation (SD) or median with interquartile range depending on their distribution. The Kolmogorov–Smirnov test was used to assess normality. For normally distributed data, between-group comparisons were conducted using independent t-tests; for nonnormally distributed data, the Mann–Whitney U test was employed. Statistical significance was defined as p < 0.05.
Prior to multivariate analysis, all continuous variables were standardized to zero mean and unit variance to ensure equitable contribution of variables measured on different scales. The dataset was complete with no missing values, and then no imputation was needed.
PCA was employed to reduce dimensionality while preserving the dataset’s inherent structure.
Variables included were sex, age, disease duration, baseline EDSS, number of relapse 12 months before diagnosis, gadolinium enhancing lesions on T1 weighted sequences at baseline MRI, GCIPL, mRNFL, pRNFL, serum NFLs, CSF NFLs, z-score SDMT, z-score CVLT-II, and z-Score BVMT.
This technique transforms potentially correlated variables into linearly uncorrelated PCs that successively maximize explained variance. Each component represents a linear combination of the original variables, with coefficients (loadings) indicating the contribution of each variable to that component. Positive loadings indicate that the variable and component increase together, while negative loadings indicate an inverse relationship. The magnitude of these loadings (ranging from −1 to 1) reflects the strength of association between the variable and the component.
The optimal number of components was determined using the Kaiser criterion (eigenvalues >1.0), ensuring that retained components explain more variance than individual original variables. This approach was supplemented by examination of the scree plot to identify the inflection point where additional components provide diminishing returns in explained variance. To enhance interpretability while maintaining orthogonality between components, Varimax rotation was applied to the retained components. This orthogonal rotation technique maximizes the sum of variances of squared loadings, thereby simplifying the component structure by ensuring that each variable loads strongly onto as few components as possible while preserving the perpendicular (uncorrelated) relationship between components.
Individual component scores were calculated for each patient, representing their coordinates in the reduced-dimensional space. These scores served as input features for K-means clustering, an unsupervised algorithm that iteratively assigns observations to clusters by minimizing within-cluster sum of squares. The optimal number of clusters (k) was objectively determined through silhouette analysis, which quantifies the cohesion within clusters relative to separation between clusters.
To assess the clinical relevance of the identified patient subgroups, between-cluster comparisons were conducted using independent samples t-tests for continuous variables and Chi-square tests for categorical variables. The total variance explained by the retained components was calculated as the sum of their respective eigenvalues divided by the number of original variables, expressed as a percentage.
All analyses were performed using Python (version 3.9) with pandas for data manipulation and preprocessing, scikit-learn for implementing PCA and K-means clustering algorithms, factor_analyzer for performing Varimax rotation, SciPy for statistical testing, and matplotlib and seaborn for data visualization.
Results
A total cohort of 71 patients with MS was enrolled. The mean age at diagnosis was 35.7 years (SD = 9.8), with an average disease duration of 24.3 months (SD = 16.5). The median EDSS score was 2.0 (range: 1.0–3.5; Table 1).
Demographic and clinical characteristics of MS patients overall and by cluster.

Via Chi-square or t test as appropriate.
EDSS, Expanded Disability Status Scale; MRI, magnetic resonance imaging; MS, multiple sclerosis.
Principal component analysis
PCA yielded five components with eigenvalues greater than 1.0, collectively accounting for 68.1% of the total variance in the dataset.
The variance explained by each component was as follows: Component 1 (20.2%), Component 2 (15.1%), Component 3 (13.8%), Component 4 (10.6%), and Component 5 (8.5%; Figure 1, Table 2).

Scree plot showing eigenvalues for each principal component. The horizontal dashed line represents the Kaiser criterion (eigenvalue >1) for component retention.
Eigenvalues and variance explained by principal components.

After Varimax rotation, the components demonstrated clear and interpretable patterns of coefficients, here detailed (Figure 2):
Component 1 was characterized by strong negative coefficients for retinal thickness measurements (GCIPL: −0.82, pRNFL: −0.79, mRNFL: −0.75) and a moderate positive coefficient for serum NFL (0.45), suggesting an inverse relationship between retinal integrity and neurodegeneration (Figure 2). This pattern reveals an inverse relationship where retinal thinning occurs alongside elevated circulating neurodegeneration markers, suggesting that Component 1 captures a composite signature of neurodegeneration processes affecting both retinal integrity and systemic neural damage biomarkers.
Component 2 was primarily characterized by high positive coefficients for NFLs, in both CSF (CSF NFL: 0.88) and serum (sNFL: 0.56; Figure 2). This indicates that patients with elevated NFLs tend to share a common pattern independently from other variables.
Component 3 showed substantial loadings for age (0.71), baseline EDSS (0.65), and a negative loading for Z-score SDMT (−0.58; Figure 2).
Component 4 was dominated by verbal memory (Z-score CVLT-II: 0.83) and a negative loading for number of relapses 12 months before diagnosis (−0.61), suggesting an inverse association between inflammatory activity and verbal memory performance (Figure 2).
Component 5 primarily captured disease chronicity, with high loadings for disease duration (0.87) and age at diagnosis (0.54; Figure 3).

Heatmap of rotated component loadings showing the contribution of each variable to the five principal components.

Silhouette plot for the two-cluster solution. Higher silhouette values indicate better cluster assignment. The vertical dashed line represents the average silhouette coefficient (0.42).
Clusters analysis
K-means clustering of the PCA-transformed data identified two distinct patient subgroups (Cluster 0: n = 38; Cluster 1: n = 33). Silhouette analysis confirmed that this two-cluster solution provided optimal separation, with an average silhouette coefficient of 0.42 (Figure 3).
Between-cluster comparisons revealed significant differences in several key variables (Figure 4).
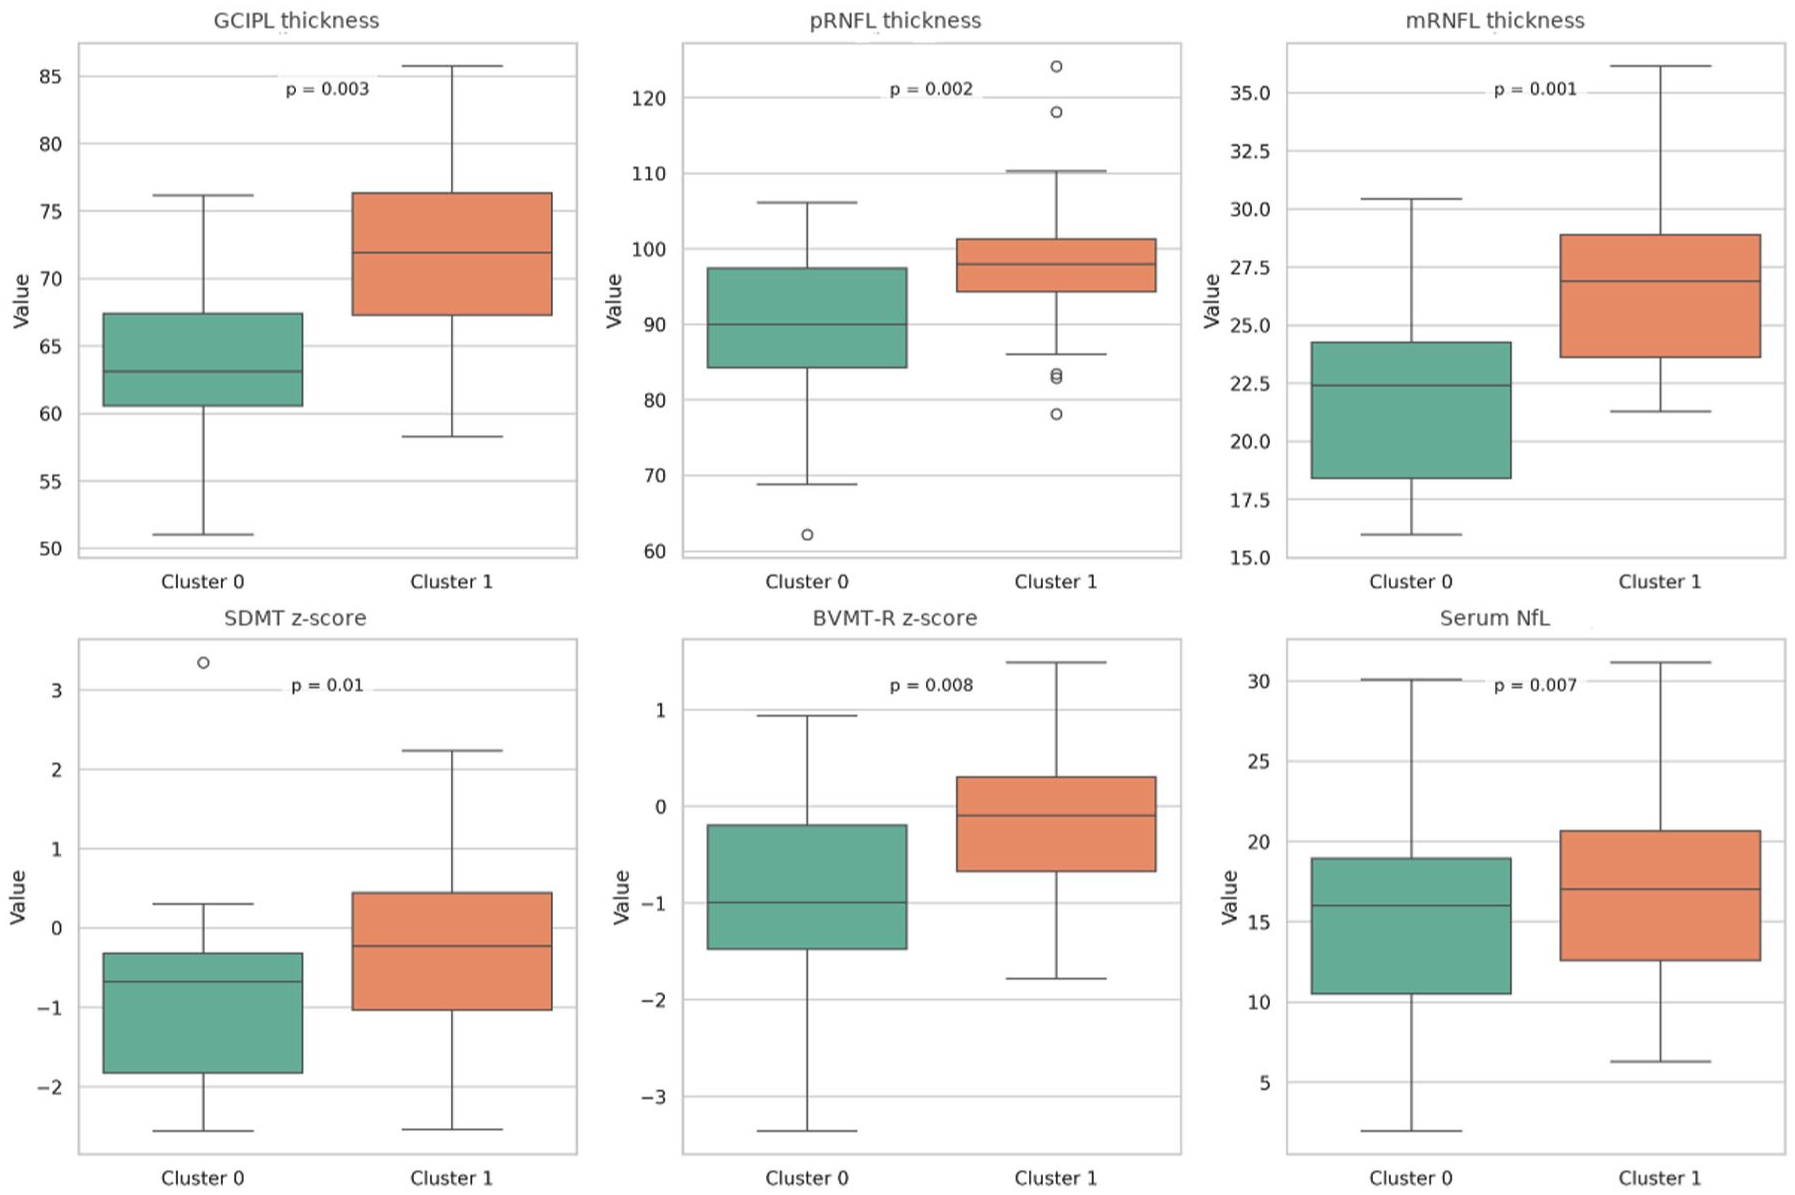
Boxplots comparing key variables between Cluster 0 and Cluster 1.
Cluster 1 patients exhibited significantly thicker retinal layers (GCIPL: 72.4 vs 64.8 μm, p = 0.003; mean pRNFL: 98.3 vs 89.7 μm, p = 0.002, mRFNL 25.8 vs 22.1, p = 0.001) and better cognitive performance (mean SDMT z-score: −0.31 vs −0.89, p = 0.01; mean BVMT-R z-score: −0.22 vs −0.76, p = 0.008) compared to Cluster 0.
Notably, Cluster 1 patients also displayed significantly higher serum NFL levels (mean: 18.6 vs 12.3 pg/mL, p = 0.007), despite their better structural and cognitive profile. No significant differences were observed in CSF NFL levels between clusters (p = 0.21; Table 3).
Comparison of key variables between patient clusters.

Via Chi-square or t test as appropriate.
BVMT, Brief Visuospatial Memory Test; CSF, cerebrospinal fluid; CVLT-II, California Verbal Learning Test-II; GCIPL, ganglion cell-inner plexiform layer; mRNFL, macular retinal nerve fiber layer; NFL, neurofilament light; pRNFL, peripapillary retinal nerve fiber layer; SDMT, Symbol Digit Modalities Test. 12
The clusters did not differ significantly in age at diagnosis (p = 0.18), disease duration (p = 0.32), or EDSS scores (p = 0.09; Table 1).
Discussion
Our PCA suggested a relationship between retinal structural integrity and NFL levels. Component 1 showed a strong inverse association between retinal thickness measurements (GCIPL, pRNFL, mRNFL) and serum NFL levels. This finding indicates that retinal thinning may serve as a structural marker of the neurodegenerative processes leading to increased NFL release, as supported by previous longitudinal studies.27 –29
However, the associations observed in these cross-sectional analyses are generally modest, which is consistent with the view of serum NFL as a dynamic biomarker reflecting recent and ongoing neuroaxonal injury, as well as disease activity.30,31 Elevated levels of serum and CSF NFL have been associated with active inflammation, disability progression, and treatment response, making it a valuable tool for monitoring disease processes. 11
Component 2, which is dominated by NFL levels in both CSF and serum, captures a dimension of the disease that may appear somewhat independent of retinal changes. This suggests that while retinal pathology and central neurodegeneration are interrelated, they may reflect distinct aspects or different temporal phases of the disease process.32,33 As previously hypothesized, the neurodegenerative components of MS may develop in a length-dependent and asynchronous way, potentially explained by random (stochastic) processes interacting with anatomical, pathological, and biological factors. 34 In this model, shorter axonal pathways may be affected earlier in the disease course by chance, with progressive involvement over time; however, clinical manifestations of progression along these pathways are relatively uncommon in the early stages of MS. 34
Components 3–5 further underscore the multifactorial nature of MS and reaffirm the importance of traditional clinical parameters. In particular, Component 3—characterized by significant loadings for age and EDSS along with a negative correlation with SDMT—illustrates the interplay between aging, clinical disability, and cognitive decline. These findings align with the extensive literature on MS suggesting relationships between aging and cognitive impairment, as well as associations between disability progression and cognitive performance.35,36 Component 4 primarily captures the dynamics of verbal memory performance and a higher number of relapses, highlighting the impact of inflammatory episodes on cognitive outcomes that has been previously described. 37 Component 5, reflective of disease chronicity through high loadings for disease duration and age at diagnosis, adds a temporal dimension that may influence both structural and functional decline.38,39 Together, these components portray a complex clinical landscape where demographic factors, disease duration, inflammation, and cognitive performance collectively modulate the expression of neurodegenerative biomarkers. Increasingly, MS is being recognized as a condition of end-organ failure of the CNS. 40 Preventing this failure requires a focus on biological age, brain health, and lifestyle factors—including diet, smoking, and physical activity—which collectively influence disease progression. This perspective highlights the importance of early interventions aimed at preserving CNS integrity and function, rather than relying solely on chronological age as a therapeutic guide. Our cluster analysis identified two distinct patient subgroups with differential biomarker profiles. Notably, Cluster 1 patients exhibited significantly better retinal integrity and cognitive performance compared to Cluster 0, suggesting a less-advanced neurodegenerative state. However, the finding of higher serum NFL levels in Cluster 1 despite better structural and cognitive profiles presents an intriguing clinical phenomenon. This apparent discordance between structural preservation and elevated NFL levels might indicate that NFLs reflects early, subclinical, or diffuse neuroaxonal injury that is not captured by overt disease activity that have not yet manifested as structural damage, clinical relapses, or disease worsening, and that their elevation could precede these phenomena.41 –43 This interpretation could also be supported, albeit marginally, by the lower number of relapses observed in Cluster 1. Additionally, these differences may reflect the influence of other factors captured in Components 3–5, such as age and disease duration illustrating that the time course and manifestation of neurodegenerative processes can vary among subgroups. The identification of these distinct biomarker patterns has important clinical implications. First, they suggest that a multimodal assessment approach—integrating both structural and fluid biomarkers—provides a more comprehensive evaluation of disease status than either modality alone. Second, the observed discrepancies between retinal integrity and NFL levels underscore the limitations of relying on a single biomarker type for monitoring disease progression.
For clinical practice, these findings imply that patients with preserved retinal structure but elevated NFL levels might be at an early or inflammatory stage of the disease, potentially requiring different management strategies than those with significant retinal thinning and longer disease durations. Future longitudinal research is needed to clarify the temporal relationships among these markers and to determine how demographic factors and disease chronicity influence the progression of neurodegeneration.
Limitations
Several limitations should be considered when interpreting our findings. First, the cross-sectional nature of our study precludes definitive conclusions about the temporal evolution of the identified phenotypes. Longitudinal studies are needed to determine whether these phenotypes remain stable over time or converge as the disease progresses.
Second, although our sample size is substantial for a multimodal biomarker study, the absence of an a priori hypothesis and formal sample size or power calculation represents a limitation. This may affect the robustness and generalizability of our findings, as the study was not specifically powered to detect differences between phenotypic subgroups. Larger, hypothesis-driven studies with predefined sample size calculations will be important to confirm and extend these results. Third, the real-world setting of our study, while enhancing its generalizability, introduced variability in data collection procedures and timing. This variability may have influenced some of our measurements, particularly the more technically demanding ones such as OCT.
Fourth, a critical limitation is the absence of cerebral atrophy data, which prevented us from assessing its role in conjunction with the other biomarkers. Future studies incorporating volumetric MRI measures may provide additional insight into the neurodegenerative processes and further refine phenotype classification.
Fifth, the study did not include certain clinical and radiological variables, such as spinal cord imaging or detailed classification of relapse phenotypes. Including these measures could have provided further insight into the heterogeneity of MS and may have helped to better explain the variability observed between clusters.
Sixth, our analytical approach warrants specific methodological considerations. The PCA yielded five components (eigenvalues >1.0) explaining 68.1% of total variance, with the first two components accounting for 42.3%. While the Kaiser criterion provided a systematic retention framework, the moderate sample size (n = 71) and subject-to-variable ratio (3:1) suggest careful interpretation of the component structure.
The k-means clustering algorithm identified two phenotypic groups (silhouette coefficient = 0.68), with internal validation metrics supporting our solution (Calinski-Harabasz index = 156.3). However, the method’s inherent assumptions of spherical clusters and sensitivity to initial centroid placement should be noted. Cross-validation procedures on larger datasets would strengthen these preliminary groupings.
Conclusion
These data-driven insights establish a framework for future longitudinal validation studies. Understanding these early disease patterns could inform personalized treatment strategies, although larger cohorts are needed to validate the clinical utility of these phenotypic profiles. Our results demonstrate the value of multimodal biomarker integration in characterizing MS heterogeneity from disease onset.
Supplemental Material
sj-pdf-1-tan-10.1177_17562864251369747 – Supplemental material for A multimodal approach to distinguish multiple sclerosis phenotypes at diagnosis using biomarker profiles
Supplemental material, sj-pdf-1-tan-10.1177_17562864251369747 for A multimodal approach to distinguish multiple sclerosis phenotypes at diagnosis using biomarker profiles by Aurora Zanghì, Paola Sofia Di Filippo, Annamaria Greco, Claudia Rutigliano, Ermete Giancipoli, Cristiana Iaculli, Carlo Avolio and Emanuele D’Amico in Therapeutic Advances in Neurological Disorders
Supplemental Material
sj-pdf-2-tan-10.1177_17562864251369747 – Supplemental material for A multimodal approach to distinguish multiple sclerosis phenotypes at diagnosis using biomarker profiles
Supplemental material, sj-pdf-2-tan-10.1177_17562864251369747 for A multimodal approach to distinguish multiple sclerosis phenotypes at diagnosis using biomarker profiles by Aurora Zanghì, Paola Sofia Di Filippo, Annamaria Greco, Claudia Rutigliano, Ermete Giancipoli, Cristiana Iaculli, Carlo Avolio and Emanuele D’Amico in Therapeutic Advances in Neurological Disorders
Footnotes
References
Supplementary Material
Please find the following supplemental material available below.
For Open Access articles published under a Creative Commons License, all supplemental material carries the same license as the article it is associated with.
For non-Open Access articles published, all supplemental material carries a non-exclusive license, and permission requests for re-use of supplemental material or any part of supplemental material shall be sent directly to the copyright owner as specified in the copyright notice associated with the article.