
Abstract
Background:
Multiple sclerosis (MS) manifests clinically as relapsing disease (relapsing-remitting MS (RRMS)), progressive disease, or as combination of these phenotypes. The underlying pathology for relapses and focal inflammatory activity is driven by adaptive immune cells, whereas brain-compartmentalized pathology promoted by innate immune cell activation likely contributes to progression.
Objectives:
To explore the usability of various imaging and soluble biomarkers in predicting change in clinical phenotype from RRMS to secondary progressive MS (SPMS).
Design:
Prospective longitudinal study.
Methods:
Twenty-three RRMS patients aged 40–50 years had clinical evaluation, brain MR imaging, serum neurofilament light and glial fibrillary acidic protein (GFAP) measurements, and brain positron emission tomography with translocator protein (TSPO)-binding radioligand [11C](R)-PK11195 at baseline. Patients were followed for 5 years and assessed for signs of conversion to SPMS at the end of follow-up. Evolution to SPMS was determined based on an increased Expanded Disability Status Score and significant accrual of clinical symptoms.
Results:
After 5 years, 8/23 (35%) patients had converted to SPMS. At baseline, they had increased TSPO-binding in the normal appearing white matter, thalamus, and perilesional area compared to patients who did not convert to SPMS. The proportion and number of TSPO-rim-active lesions were higher among patients developing SPMS. Higher concentration of GFAP and more pronounced thalamic atrophy were also observed among the SPMS convertors.
Conclusion:
The results suggest that imaging and serum biomarkers reporting on compartmentalized central nervous system inflammation support identification of MS patients at risk of SPMS conversion. Evaluation of thalamic atrophy and measurement of soluble biomarkers can be implemented in the assessment of individual patients’ progression risk in daily clinical practice. This can help in identifying patients who are at greatest need of smoldering pathology-targeting therapy. Larger studies are needed to validate these results.
Trial registration:
NCT3134716 role of microglia in the pathogenesis of progressive multiple sclerosis, https://clinicaltrials.gov/study/NCT03134716.
Keywords
Introduction
Multiple sclerosis (MS) is a chronic inflammatory and neurodegenerative autoimmune disease of the central nervous system (CNS), which can be categorized into different phenotypes based on the clinical course of the disease. In approximately 85% of patients, the disease manifests as relapsing-remitting MS (RRMS), which is followed by secondary progressive (SP) disease course after several years. RRMS is defined by acute attacks (relapses) followed by some degree of recovery, and patients can be relatively stable between relapses. Secondary progressive MS (SPMS) is characterized by gradual progression of symptoms with or without occasional concomitant relapses after an initial relapsing disease course. 1 Based on natural history studies, the average time from the onset of RRMS to SPMS conversion is 15–20 years, but individual disease trajectories vary considerably.2–4 Upon initiation of early efficient disease-modifying therapy (DMT), conversion to secondary progression seems to be significantly delayed.5–8
The main pathological features of MS are inflammation, demyelination, impaired remyelination, neurodegeneration, and axonal loss. RRMS is characterized by acute inflammation leading to formation of focal white matter (WM) and gray matter (GM) lesions, whereas widespread compartmentalized microglial activation, axonal degeneration, and neuronal loss dominate in SPMS. 9
Microglial activation, along with infiltrating macrophages and B cells, is considered a major driver of compartmentalized inflammation that contributes to disease progression. The current view is that all pathological processes are present already from the disease onset, but their distribution varies between individuals and at different stages of the disease continuum leading into a spectrum of clinical phenotypes.10,11 While conventional MRI is sensitive for identification of focal inflammatory lesions, other methodology is required for in vivo assessment of smoldering pathology. There has been significant advancement in imaging as well as soluble biomarker analysis for in vivo detection of smoldering pathology with susceptibility-weighted MRI, positron emission tomography (PET) with translocator protein (TSPO) binding radioligands, and soluble glial fibrillary acidic protein (GFAP) and neurofilament light chain (NfL) measurements being among the most important approaches.12,13 The aim of this study was to evaluate the respective usability of various advanced imaging and soluble biomarkers in predicting clinical phenotype change from RRMS to SPMS in a cohort of RRMS patients potentially at risk of disease progression according to their age and disease duration.
Material and methods
Study participants
Twenty-five patients with RRMS were recruited from the Neurocenter outpatient clinic of Turku University Hospital in Turku, Finland during 2016–2017. The inclusion criteria for the study were a diagnosis of RRMS, age of 40–50 years, and disease duration of at least 5 years at enrollment. Only patients on moderate efficacy DMTs 1 were considered for the study. To avoid potential confounding impact from immediate effects of acute focal inflammation on the CNS innate immune cell phenotype, patients with a relapse within 30 days of evaluation and/or gadolinium contrast enhancement in baseline MRI were excluded from the study. Other exclusion criteria were active neurological or autoimmune disease other than MS, another notable comorbidity, pregnancy and intolerability to PET or MRI. For comparison, 21 age- and sex-matched healthy controls (HCs) were imaged at baseline with TSPO-PET and MRI.
Standard protocol approvals, registrations, and patient consents
The study protocol was approved by the Ethical Committee of the Hospital District of Southwest Finland and the Local Research Ethics Committee. All participants signed a written informed consent form, and the study was conducted according to the principles of the Declaration of Helsinki. The results are reported according to STROBE guidelines. 15
Study design
The study design of this prospective longitudinal study is presented in Figure 1. At baseline, patients underwent PET imaging with TSPO binding radioligand [11C](R)-PK11195, 3T MRI, blood sampling for NfL and GFAP measurement, and Expanded Disability Status Scale (EDSS) 16 assessment for disability. Patients were followed for 5 years. EDSS assessments and MRI were repeated annually. Emergence of new focal lesions during follow-up was noted.

Study design. At baseline, patients underwent TSPO-PET-imaging, blood sampling, MRI, and clinical evaluation. Clinical evaluation and MRI were repeated yearly. QSM-MRI sequences were included in MRI protocol 2–4 years after baseline. After 5 years, patients were clinically evaluated to define conversion to SPMS.
Defining conversion to SPMS
At final study visit, patients were evaluated by an experienced neurologist to assess the potential conversion to SPMS. The diagnosis of SPMS was based on the Lublin criteria. 1 More specifically, evolution to SPMS was determined if there was any increase in the EDSS score, significant accrual of clinical symptoms of smoldering-associated worsening (SAW), 12 and agreement by both the patient and the neurologist of presence of continuous worsening of symptoms corresponding to SPMS. Cognitive symptoms, fatigue, impaired balance, spasticity, limb weakness, and urinary problems were considered to represent SAW. Detailed clinical characteristics of patients converting to SPMS (SPMS convertors) and patients remaining with RRMS (SPMS non-convertors) are presented in Supplemental Table 1.
MRI acquisition and creation of region of interest masks
Brain MRI was performed at baseline with a 3T Ingenuity TF PET/MR scanner (Philips Healthcare, Cleveland Ohio, USA). The follow-up MRI scans were obtained with either 3T Ingenuity TF PET/MR scanner or 3T Ingenia scanner (Philips Healthcare), and all 5-year-follow-up scans with 3T Ingenia scanner (Philips Healthcare). The following sequences were included for all time points: axial T2, 3D fluid-attenuated inversion recovery, 3D-T1, and gadolinium enhanced 3D-T1 (spatial resolution 1 × 1 × 1 mm). Baseline MRI and PET scans were performed on the same day, except for one patient (subsequent days). As parameters regarding T1 sequences (repetition time, echo time, field of view, acquisition matrix size, number of acquired slices, and flip angle) were equal, no normalization or correction for the MRI scanner variability regarding volumetric data were applied.
Region of interest (ROI) masks for T2 hyperintense and T1 hypointense lesions were created using a semiautomated method. The preliminary lesion masks were manually edited as described in detail previously.17,18 FreeSurfer 7.2.3 software (http://surfer.nmr.mgh.harvard.edu/) was used to segment cortical GM (cGM), cerebral WM, and thalamus after T1-lesion filling. The normal appearing white matter (NAWM) ROI was created by removing the T2 lesion ROI from the WM ROI. The lesion rim ROI was created by dilating the T1 lesion ROI by 2 voxels and then removing the lesion core from it, and the perilesional ROI was created by dilating the T1 lesion ROI by 6 voxels and then removing the lesion core and lesion rim ROI from it. Whole brain volume was based on SPM12 segmentation (https://www.fil.ion.ucl.ac.uk/spm/), and NAWM, cGM, and thalamus volumes (cm3) were acquired with FreeSurfer software as previously described. 17 Total T1 and T2 lesion volumes (cm3) were calculated from respective ROI masks.
Iron rim detection using QSM
Gradient echo (GRE) sequence to detect paramagnetic rim lesions (PRLs) was added to the MRI protocol 2–4 years after baseline (2 years n = 9, 3 years n = 11, 4 years n = 3), and PRLs were analyzed from the first available MRI using Quantitative susceptibility mapping (QSM). MEDI+0 (Morphology Enabled Dipole Inversion toolbox with automatic uniform cerebrospinal fluid zero reference) 19 was used to process QSM images from the GRE data as described previously. 20 Briefly, SPM12 was used to co-register the reconstructed QSM images with the T1 images. Lesions with hyperintense bright rim relative to the lesion core were determined as PRL by two experienced raters. Both lesions with complete and partial rims were considered as PRLs. 21
PET image acquisition and analysis
The radiochemical synthesis of [11C](R)-PK11195 was performed as described previously. 22 The mean (standard deviation (SD)) injected dose was 489 (13) MBq for MS patients and 485 (20) MBq for HCs (p = 0.5). A 60-min dynamic emission PET scan was performed using a brain dedicated ECAT High-Resolution Research Tomograph scanner (CTI/Siemens) with an intrinsic spatial resolution of approximately 2.5 mm.17,18 PET-images were reconstructed, smoothed, realigned and co-registered as described previously.17,23 Distribution volume ratio (DVR) values were determined using a reference tissue-input Logan method (20–60 min) with a gray reference input based on a supervised cluster algorithm (SuperPK software)24,25 as the pseudoreference region. To evaluate specific binding of [11C](R)-PK11195, DVRs were calculated in prespecified ROIs (NAWM, cGM, thalamus, perilesional area). To reduce partial volume effects from cortex and ventricles, 1-mm area was eroded from NAWM ROI at the borders of cortical and subcortical GM, and periventricular area.
Proportion of active voxels and categorization of individual lesions according to microglial activation
Proportion of individual active voxels in NAWM, thalamus and lesion rim, was calculated as previously described. 18 Active voxel was defined as follows: first mean DVR +1.96 × SD (95% confidence interval threshold) was calculated for each HC and the average of these values was used as the active voxel threshold. Clusters with less than three connected voxels were excluded to avoid inclusion of random peak values. T1 hypointense lesions were classified into three subtypes (rim-active, overall-active or inactive) based on the proportion of active voxels in the lesion core and rim. 18 In TSPO-rim-active lesions (RALs), the proportion of active voxels was considerably higher at the 0–2 mm lesion rim compared to the lesion core. T1 lesions at most 27 mm3 were excluded to avoid inclusion of unspecific T1 hyperintensities.
Measurement of soluble biomarkers NfL and GFAP
Blood was collected and serum was frozen after centrifugation (2000 g, 10 min, RT) at −80°C at the Auria Biobank (Turku, Finland), as previously described. 26 Samples were shipped on dry ice to Basel, Switzerland, where serum NfL (sNfL) and serum GFAP (sGFAP) concentrations were measured with the Simoa® Neurology 2-Plex B Kit (Quanterix, Billerica, MA, USA). Age- and BMI-adjusted sNfL z-scores were calculated using a large reference database and Generalized Additive Model for Location, Scale and Shape (GAMLSS model), as previously described. 27 A large reference database with 4297 samples from control persons (Maleska Maceski et al., manuscript under preparation) was used to model associations between sGFAP and age, BMI, and sex with GAMLSS model to derive z-scores.
Statistical analysis
The statistical analyses were performed using R (R Core Team, Vienna, Austria, https://www.r-project.org) (version 4.4.0). Continuous variables are presented as mean (SD) unless otherwise stated. Welch’s test or Wilcoxon rank-sum test were used to compare different independent groups, depending on the normality of the variable checked using Shapiro–Wilk’s test. Similarly, paired t-test or Wilcoxon signed-rank test were used to assess the differences between the two time points. Proportions of females, DMT levels (no DMT, moderate efficacy or high efficacy) 14 at baseline and during follow-up and patients with or without DMT escalation during follow-up were compared using Fisher’s exact test. All tests were two-tailed and p-value less than 0.05 was considered statistically significant for all analyses.
Results
Demographic, clinical, and imaging characteristics of the study cohort at baseline and during follow-up
Initially 25 RRMS patients were enrolled to this prospective study but two were not available for follow-up due to their personal decision. The final study cohort consisted of 23 RRMS patients with an average age of 47 (3.9) years with median (interquartile range, IQR) disease duration of 12.0 (6.7–14.0) years and EDSS 3.0 (2.5–3.0) at baseline. The demographic, clinical and MRI volumetric parameters of the study participants at baseline and after the 5-year follow-up are presented in Table 1. The majority of the patients (74%) were females, and most patients (87%) were using moderate efficacy DMT at baseline while the rest of the patients had no treatment. Detailed information on DMT exposure during the study and prior to study enrollment are presented in Supplemental Table 2 and Supplemental Appendix 1. No difference in the time on DMT before baseline was observed between SPMS convertors and non-convertors (p = 0.18). Furthermore, no correlations between time on DMT and baseline imaging or soluble biomarker measurements were observed (data not shown). During follow-up, nine patients experienced a relapse, and five patients had a new focal T2 lesion in brain MRI. DMT was escalated to high-efficacy therapy in seven patients (30%) due to relapses or radiological activity (n = 4, 57%), disease worsening (n = 2, 29%) or side effects (n = 1, 14%). Compared to age- and sex-matched HCs, MS-patients had higher DVR values in the NAWM (1.22 (0.05) vs 1.18 (0.04); p = 0.030) and thalamus (1.35 (0.07) vs 1.31 (0.06); p = 0.002) but not in the cGM (Figure 2). Demographic and additional imaging data of HCs is presented in Supplemental Table 3.
Demographic, clinical, and MRI imaging characteristics of the study cohort.

Values are stated as mean (SD), unless otherwise stated. p-values are from t-test (last column) or paired t-test (“change p-value”) for variables with mean (SD), Wilcoxon rank-sum test (last column) or Wilcoxon signed-rank (“change p-value”) test for variables with median (IQR) and Fisher’s exact test for DMT. Disease duration is from diagnosis. Moderate DMTs include interferons, glatiramer acetate, teriflunomide, and fingolimod. High-efficacy DMTs include cladribine, rituximab, and natalizumab. Significant p-values are bolded.
Comparison of baseline values except for escalation in DMT.
Cladribine (n = 3), rituximab (n = 3), natalizumab (n = 1).
DMT, disease-modifying therapy; EDSS, Expanded Disability Status Scale; GM, gray matter; IQR, interquartile range; MS, multiple sclerosis; NAWM, normal appearing white matter; SPMS, secondary progressive multiple sclerosis.

[11C](R)-PK11195 DVR values of MS patients and HCs. MS-patients had higher DVRs in the NAWM (a) and the thalamus (b) compared to HCs. In cortical GM (c) there was no difference between MS patients and HCs. Welch’s t-test was used for comparisons. Boxplots show the medians, interquartile intervals, and minimum and maximum values. Outliers are represented as black dots.
After a mean follow-up time of 5.0 (0.4) years, eight patients (35%) were determined to have converted to SPMS based on the history of gradual worsening of symptoms and an increase in EDSS during the study (Supplemental Table 1). The median (IQR) EDSS of SPMS convertors increased significantly from 3.3 (2.9–4.0) to 4.0 (3.8–4.9) (p = 0.013). A slight increase in EDSS was also observed in eight patients (increase of 0.5 points in seven patients, and 1.5 points in one patient) who nevertheless were considered to retain their RRMS status at the end of the follow-up. In four of them, the increase in EDSS associated with new inflammatory activity (new T2 lesions or relapses) during the study (relapse-associated worsening, RAW). In rest of them, the patient nor the examining neurologist recognized an increase in SAW or in other permanent progression-related symptoms (Table 1). A reduction in brain, cGM, and thalamus volume, and increase in T1 lesion load was observed both in SPMS convertors and SPMS non-convertors (Table 1).
Clinical and MRI parameters and conversion to SPMS phenotype
No difference in age, gender, disease duration, or DMT status between SPMS convertors and non-convertors was observed, but SPMS convertors had higher median (IQR) EDSS at baseline compared to non-convertors (3.3 (2.9–4.0) vs 2.5 (2.3–3), p = 0.028) (Table 1). Additionally, thalamus volume at baseline was smaller in patients who converted to SPMS compared to non-convertors (12.4 (1.8) vs 14.2 (1.8); p = 0.040). No difference in other MRI volumetric parameters between SPMS convertors and non-convertors was observed (Table 1). PRLs were observed in 12 patients (52%) with median (IQR) number of 1 (0–1.5). No difference in the number of PRLs was observed between SPMS convertors and non-convertors (Figure 3(a)).
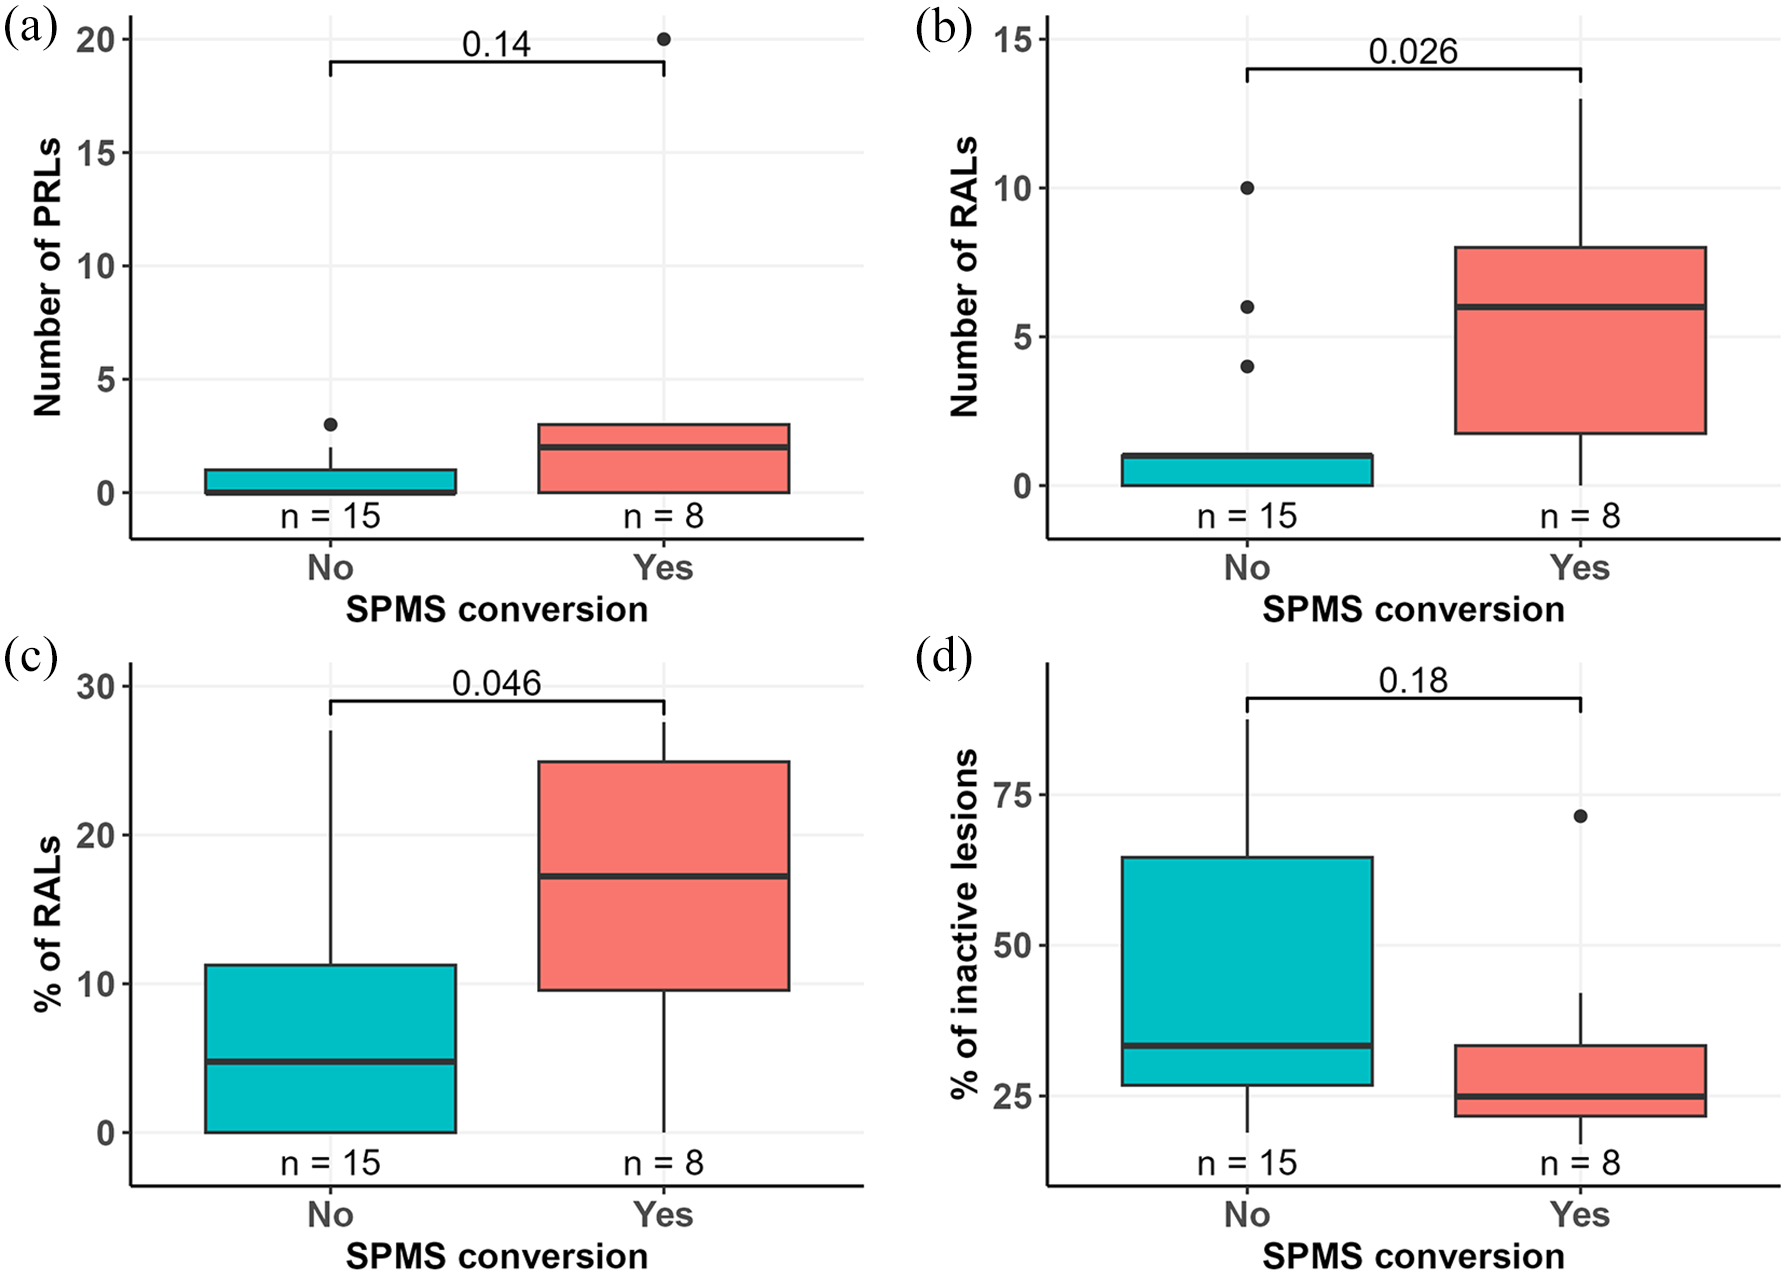
Prevalence of lesion subtypes in relation to later SPMS conversion. The number of PRLs detected using QSM-MRI 2–4 years after baseline PET-imaging did not differ between SPMS convertors and non-convertors (a). The number (b) and proportion (c) of RALs detected using TSPO-PET at baseline were higher in patients who converted to SPMS during follow-up compared to patients who did not convert to SPMS. (d) Proportion of inactive lesions did not differ between the two groups. Wilcoxon rank-sum test was used for group comparisons. Boxplots show the medians, interquartile intervals, and minimum and maximum values. Outliers are represented as black dots.
Serum biomarkers and conversion to SPMS phenotype
The median (IQR) sGFAP concentration in all patients with MS was 97 (67–112) pg/ml. A higher sGFAP concentration was observed in SPMS convertors compared to non-convertors (106 (100–115) vs 73 (63–104) pg/ml; p = 0.034) (Figure 4(a)). The median (IQR) sNfL concentration in all patients with MS was 8.3 (7.2–10.7) pg/ml with slightly higher sNfL concentrations in SPMS convertors, but this difference did not reach statistical significance (11 (8.4–15) vs 8.0 (6.9–8.8) pg/ml; p = 0.076) (Figure 4(b)). Age-, BMI-, and sex-adjusted sGFAP z-scores were also slightly higher among SPMS convertors (mean 0.85, SD 0.64) compared to non-convertors (mean 0.13, SD 1.07), but the difference did not reach statistical significance (p = 0.056) (Figure 4(c)). However, no significant difference in sNfL z-scores was observed between SPMS convertors (mean 0.95, SD 1.09) and non-convertors (mean 0.17, SD 0.93), p = 0.11 (Figure 4(d)).
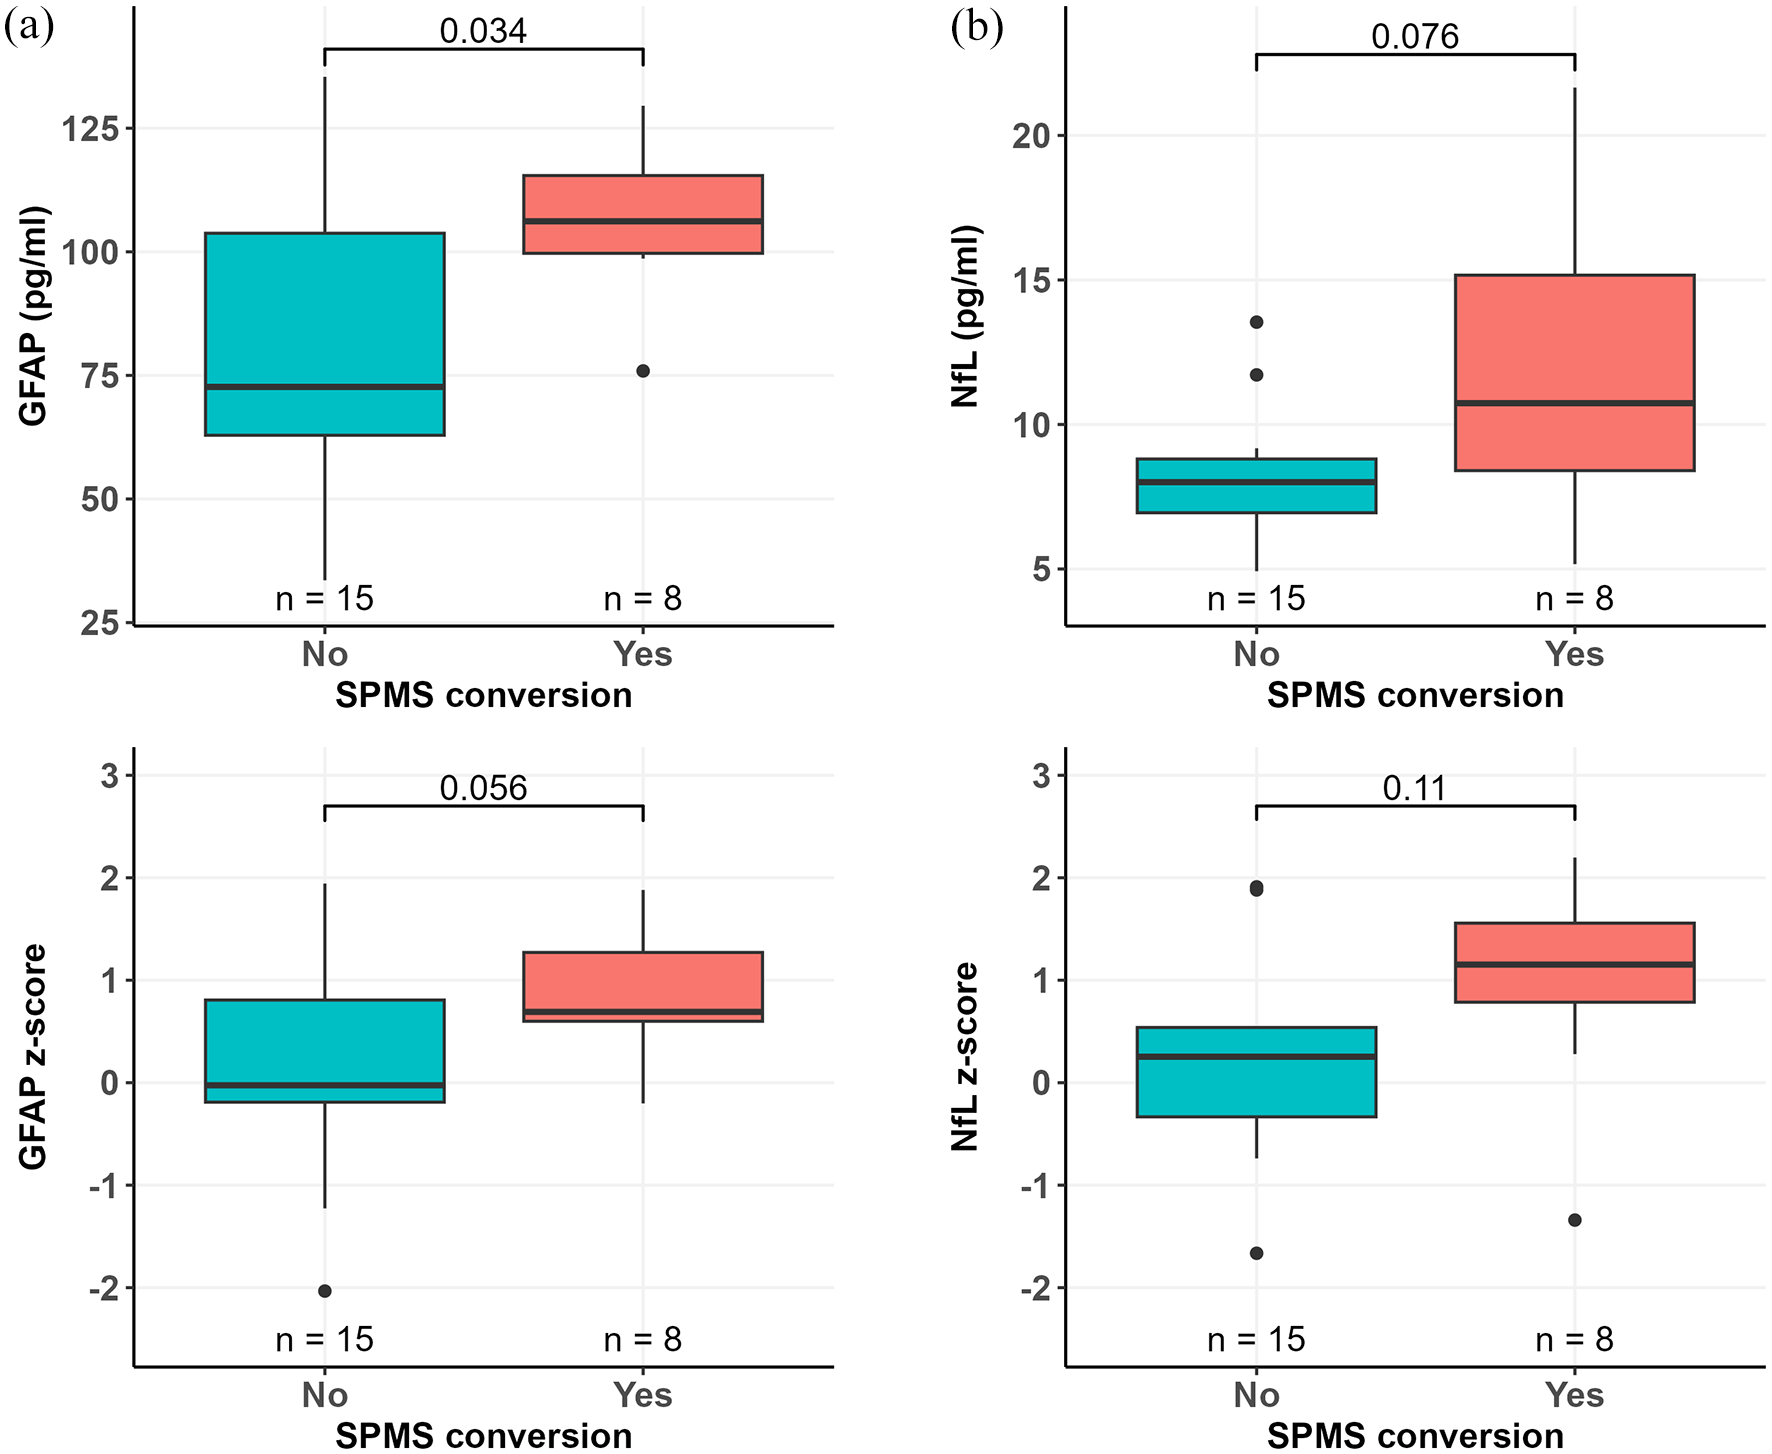
Serum GFAP and NfL concentrations in SPMS convertors and non-convertors. Patients who converted to SPMS had higher serum GFAP concentration at baseline compared to patients who did not convert to SPMS (a). There was a trend for higher baseline serum NfL concentration among SPMS convertors compared to non-convertors (b). sGFAP z-scores were slightly higher in patients who converted to SPMS but with no statistical difference compared to patients who did not convert to SPMS (c). No significant difference in sNfL z-scores between SPMS convertors and non-convertors was observed (d). Wilcoxon rank-sum test (a, b) or Welch’s t-test (c, d) was used for group comparisons. Boxplots show the medians, interquartile intervals, and minimum and maximum values. Outliers are represented as black dots.
TSPO-binding in the NAWM and thalamus and conversion to SPMS phenotype
SPMS convertors had higher DVR values than non-convertors at baseline in the NAWM (1.25 (0.04) vs 1.21 (0.05); p = 0.049), thalamus (1.39 (0.05) vs 1.33 (0.07); p = 0.022), and perilesional area (1.26 (0.05) vs 1.18 (0.06); p = 0.006) (Figure 5(a)–(c)). Proportion of active voxels in thalamus at baseline was higher in SPMS convertors compared to non-convertors (34 (6.7) vs 25 (9.6); p = 0.023). No difference in the proportion of active voxels in the NAWM or perilesional area was observed between the two groups (Figure 5(d)–(f)).

TSPO-binding in SPMS convertors and non-convertors. Patients who converted to SPMS had higher [11C](R)-PK11195 DVRs at baseline in the NAWM (a), in the thalamus (b) and T1 perilesional area (c) compared to patients who did not convert to SPMS. Furthermore, patients who converted to SPMS had higher proportion of active voxels in the thalamus (e), but not in the NAWM (d) or T1 perilesional area (f). Proportion of active voxels in perilesional area was calculated only from active lesions. Welsch’s test (a–e) or Wilcoxon rank-sum test (f) was used for comparisons. Boxplots show the medians, interquartile intervals, and minimum and maximum values. Outliers are represented as black dots.
TSPO-binding in lesions and conversion to SPMS phenotype
TSPO-RALs were observed at baseline in 16 patients with median (IQR) number of 1 (0–6). The number of RALs among SPMS convertors was higher compared to non-convertors (6 (1.75–8) vs 1 (0–1); p = 0.026) (Figure 3(b)). Moreover, the proportion (median (IQR)) of RALs of all chronic T1 lesions was higher in SPMS convertors compared to non-convertors (17.2% (9.6–24.9) vs 4.8% (0–11.2); p = 0.046) (Figure 3(c)). The proportion of inactive lesions did not associate with SPMS conversion during follow-up (Figure 3(d)).
Summary of studied prognosticators of conversion to SPMS phenotype
Figure 6 presents a summary of potential prognosticators of later SPMS conversion. Among the different studied parameters, the most significant difference between convertors and non-convertors was observed in the perilesional TSPO availability.

Summary of potential prognosticators of later SPMS conversion. The forest plot illustrates the differences in TSPO-PET related parameters, brain volumes, serum biomarkers, and clinical and demographic factors at baseline, and in paramagnetic rim lesions 2–4 years after baseline between patients who converted to SPMS and patients who did not convert to SPMS during the 5-year follow-up. Proportion of active voxels in perilesional area was calculated from active lesions. Group comparisons were made with either Welch’s t-test or Wilcoxon rank-sum test. For EDSS and number of PRLs analysis Wilcoxon rank-sum test with continuity correction was used. Red dots refer to the mean differences (Welch’s t-test) or the median of the differences between the groups (Wilcoxon rank-sum test). Red dots on the right side indicate that non-convertors had higher values than convertors. Red bars refer to 95% confidence interval of the corresponding difference. All values have been divided by standard deviation of the variable for illustration purposes. Significant p-values are bolded.
Discussion
We report here the results from a prospective study characterizing clinical, imaging, and blood biomarker predictors of SPMS conversion. The study inclusion criteria were designed to enrich for patients at risk of progression to ensure a sufficient number of outcome events among a small number of study subjects. The enrichment was implemented by including patients who were still classified as RRMS despite advanced age (40–50 years) and disease duration of minimum 5 years. Based on epidemiological studies, this age range typically coincides with conversion to secondary progression.2,4 At the end of the study, the average age of study participants was 52 years and mean disease duration 17.2 years. In line with our hypothesis, the proportion of patients converting to SPMS was substantially high (34.8%). For comparison, we explored in two MS registries the SPMS conversion age and rate. In Finnish MS register data, we identified 274 RRMS patients in the 40–50-year age range with minimum disease duration of 5 years. After 5-year follow-up, 13.5% (n = 37) of them had converted to SPMS according to the register data, and the mean age of SPMS conversion was 50.4 years (Supplemental Table 4). Similarly, the proportion of converted patients was 15.0% in an RRMS cohort with similar demographics in data from the Royal Melbourne Hospital Neuroimmunology Centre (an unpublished personal communication from Dr. Tomas Kalincik, Melbourne, Australia, data not shown). The lower conversion rates in the register data may reflect the general reluctance to phenotype MS patients as SPMS due to psychological barriers and potential consequences this might have on treatment reimbursements. 28 Moreover, more recent data suggest that with the more efficient disease modifying therapies, conversion to SPMS may be significantly delayed compared to reports from earlier pre-treatment era epidemiological studies.2–6,8,29,30 In contrary to the register cohorts, our study cohort only used moderate-efficacy treatments at the study onset, although a proportion of them did escalate to higher-efficacy therapy during the follow-up. In our study setting, patients were carefully followed to detect subtle signs of progressive disease during the study, which may additionally contribute to the higher proportion of patients acquiring SPMS compared to register data. It is likely that the increase in cognitive symptoms and fatigue were more sensitively captured in our evaluation compared to the EDSS-based SPMS classifiers.31–33 Moreover, in a recent large European MS register study, the time delay between SPMS conversion and its identification using three objective classifiers was over 5 years. 34 It is likely that the age-enrichment implemented in our study increased the proportion of converting patients, and this helped to bring out differences in several studied parameters between the SPMS convertors and non-convertors despite the small number of patients. The importance of an initial cohort enrichment is further highlighted by a recent study that planned to study predictors of progressive MS, but was unable to follow the plan, because only few of the included patients converted to SPMS. 35 Importantly, cohort enrichment could also be utilized in early clinical trials of treatments potentially slowing down or preventing MS disease progression. This would increase the likelihood of outcome events and would enable smaller numbers of study subjects.
We chose to address the performance of previously well-characterized clinical, imaging, and soluble biomarker parameters in predicting conversion to SPMS. In prospective follow-up studies T2 lesion number and volume, lower normalized brain volume and increased sGFAP levels measured at baseline were previously shown to predict later conversion of secondary progression over 9.1 and 10.0 years, respectively.36,37 Moreover, RRMS patients with at least one PRL have shown higher rate of progression to SPMS after 9 years follow-up. 38 Real life register-based studies have mainly studied clinical and demographical factors predicting SPMS conversion. In register data older age at disease onset, longer disease duration, higher EDSS score, or multiple sclerosis severity score (MSSS), and more rapid disability worsening measured at baseline associated with SPMS conversion.8,29,39 Several other studies have addressed the risk of later progression associated with studied biomarkers without exactly considering the SPMS conversion aspect.17,37,38,40–52 Some of the studied parameters, such as the PET-based imaging metrics, are more suitable for research purposes including early-phase clinical trials. 53 Other relevant parameters of interest, such as NfL and GFAP, MRI-metrics and clinical patient characteristics can be assessed in MS clinic already today. The biomarker measurements have been validated for utilization in clinical follow-up of patients.43,54,55 Quantitative MRI still needs validation before routine application in clinical practice.56,57 Special platforms providing MRI quantitation will likely be useful here.58,59
There are several aspects that should be considered when interpreting the results. The small cohort size (n = 23) is a critical weakness of this study and prevents adjustment of the results for confounding factors such as changes in DMT and disease duration with multivariable models (e.g., logistic regression, penalized regression). While designing this work, we aimed to perform an exploratory study with comprehensive analysis of patients using advanced imaging and soluble biomarker analysis with careful longitudinal clinical follow-up. With these aims, we assessed that inclusion of 25 study subjects would be feasible considering the technical challenges and cost of PET-imaging. Unfortunately, two patients dropped out during the study. From sample size point of view, in TSPO-PET-studies a group size of 10 is generally sufficient to demonstrate differences in target availability between the groups. 60 Still the results of this study should be interpreted with caution due to the limited cohort size, and it will be valuable to validate the results in a larger cohort. Here, well-curated MS registers may be of assistance. It must also be noted that the results are potentially mainly applicable for similar cohorts enriched for risk of progression. As this was a real-world patient cohort, patients had used different low–moderate efficacy DMTs during their disease course before enrollment to the study, which might have influenced baseline measurements. Moreover, DMT was escalated to high-efficacy therapy during follow-up in a proportion of patients because of clinical or radiological disease activity, which may have influenced the disease course. To address the impact of DMTs either used previously or during the study, we performed detailed analyses of DMT exposure and explored also possible effect of earlier DMT exposure on baseline biomarker measurements. No difference in the time on DMT before baseline was observed, and time on DMT before baseline did not correlate with any studied biomarkers at baseline (TSPO-PET imaging parameters, number of PRLs, MRI volumetric measurements, and serum biomarkers). In defining SPMS conversion, we applied the present classification criteria by Lublin, 1 but paid special attention to the symptoms and findings experienced by the patient at the last visit, with careful clinical evaluation of these by an experienced neurologist blinded for all baseline imaging and soluble biomarker evaluations. Only when there was mutual agreement about the increase in symptoms related to progression at the last visit between the patient and the evaluating neurologist, was SPMS conversion defined. We feel that this comprehensive evaluation captured the SPMS conversion sensitively and reliably, even in the presence of a modest increase in EDSS score. QSM sequence was added to the MRI protocol 2–4 years after baseline, and PRLs were evaluated from the first QSM MRI available, which shortened the follow-up time and might have affected our results. However, as PRLs typically develop during RRMS phase and remain stable for up to 7 years,38,61 this was not considered to interfere significantly with the interpretation of results regarding PRLs. Moreover, we have previously demonstrated an association of increased sNfL levels with perilesional TSPO binding, 26 which was a strong predictor of SPMS conversion in the current study, but the relationship between soluble biomarkers and advanced imaging findings remains to be further elucidated in larger cohorts. Finally, we acknowledge that in MS, the progression-promoting pathological mechanisms may start early in the disease course, and the division of patients into RRMS and SPMS based on clinical phenotyping may lose some significance with wider application of methods for smoldering pathology assessment available in the future.10,12
Conclusion
Validated biomarkers and diagnostic tools to define progressive MS are needed to guide treatment decisions in daily clinical practice, and to facilitate the development of new efficient treatments for SPMS. The results from this study suggest that imaging and serum biomarkers reporting on smoldering CNS pathology support identification of MS patients at risk of SPMS conversion. Evaluation of thalamic atrophy and measurement of soluble biomarkers, especially GFAP, could be implemented in the assessment of progression risk in daily clinical practice. For example, SPMS convertors in this cohort had 45% higher GFAP values. Nevertheless, larger studies are needed to validate the usefulness of these predictors. Importantly, these measurements will become particularly relevant when therapies modifying SP disease course will become available. 62 Moreover, in studies of progressive MS, cohorts could be enriched for risk of progression based on age, disease duration, serum GFAP, and thalamus volume. The usefulness of TSPO-PET for progression risk stratification is limited by high costs and technical and infrastructural demands, although TSPO-PET might be able to identify patients with higher risk for progression even before the development of brain atrophy. In addition, the association of TSPO-RALs and increased NAWM TSPO availability with increased risk of SPMS conversion implies that TSPO-PET could be used as a therapeutic outcome measure in future clinical trials targeting microglial cells and progression-related pathology.
Supplemental Material
sj-docx-1-tan-10.1177_17562864251357276 – Supplemental material for Predictors of risk of secondary progression in multiple sclerosis
Supplemental material, sj-docx-1-tan-10.1177_17562864251357276 for Predictors of risk of secondary progression in multiple sclerosis by Sini Laaksonen, Marcus Sucksdorff, Anna Vuorimaa, Jens Kuhle, Marjo Nylund, Johan Rajander, Saara Wahlroos, Markus Matilainen, Maija Saraste and Laura Airas in Therapeutic Advances in Neurological Disorders
Footnotes
Acknowledgements
We thank all the study participants and the professional staff of Turku PET Centre for making this study possible. We are very grateful for Dr. Tomas Kalincik, Melbourne, Australia, for providing SPMS conversion information from the Royal Melbourne Hospital Neuroimmunology Centre register data, and thank M.Sc. Matias Viitala for providing SPMS conversion data from the Finnish MS register.
Declarations
Supplemental material
Supplemental material for this article is available online.
References
Supplementary Material
Please find the following supplemental material available below.
For Open Access articles published under a Creative Commons License, all supplemental material carries the same license as the article it is associated with.
For non-Open Access articles published, all supplemental material carries a non-exclusive license, and permission requests for re-use of supplemental material or any part of supplemental material shall be sent directly to the copyright owner as specified in the copyright notice associated with the article.