
Abstract
Background:
Cladribine, an oral prodrug, penetrates the blood–brain barrier, impacting biomarkers of disease progression within the central nervous system.
Objectives:
Describe disease activity in cladribine tablets (CladT)-treated people with highly active relapsing multiple sclerosis (pwRMS) using clinical outcomes and biomarkers.
Design:
MAGNIFY-MS was an open-label, single-arm, phase IV trial with four sub-studies. Participants were grouped by previous treatment (Tx); Tx-naïve versus Tx-experienced; those with previous exposure to second-line therapies were excluded. This analysis describes cerebrospinal fluid (CSF) and optical coherence tomography (OCT) sub-studies. CSF sub-study participants were stratified by the number of oligoclonal bands (OCBs) at baseline (≥2/≥4).
Methods:
Logistic regression analysis is reported for no evidence of disease activity (NEDA)-3 and no evidence of progression or active disease (NEPAD) at Year (Y)1 and Y2, and annualized relapse rate (ARR) at Y2. Changes in intrathecal (OCBs, kappa free light chain [KFLC], immunoglobulin [Ig]G and IgM indices), OCT measures, and neuroaxonal degeneration (neurofilament light chain [NfL]) biomarkers are reported at baseline, month (M)12, and M24.
Results:
MAGNIFY-MS included 270 pwRMS; 28 and 36 were included in the CSF and OCT sub-studies, respectively. In Y2, estimated rates of NEDA-3 were 64.1% overall and 69.1% in the Tx-naïve group. The estimated rate of NEPAD overall was 60.2% in Y2. The estimated ARR was 0.09 from baseline to M24 (Tx-naïve participants, 0.04). In participants with ≥2 OCBs at baseline (n = 17), 76.5% had OCB reduction or disappearance at least once in the study. KFLC and IgG indices were reduced at M24 versus baseline. Sustained reductions were observed in median NfL, while IgG and IgM remained within normal ranges for most participants. Mean OCT measurements showed no retinal nerve fiber thinning.
Conclusion:
For CladT-treated pwRMS, disease activity and biomarkers of intrathecal inflammation and neuroaxonal damage were reduced versus baseline.
Trial registration:
ClinicalTrials.gov identifier, NCT03364036. Date registered: June 12, 2017. Date first patient enrolled: May 28, 2018. https://clinicaltrials.gov/study/NCT03364036. Extension study ClinicalTrials.gov Identifier: NCT04783935. Date registered: March 05, 2021. Date first patient enrolled: March 10, 2021. https://clinicaltrials.gov/study/NCT04783935.
Keywords
Introduction
The impact of high-efficacy disease-modifying therapies (DMTs) for people with relapsing multiple sclerosis (pwRMS) is typically evaluated through various metrics, including annualized relapse rate (ARR), confirmed disability progression, and the quantity and severity of magnetic resonance imaging (MRI) lesions, alongside emerging indicators of central inflammation. 1 Variations in these efficacy measures may stem from their peripheral effects and their capacity to penetrate the central nervous system (CNS), influencing biomarkers of disease activity both peripherally and within the CNS itself. Cladribine, a small molecule capable of crossing the blood–brain barrier (BBB) and circulating in the cerebrospinal fluid (CSF), 2 functions as an immune reconstitution therapy (IRT) and exhibits distinct effects on the immune system compared to other high-efficacy DMTs.3,4
Data from the first 6 months of the MAGNIFY-MS study (NCT03364036) have previously indicated an onset of cladribine tablets (CladT) action from month 2 onward. 5 This report presents a 2-year observational period and facilitates a thorough assessment of the pleiotropic effects of CladT on traditional clinical endpoints, such as no evidence of disease activity (NEDA)-3 and no evidence of progression or active disease (NEPAD), and biomarkers related to inflammation, intrathecal humoral immune response, and neuroaxonal damage.
The CSF sub-study investigated the impact of CladT on terminally differentiated B cells within the CNS, as indicated by oligoclonal bands (OCBs), immunoglobulins (Ig), kappa free light chain (KFLC), and neurofilament light chain (NfL). 6 The optical coherence tomography (OCT) sub-study examined the influence of CladT on axonal degeneration in the optic nerve by monitoring alterations in retinal nerve fiber layer (RNFL) and ganglion cell layer/inner plexiform layer (GCL/IPL), which are linked to brain volume, cognitive function, and disability in pwRMS.7–10 Findings from these studies enhance the mechanistic understanding of the clinical implications of CladT in pwRMS.
Methods
Study design
MAGNIFY-MS was a phase IV, open-label, single-arm, 2-year study that enrolled pwRMS between May 28, 2018, and April 23, 2019. The study design, including inclusion and exclusion criteria, dosing regimen, and procedures for screening and follow-up visits, has been previously reported. 5 Safety data were collected on an ongoing basis. PwRMS were excluded if previously exposed to selected second-line DMT (fingolimod, natalizumab, alemtuzumab, mitoxantrone, or ocrelizumab).
CSF and OCT sub-studies
All pwRMS from the MAGNIFY-MS study were given the choice to participate in the exploratory CSF and/or OCT sub-studies. Participants were eligible for the OCT sub-study—with measurements made at baseline and at month (M)12 and M24—if they did not suffer from severe myopia superior to five diopters or a comorbid ocular condition not related to MS (including glaucoma, hypoplasia of the optic nerve, macular hole, vitreomacular traction, diabetes, and other diseases of the optic nerve). CSF samples for OCBs, immunoglobulins, KFLC, and NfL were taken at baseline prior to initiating treatment with CladT, and at M12 and M24. IgG and IgM indices were calculated as (CSF immunoglobulin × serum albumin)/(serum immunoglobulin × CSF albumin). 11 The cutoff for baseline samples of the IgG and IgM indices was established, respectively, at >0.7 and >0.1, as previously reported.12,13 KFLC index was calculated as (CSF KFLC/serum KFLC)/(CSF albumin/serum albumin). 14 The cutoff for baseline samples of the KFLC index was established at ≥6.1, as previously reported.15,16 IgG and IgM in serum and CSF were measured with nephelometry at the central study laboratory. Samples that did not meet the quality requirements were excluded from testing. KFLC and albumin in sera and CSF were measured with nephelometry with the N Latex free light chain kappa kit on the Siemens® Atellica NEPH 630 System at Sanquin HQ, Amsterdam, The Netherlands. All assays were conducted as per validated procedures available at the respective analytical laboratories. OCBs were determined using the Helena SPIFE® Touch IgG IEF-20 oligoclonal banding assay, which uses agarose gel isoelectric focusing and immunoblotting on the Helena SPIFE 3000 System. NfL in serum and CSF was measured with the Quanterix Simoa® NF-L assay (Quanterix NF-Light Advantage kit) on a Quanterix Simoa HD-1 Analyzer. Sites participating in the OCT sub-study were certified by the central reading center (Calyx AI) as either a Zeiss Cirrus or Heidelberg Spectralis SD-OCT site, based on the technology that was available at the time of the study. Cirrus and Spectralis do not offer the same analysis for GCL/IPL, so steps were taken during analysis to match the Spectralis measurements to those generated by the Cirrus software. Scans of both eyes were acquired, recording scan position, iris image clarity, and signal strength. Eye tracking and repeat scan overlay/registration were utilized, if available. All images included in the analysis met the OSCAR-IB quality criteria. 17 For all sites, the scan protocol was performed a minimum of two times for each participant at each study visit, to ensure adequate images of sufficient quality. Further details are described in the Supplemental Material.
Clinical outcomes: ARR, NEDA-3, and NEPAD
ARR, defined as the number of relapses per year, was calculated for the period from baseline to M24 for MAGNIFY-MS (NCT03364036) participants who entered the 2-year MAGNIFY-MS Extension study (NCT04783935). Participants were grouped into treatment-naïve (Tx-naïve) and treatment-experienced (Tx-experienced) subgroups. NEDA-3 was defined as an absence of MRI activity, 6-month confirmed disability progression (6mCDP; an increase in Expanded Disability Status Scale [EDSS] score sustained over two consecutive visits), and qualifying relapses. Investigators assessed whether the EDSS criterion for relapse was fulfilled. MRI activity was defined as ≥1 T1 gadolinium-enhancing (Gd+) lesion on any scan or ≥1 active (new or enlarging) T2 lesion during any treatment period.
All findings within NEDA-3 were also re-baselined at 6 months to remove any effect of previous DMTs and to account for any possible latency period of CladT efficacy, as recommended by the 2021 MAGNIMS-CMSC-NAIMS consensus. 18 NEDA-3 is presented for treatment course 1 (year [Y]; baseline–M12), treatment course 2 (Y2; M12–M24), and the re-baselined treatment period (M6–M24). MRI scans at baseline and M12 were used for the Y1 period, and at M12 and M24 for the Y2 period. The re-baselined NEDA-3 included MRI scans at M6, M12, and M24. NEPAD was defined as NEDA-3 combined with an absence of 20% progression on the timed 25-foot walk (T25FW) and an absence of 20% progression on the 9-hole peg test (9HPT).
Endpoints of biomarkers
OCB results were stratified by pwRMS who had ≥2 or ≥4 OCBs at baseline. Those with ≥4 OCBs were included in the ≥2 OCB group. The classification of OCBs is described in detail in the Supplemental Material. In participants with ≥2 OCBs and ≥4 OCBs at baseline, OCB count change and complete OCB disappearance were evaluated at M12 and M24 from baseline, as well as between M12 and M24. In CSF and serum, absolute values and changes from baseline in IgG, IgM, and NfL were assessed at M12 and M24.
Change from baseline in RNFL thickness (µm), macular thickness (µm; central subfield, inner inferior, inner nasal, outer superior, outer temporal), macular volume (µL), and GCL/IPL thickness (µm; inferior, inferonasal, inferotemporal, superior, superonasal, superotemporal) were assessed at M12 and M24. Change from baseline in low-contrast letter acuity scores (assessed using Sloan chart at 1.25% and 2.5%) and contrast sensitivity visual acuity scores (assessed by Pelli–Robson chart) were assessed at M12 and M24.
Statistics
All analyses were exploratory and served as a guide for interpretation of the results. Baseline was considered as immediately prior to treatment initiation in Y1. The analyses of baseline demographic characteristics and biomarker parameters were performed on all participants (all pwRMS classified as eligible, and who had taken ≥1 tablet of study medication; and for sub-study analyses, reported with at least one non-missing value of data). NEDA-3 and NEPAD values were analyzed by logistic regression adjusted for age and baseline EDSS (⩽3; >3). The estimated rates showing NEDA-3/NEPAD (for known NEDA-3/NEPAD status) are presented as forest plots including corresponding two-sided 95% confidence intervals (CIs). The analyses of NEDA-3 and NEPAD values were also performed according to treatment history: Tx-naïve or Tx-experienced. The number of participants with complete disappearance or partial changes in OCBs was described at each visit with 95% exact CI (using the Clopper–Pearson method). Median percentage changes from baseline including interquartile range are presented for IgG, IgM, and NfL results. Absolute change and change from baseline are described by mean ± standard deviation (SD) for RNFL, macular thickness, macular volume, GCL/IPL thickness measurements, low-contrast letter acuity (Sloan chart scores), and contrast sensitivity visual acuity (Pelli–Robson chart scores).
In this study, one-way analysis of variance (ANOVA) was employed to assess the differences in means across multiple independent groups. The experimental design involved treatment groups: Baseline, M12, and M24. Data were analyzed using GraphPad Prism version 10.2.1, and SAS version 9.4, which performed the one-way ANOVA with the Geisser–Greenhouse correction to account for any violations of sphericity. Additionally, a mixed-effects model was employed to account for potential variability within the data, allowing for both fixed and random effects. Post hoc comparisons were conducted using the two-stage step-up method to control for the false discovery rate, 19 with a significance level set at p < 0.05. Effect sizes were calculated to quantify the magnitude of differences observed between groups. All results are presented as means ± SD.
Results
A total of 270 pwRMS were included in the parent MAGNIFY-MS study. Of these, 180 (66.7%) were females; 152 (56.3%) were aged ⩽40 years, and 117 (43.3%) were Tx-naïve. The Tx-experienced group had, on average, a longer time since diagnosis or onset of MS, and fewer recent relapses, but similar EDSS scores (Table 1). A total of 28 and 36 pwRMS participated in the CSF and OCT sub-studies, respectively. Three pwRMS participated in both sub-studies.
Baseline demographics and characteristics.

A few differences were observed in the baseline demographics and characteristics of the sub-studies compared to all participants in the parent study. Both sub-studies had a limited sample size. The CSF sub-study had slightly fewer female participants. Furthermore, CSF sub-study participants on average had more recent MS disease, and slightly higher numbers of relapses and baseline EDSS. Participants in the OCT sub-study were older on average, less likely to be Tx-naïve, and less likely to have active T2 lesions compared to the parent study.
Participants were excluded from MAGNIFY-MS if they had previous exposure to alemtuzumab, fingolimod, mitoxantrone, natalizumab, or ocrelizumab.
Missing includes non-evaluable.
CSF, cerebrospinal fluid; DMT, disease-modifying therapy; EDSS, Expanded Disability Status Scale; Gd+, gadolinium-enhancing; MS, multiple sclerosis; NA, not available; OCT, optical coherence tomography; SD, standard deviation; Tx, treatment.
Annualized relapse rate
The estimated ARR of qualifying relapses for the 270 participants in the parent study was 0.11 (95% CI, 0.09, 0.15). Comparisons were performed between the Tx-naïve and Tx-experienced groups of all participants who continued into the MAGNIFY-MS Extension study (N = 219; Supplemental Figure 1). The estimated ARR of qualifying relapses was 0.09 (95% CI, 0.06, 0.12) from baseline to M24 (the whole treatment period) for all 219 in this group. The estimated ARR was 0.04 (95% CI, 0.02, 0.08) for the 89 Tx-naïve participants and 0.11 (95% CI, 0.08, 0.16) for the 130 participants who were Tx-experienced.
No evidence of disease activity
The estimated rates of achieving NEDA-3 were higher during Y2 (M12–M24) of treatment compared to Y1 (baseline–M12) and were higher for the Tx-naïve group compared to the Tx-experienced group. In Y1, the NEDA-3 rate was 32.8% in all participants, 43.0% in Tx-naïve participants, and 24.9% in Tx-experienced participants. Contributions of components to NEDA-3 are shown in Figure 1. In Y2, the NEDA-3 rate was 64.1% in all participants, 69.1% in Tx-naïve participants, and 60.2% in Tx-experienced participants (Figure 1). Of all participants, 93.1% did not experience 6mCDP during Y2. In the re-baselined treatment period (M6–M24), the NEDA-3 rate was 53.1% for all participants, 64.9% for Tx-naïve participants, and 44.1% for Tx-experienced participants (Supplemental Figure 2).

NEDA-3 over Y1 and Y2. NEDA rates are estimated from logistic regression adjusted for age and baseline EDSS (⩽3; >3).
No evidence of progression or active disease
The estimated rates of achieving NEPAD were higher for participants during Y2 of treatment compared to Y1, and higher for the Tx-naïve group compared to the Tx-experienced group. In Y1, the NEPAD rate was 32.1% in all participants, 43.0% in Tx-naïve, and 23.9% in Tx-experienced groups (Figure 2). In Y2, the NEPAD rate was 60.2% in all participants, 67.8% in Tx-naïve, and 54.4% in Tx-experienced groups. Contributions of components to NEPAD are shown in Figure 2: 95.4% and 99.0% of all participants exhibited no 20% confirmed progression in the T25FW and the 9HPT, respectively, in Y2.
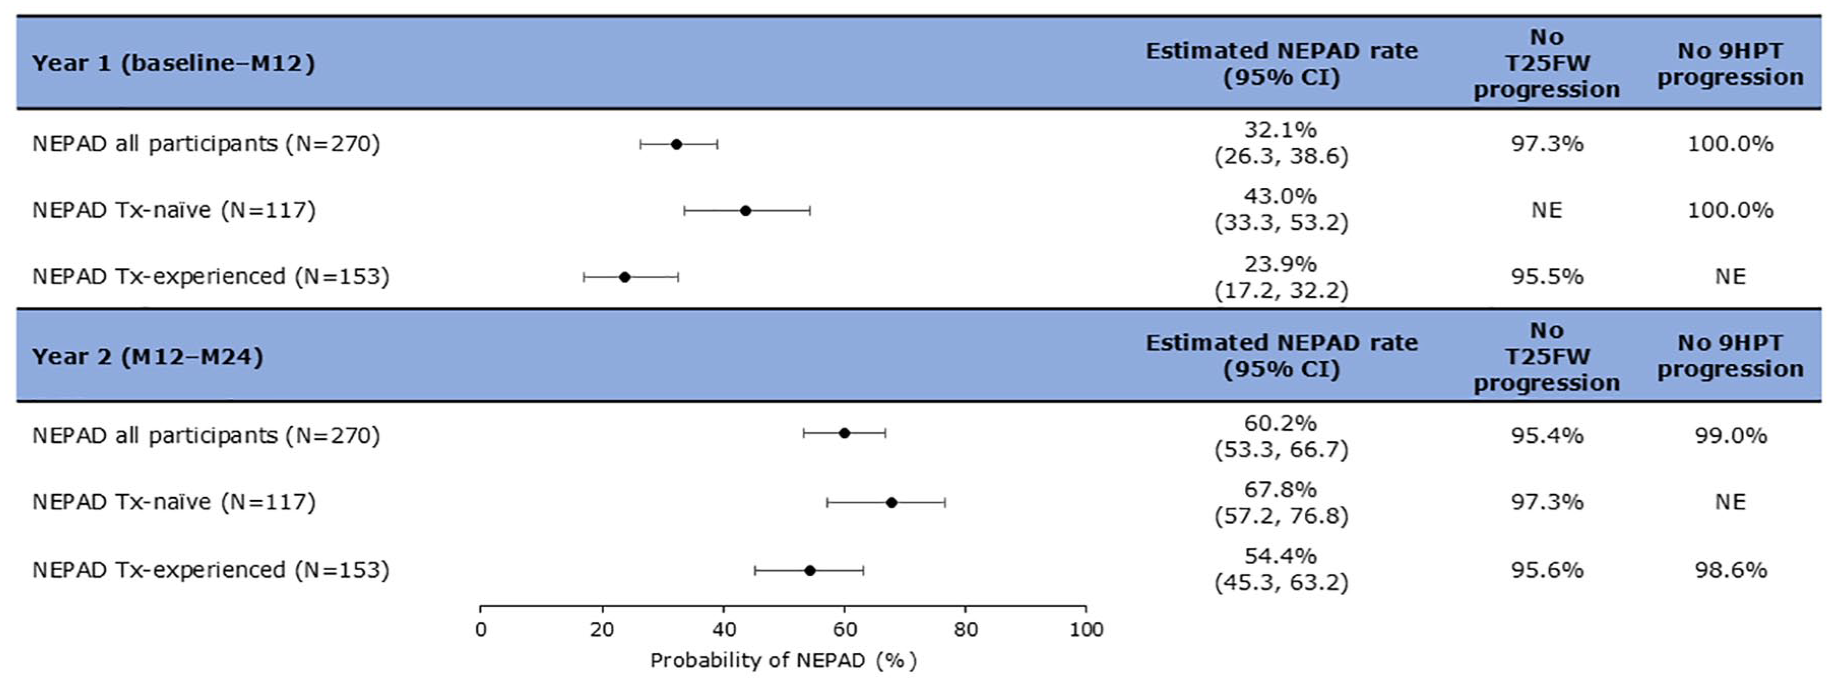
NEPAD over Y1 and Y2. NEPAD rates are estimated from logistic regression adjusted for age and baseline EDSS (⩽3; >3).
OCBs in CSF
Of 17 participants with ≥2 OCBs at baseline, 76.5% (n = 13/17) had OCB reduction or disappearance at least once in the post-baseline visits (M12, M24; Figure 3). Complete disappearance of OCBs was observed in two participants (11.8%) from baseline to M12, and for one of these, the disappearance was maintained to M24. From baseline to M24, a decrease in OCBs occurred in 9 of the 17 (52.9%) participants. For one participant in the ≥2 OCB group, only a baseline value was reported. In the remainder of the participants with ≥2 OCBs at baseline (n = 16), a decrease in OCB counts was seen in 37.5% (n = 6/16; 95% CI, 15.2%, 64.6%) at M12. Between M12 and M24, a decrease in OCB counts was reported for 58.3% (n = 7/12; 95% CI, 27.7%, 84.8%) of participants. Of 13 participants with ≥4 OCBs at baseline, complete disappearance of OCBs was seen in 8.3% (n = 1/12; 95% CI, 0.2%, 38.5%) and 0.0% (n = 0/8; 95% CI, 0.0%, 36.9%) at M12 and M24, respectively (Supplemental Table 1). A decrease in OCB counts was seen in 41.7% (n = 5/12; 95% CI, 15.2%, 72.3%) and 100.0% (n = 8/8; 95% CI, 63.1%, 100.0%) of participants at M12 and M24, respectively. A decrease in OCB counts from M12 to M24 was reported for 75.0% (n = 6/8; 95% CI, 34.9%, 96.8%) of participants.

OCB pattern of evolution for individual participants with ≥2 OCBs at baseline (N = 17).
KFLC index, IgG index, and IgM index
Baseline samples were obtained from 28 pwRMS who signed the informed consent form to participate in the CSF sub-study (Figure 4(a)); however, the sample from one participant was deemed untestable. Among the remaining 27 participants, 22 exhibited baseline KFLC index levels ≥6.1 (mean ± SD: 62.20 ± 77.66; range: 6.81–297.85). A notable trend toward reduction was observed after 24 months of CladT treatment, with the KFLC index decreasing to a mean ± SD of 37.08 ± 30.21 (range: 6.22–91.99; Figure 4(b)).
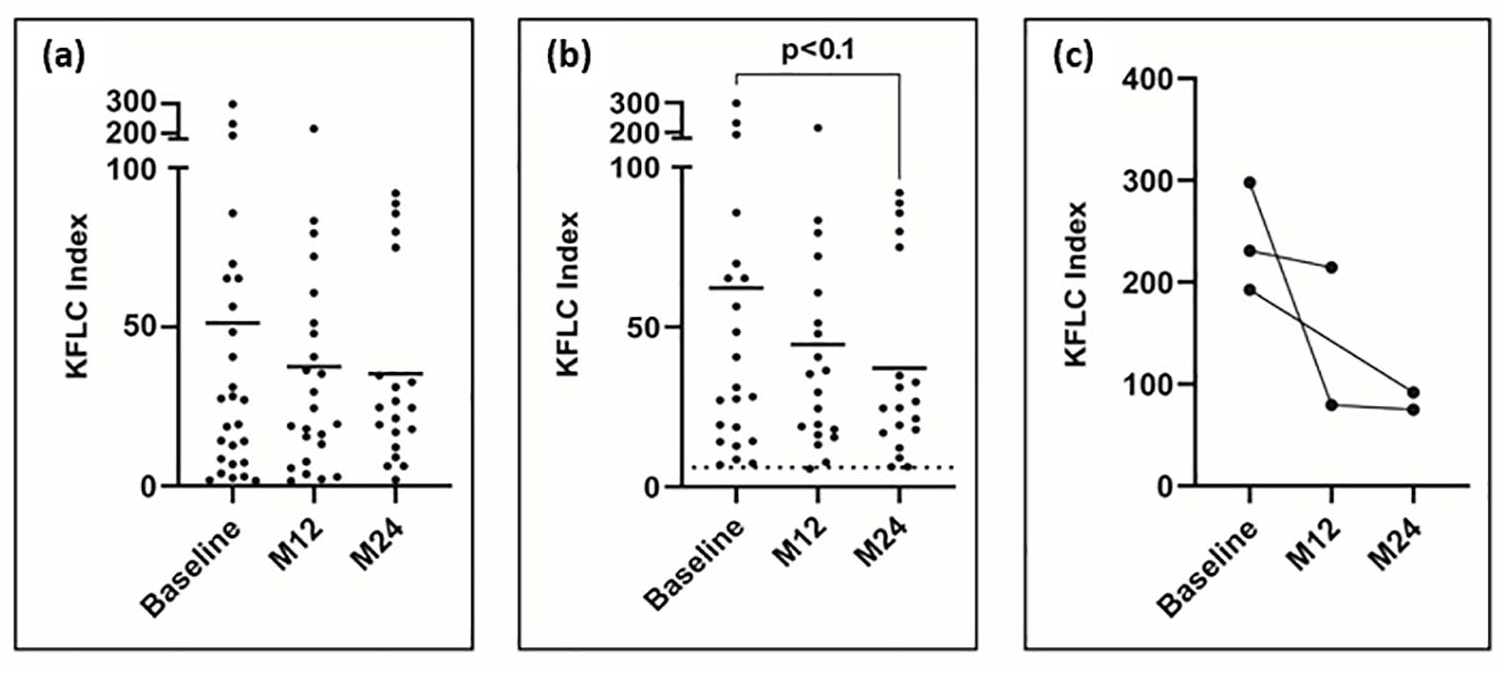
KFLC index. Baseline, n = 27; M12, n = 24; M24, n = 20. (a) Scatter plots display the KFLC index across all available samples, while (b) focuses on samples with a baseline KFLC index of ≥6.1. Bars represent the mean KFLC index at each time point. (c) The before–after plot illustrates individual trends at baseline, M12, and M24.
A KFLC index >100 has been shown to predict future disease activity and progression independent of relapse activity. 20 In our cohort, three pwRMS exhibited values exceeding this threshold. Among them, two participants experienced reductions of 52% and 75% from baseline at M24 in the study. Unfortunately, samples for the third patient at M24 were not available (Figure 4(c)).
Samples from 20 out of 28 pwRMS also met the requirements for measuring the IgG index (Figure 5(a)). Among these 20 participants, 5 individuals demonstrated elevated baseline levels of >0.7 (mean ± SD: 1.05 ± 0.31; range: 1.54 ± 0.78; Figure 5(b)). In this subgroup, a decrease in the IgG index was observed 24 months after treatment initiation for all participants (mean ± SD: 0.72 ± 0.119; Figure 5(c)).
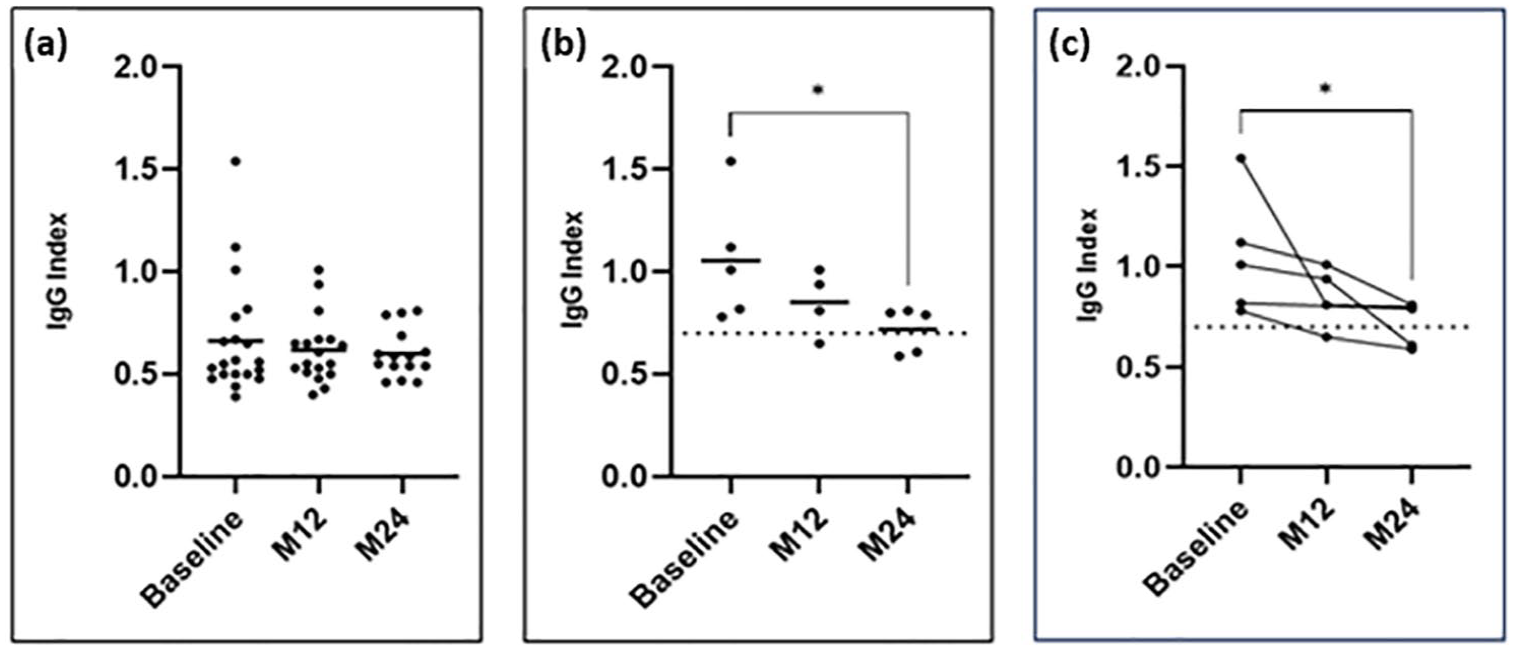
IgG index. Baseline, n = 20; M12, n = 24; M24, n = 20. (a) Scatter plots display the IgG index across all available samples, while (b) focuses on samples with a baseline IgG index of >0.7. Bars represent the mean IgG index at each time point. (c) The before–after plot illustrates individual trends at baseline, M12, and M24.
The IgM index was assessed in 24 out of 28 pwRMS. Among these, seven participants exhibited elevated baseline levels of >0.1. No major changes were observed at the posttreatment time points (Supplemental Figure 3).
NfL in serum and CSF
Sustained reductions in NfL were observed in serum and in CSF. In the 270 pwRMS in MAGNIFY-MS the median percentage change from baseline (n = 261) of serum NfL was −25.2% at M12 (n = 235; p < 0.0001) and −23.2% at M24 (n = 213; p < 0.0001; Figure 6(a)). Regarding NfL in CSF, the median percentage change from baseline (n = 28) for all participants was −58.2% at M12 (n = 27; p < 0.0001) and −56.5% at M24 (n = 19; p = 0.0002; Figure 6(b)). For participants with ≥2 OCBs at baseline, the median percentage change from baseline (n = 17) was −58.4% at M12 (n = 16; p = 0.0013) and −50.9% at M24 (n = 12; p = 0.0015; Figure 6(c)). For participants with ≥4 OCBs at baseline, the median percentage change from baseline (n = 13) was −67.0% at M12 (n = 12; p = 0.0068) and −60.7% at M24 (n = 8; p = 0.0078; Figure 6(d)).

Changes in levels of NfL in serum and CSF over time. Participant numbers may vary due to missing CSF data. Reference ranges for CSF NfL are not available. (a) Serum NfL change from baseline (N=270). (b) CSF NfL change from baseline; total (n=28). (c) CSF NfL change from baseline; ≥2 OCBs at baseline. (d) CSF NfL change from baseline; ≥4 OCBs at baseline.
Immunoglobulin in serum and CSF
For most pwRMS, levels of IgG and IgM in both serum and CSF remained within normal reference ranges: serum IgG 5.65–17.65 g/L; serum IgM 0.40–2.30 g/L; CSF IgG 0–0.0339 g/L; CSF IgM 0–0.001299 g/L (Figure 7). 21
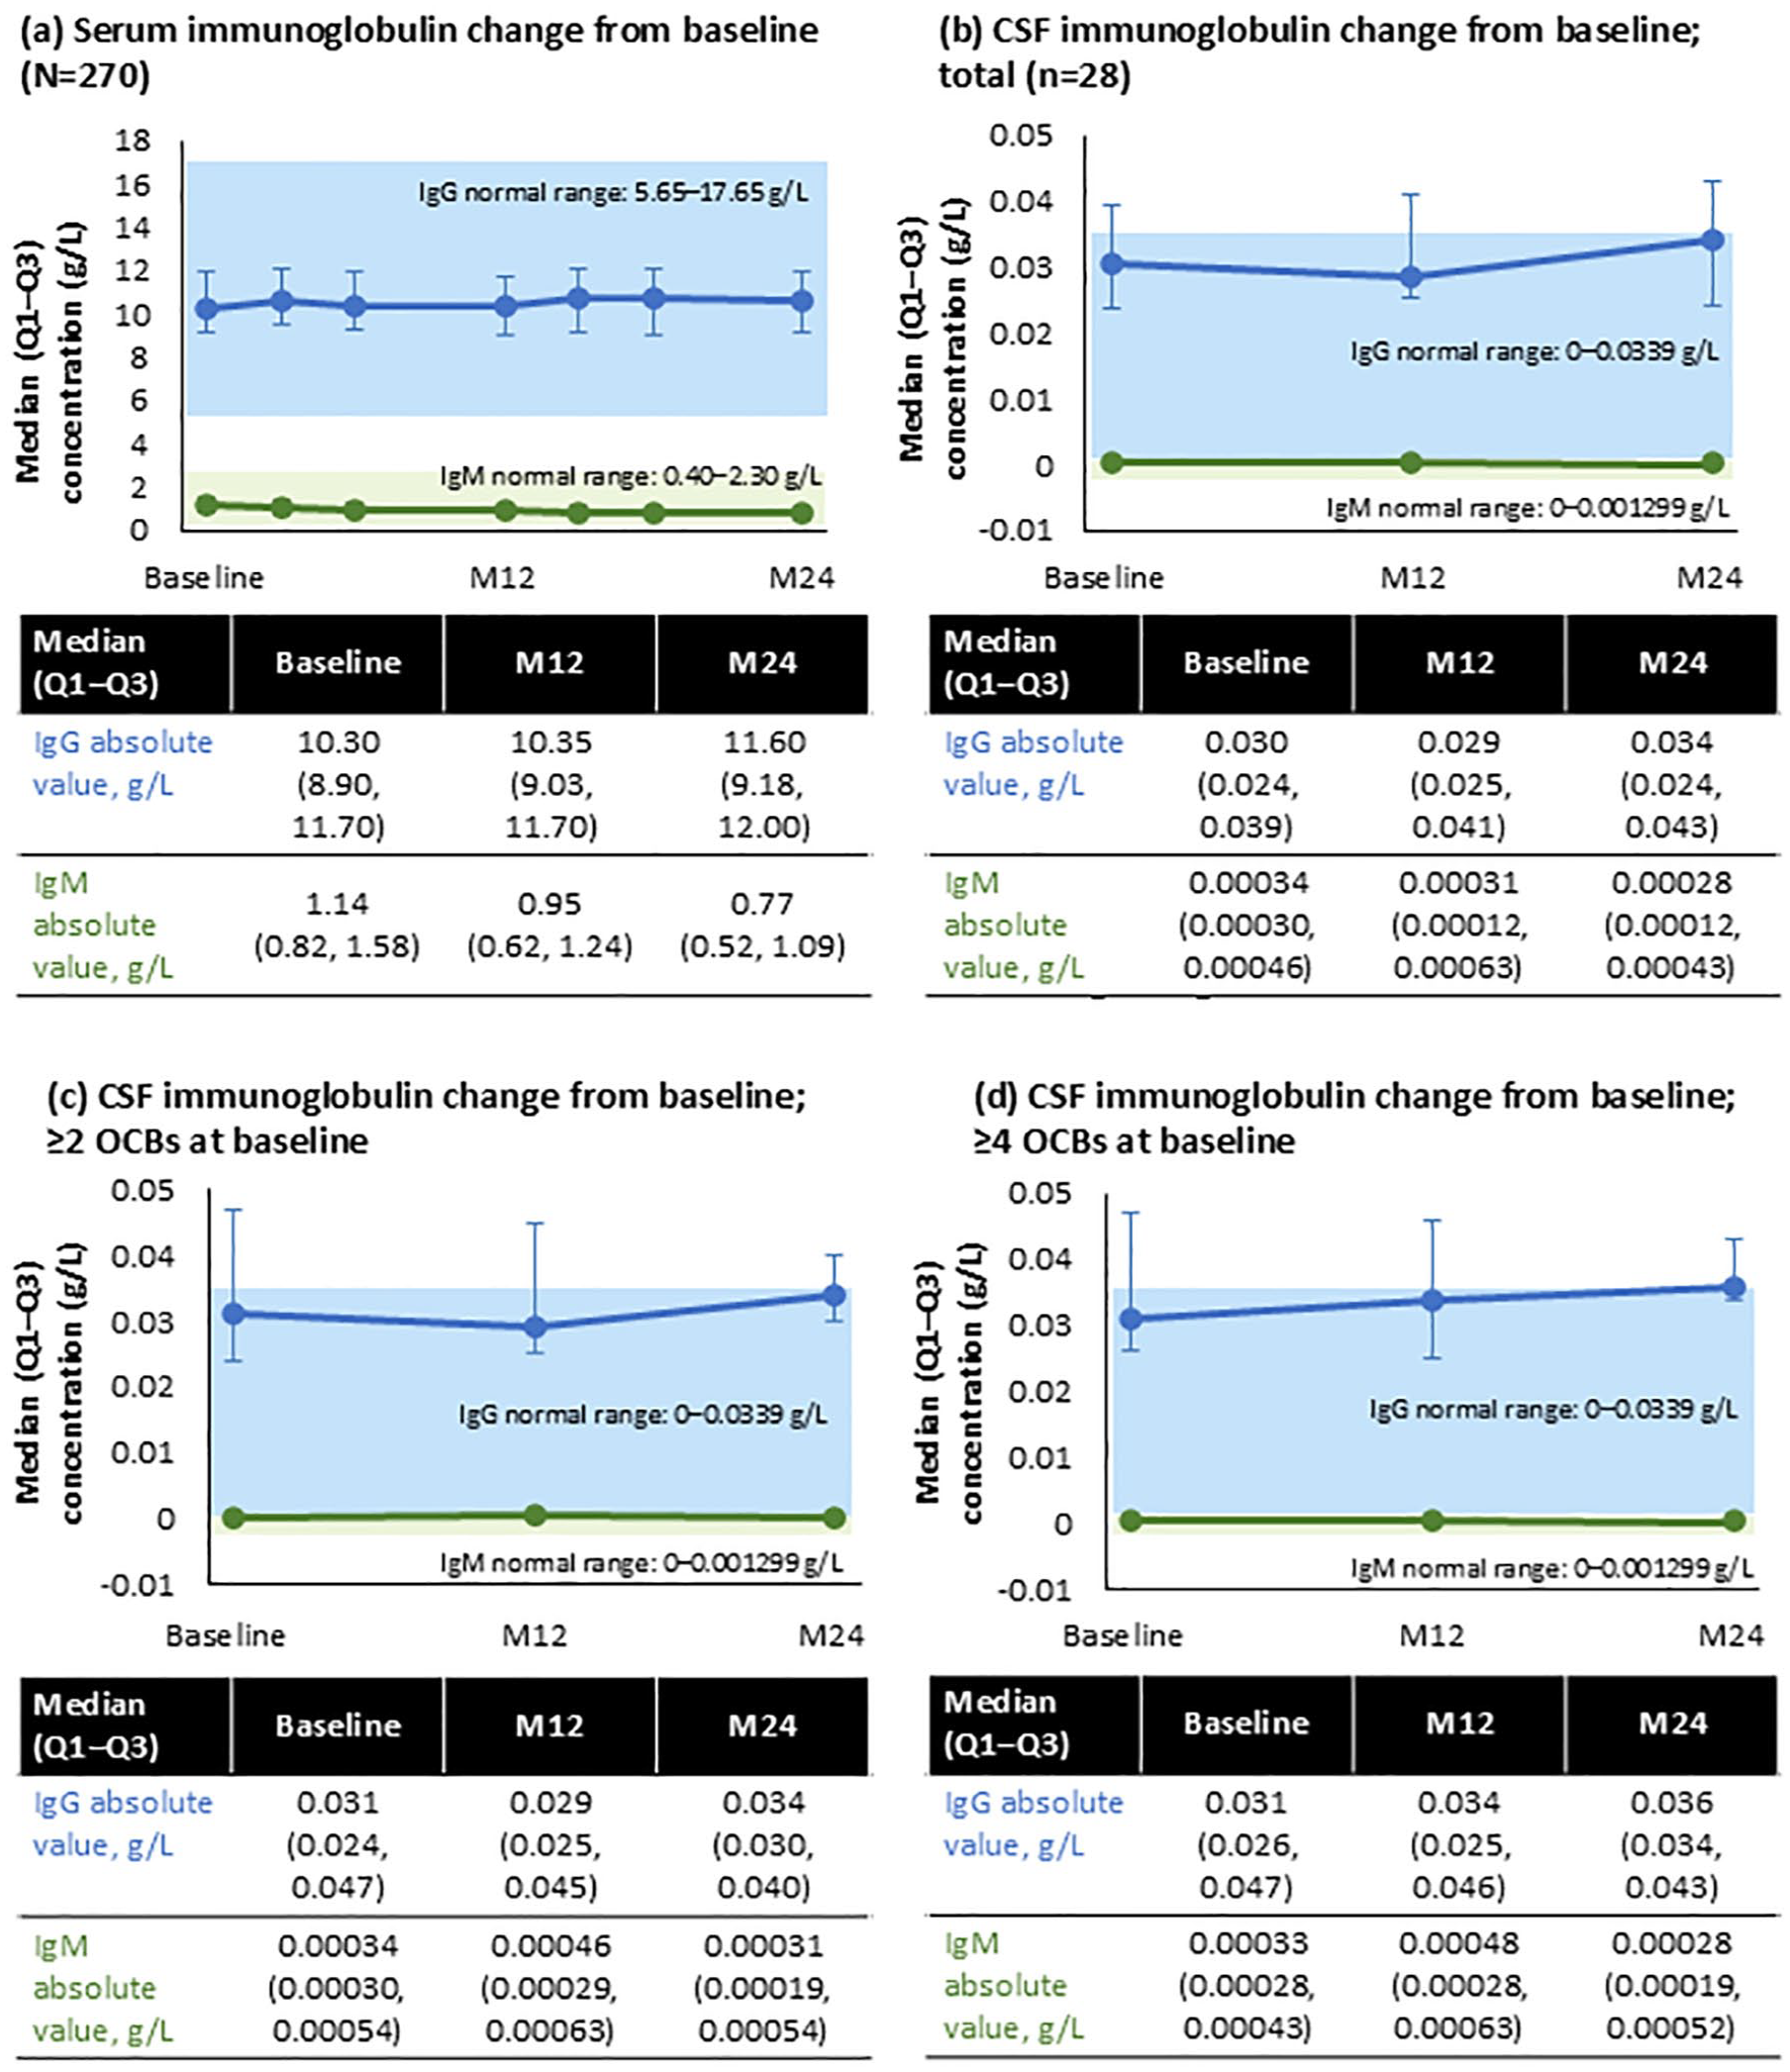
Changes in levels of IgG and IgM in serum and CSF over time. Participant numbers may vary due to missing CSF data. (a) Serum immunoglobulin change from baseline (N=270). (b) CSF immunoglobulin change from baseline; total (n=28). (c) CSF immunoglobulin change from baseline; ≥2 OCBs at baseline. (d) CSF immunoglobulin change from baseline; ≥4 OCBs at baseline.
OCT findings
No changes were observed in the RNFL thickness or other OCT parameters, as detailed in Table 2.
Absolute changes from baseline in OCT measurements (of participants from OCT sub-study, N = 36).

RNFL measurements at M12 were taken for 30 participants.
GCL, ganglion cell layer; IPL, inner plexiform layer; M, month; OCT, optical coherence tomography; RNFL, retinal nerve fiber layer; SD, standard deviation.
Visual acuity findings
In low-contrast letter acuity testing assessed using Sloan charts (n = 36), no change in score was observed at M12 relative to baseline, but improvements were apparent at M24 (Supplemental Table 2). At 1.25% contrast, an improvement in mean ± SD score of 6.3 ± 6.0 was observed. At 2.5% contrast, an improvement in mean ± SD score of 3.8 ± 5.1 was observed. In contrast sensitivity visual acuity testing using Pelli–Robson charts (n = 36), no relevant changes were observed at M12 or M24 relative to baseline (Supplemental Table 3).
Safety
Of the 270 participants in the safety analysis set, 227 (84.1%) experienced a treatment-emergent adverse event (TEAE), and CladT-related TEAEs occurred in 122 participants (45.2%, Supplemental Table 4). Serious TEAEs occurred in 14 participants (5.2%), and TEAEs led to temporary or permanent discontinuation of CladT in 4 (1.5%) and 1 (0.4%) participant(s), respectively. No TEAEs led to dose reduction or death. The most common TEAEs were headache (32.2%), nasopharyngitis (21.1%), urinary tract infection (11.9%), fatigue (11.5%), nausea (11.5%), back pain (11.1%), lymphopenia (10.4%), and upper respiratory tract infection (10.0%). Most cases of lymphopenia were mild or moderate, with severe lymphopenia occurring in one participant (0.4%).
Discussion
Our results offer valuable insights into the pleiotropic changes occurring in pwRMS receiving treatment with CladT. When combined with the quality-of-life assessments conducted in a similar demographic, this research enhances our understanding of the full potential of CladT in the management of MS. 22 Our analysis of CladT treatment in MAGNIFY-MS demonstrated improvements in clinical outcomes (ARR, NEDA-3, NEPAD), particularly for pwRMS who were naïve to previous treatment. It also demonstrated the changes in biomarkers collected in the CSF (OCT, OCBs, KFLC, IgG indices) and of neuroaxonal degeneration (NfL), as well as stability in OCT measures.
Cladribine is a small molecule (285.69 g/mol) able to penetrate the BBB and has been shown to achieve CSF concentrations of 25% of those in plasma of healthy individuals who received intravenous doses of 0.17–2.5 mg/m2/h. 23 These concentrations are likely to be higher in pwRMS due to compromised BBB integrity. 24 The importance of BBB penetration of CladT remains to be further elucidated; however, it is reasonable to expect that BBB access may enable meaningful clinical activity within the CNS. Here, we demonstrate for the first time maintenance of the structure and function of the optic nerve, KFLC Index, and IgG Index, following CladT administration. The RNFL and GCL/IPL are layers of the optic nerve, and their thickness can be measured by OCT as markers reflecting wider neuroaxonal loss throughout the CNS. 25 Thinning of the GCL occurs in healthy people over time but the rate is faster in people with MS and is associated with the development of new T1 Gd+ and T2 lesions. 26 Furthermore, RNFL and GCL/IPL thickness and macular volume are associated with cognitive performance in pwRMS.27,28 After 12 and 24 months of CladT treatment in MAGNIFY-MS, no thinning of the RNFL or GCL/IPL layers was observed. This observation, combined with the reduction in CSF NfL, may support the idea that cladribine has a protective effect on axons, although direct comparison with fluctuations in untreated patients would strengthen this conclusion. RNFL and GCL/IPL thinning are associated with worsening of low-contrast visual acuity and contrast sensitivity.7,29 The maintenance of RNFL and GCL/IPL thickness in MAGNIFY-MS was accompanied by improvements in low-contrast visual acuity. The preservation of the RNFL and GCL/IPL and improvements in visual scores may suggest a protective effect of CladT on the optic pathway, potentially mediated through effective control of the immune response that includes reduced dying back neuropathy, which has been hypothesized to occur not only peripherally, but also in the CNS. 30 Since these visual pathway biomarkers reflect the broader state of neurons in the CNS, 25 our results may suggest a role for CladT in helping to protect pwRMS against neuroaxonal damage through minimizing or indeed canceling new/ongoing lesion activity.
The presence of CSF OCBs reflects intrathecal immunoglobulin synthesis and secretion by B cells into the CSF. 24 Previous studies showed B cells to be the cell type most depleted by CladT. Memory B cells showed sustained depletion throughout the treatment and follow-up period; naïve and transitional B cells dropped at week 6 and recovered at week 14, while plasmablasts increased at week 3 and then declined during the second CladT course. 31 In MAGNIFY-MS, CladT reduced memory B cells by around 90% for at least 12 months, whilst short-lived and CD38+ plasma cells temporarily dropped by nearly 80% and recovered to about 50% of baseline at M12. Naïve and transitional B cells initially reduced by 90% and >60%, respectively, at M2, and recovered completely by M12. 32 OCBs were reduced or eliminated at least once at post-baseline visits (M12, M24) in 13 of 17 (76.5%) participants. They were reduced in the CSF of 38%–42% of participants after just 1 year of CladT treatment, with further reductions apparent at M24. The reduction and—in some cases—disappearance of OCBs with CladT in pwRMS in our prospective global clinical trial expands on data based on 29 pwRMS reported by Rejdak et al. 33 using subcutaneous cladribine. They demonstrated the disappearance of OCBs in 55% of their small cohort after 10 years, which was associated with lower disability. Similarly, a recent study showed CladT-induced OCB reduction in 4 of 10 pwRMS. 31 OCBs are used for MS diagnosis and prediction/monitoring of disease progression, and previous data suggest the association of OCBs at MS onset with greater physical disability and cognitive impairment after 10 years of follow-up. 34 Furthermore, pwRMS with no OCBs present in the CSF experience a smaller degree of white brain matter loss compared to pwRMS with bands present, 35 suggesting a link between OCBs and brain atrophy. In MAGNIFY-MS, most pwRMS were either stable or experienced cognitive improvement during the study. 36 Most of these participants continued into the MAGNIFY-MS Extension study, and we hope to report data showing OCB changes in Y3 and Y4 in the future.
In addition to OCBs, KFLC index has recently emerged as a useful diagnostic biomarker in MS.14,15,37–39 KFLC index has been included in the 2024 revision of McDonald criteria. The validity of the KFLC index at baseline as a marker predictive of worse prognosis has been highlighted by Rosenstein et al. 20 : KFLC index emerged as an independent risk factor for progression independent of relapse activity and evidence of disease activity, especially for pwRMS with KFLC value >100 at baseline.
In MAGNIFY-MS, we noted a decrease in the quantity of OCBs, as well as in the indices for IgG and KFLC. OCBs serve as a valuable metric for pwRMS who test negative for KFLC. Furthermore, applying a cutoff value of 6.1 for the KFLC index revealed sensitivity and specificity. 16
In our investigation, we noted a reduction in KFLC index (p < 0.1) among pwRMS with elevated KFLC index (≥6.1) at baseline. The most pronounced effect was observed in pwRMS who had a baseline KFLC value exceeding 100. Additionally, we recorded a decrease (p < 0.05) in the IgG index for pwRMS with a baseline IgG index >0.7. CladT reduction of intrathecal antibody production was recently demonstrated by decreased KFLC, OCB counts, and CSF IgG index in a small patient pool (n = 10). 31 Our results further support a diminished intrathecal synthesis of IgG in pwRMS treated with CladT, becoming apparent from M12 onward, upon completion of the full treatment dose.
However, there is evidence that CladT influences intrathecal antibody production based on a reduction in KFLC. 31 Therefore, any impact on CSF immunoglobulin by CladT may be due to depletion of antibody-secreting cell precursors in the periphery and CNS, rather than a major impact on plasmablasts and plasma cells that lose deoxycytidine kinase during differentiation. 40
While there is some correlation between OCBs and disability in MS, their specific role and target in MS pathogenesis remain uncertain. 24 Aside from immunoglobulins, B cells in the CNS release neurotoxic factors with detrimental effects on oligodendrocytes and demyelinated neurons and axons, largely in the context of new and expanding lesions. 41 Moreover, B cells mediate autoproliferation of pathogenic Th1 cells, 42 and they maintain microglia and astrocytes in an activated state, further contributing to inflammation, excitotoxicity, and neuronal damage. 24 Gray matter lesions often contain aggregates of B cells, which are associated with T cell and macrophage infiltration, driving demyelination and activation of microglia. 41 Immunoglobulin reduction may therefore reflect B cell depletion, which is associated with clinical benefit, as measured by NEDA and NEPAD, to pwRMS through multiple B cell-driven mechanisms.
Median CSF IgG levels remained stable over 24M in MAGNIFY-MS, while median CSF IgM levels showed a small decrease at M24 in all participants. These results reflect those seen in serum IgG/IgM. Although the levels of IgM were reduced during CladT treatment, both IgM and IgG remained consistently within the normal reference ranges throughout the study, 21 suggesting CladT would not be expected to have a detrimental impact on immune response to infection. Indeed, CladT has been shown to shift the immune system to a less pathogenic state. 43 This is consistent with the intact humoral responses to influenza and coronavirus disease 2019 seen in CladT-treated pwRMS.44,45
The levels of NfL in the CSF can be used as a biomarker of disease activity and response to treatment,6,46 and they have been associated with relapse risk in clinically isolated syndrome, suggestive of demyelination and relapsing MS. 47 Preliminary data using subcutaneous cladribine suggested a significant effect on CSF NfL levels in people with various forms of MS. 48 In MAGNIFY-MS, serum NfL levels in pwRMS were reduced by 25% at M12 and 23% at M24, compared with 50%–67% reductions in the CSF. The changes in NfL levels during treatment with CladT were comparable to those observed with ocrelizumab in pwRMS (−54.7% change in CSF NfL at M12 49 ).
Over the course of the 2-year study, we observed improvements in standard clinical measures of disease activity, such as ARR, NEDA-3, and NEPAD. Notably, Tx-naïve pwRMS exhibited better scores across all measures compared with Tx-experienced pwRMS; for example, 69.1% (95% CI, 58.6, 78.0) versus 60.2% (95% CI, 50.8, 68.9), respectively, for Y2 NEDA-3, and for NEPAD 67.8% (57.2, 76.8) versus 54.4% (45.3, 63.2). The estimated ARR of qualifying relapses was 0.09 (95% CI, 0.06, 0.12) from baseline to M24, which is in line with the ARR of 0.15 (0.12, 0.18) in CLARITY and 0.14 (0.10, 0.21) observed in CLARITY Extension. 50 These data are in accordance with real-world study cohorts and highlight the advantages of initiating treatment early.51–54 A notable decrease in inflammatory activity was observed, with around 90% of participants remaining free of lesions at the end of the 2-year parent study. 55 The results from MAGNIFY-MS presented here reveal that 93.1% of participants did not experience 6mCDP during Y2, as presented in Figure 1. Furthermore, during the same time frame, 95.4% and 99.0% of participants exhibited no 20% confirmed progression in the T25FW and the 9HPT, respectively, in Y2. In contrast, the FREEDOMS I study on fingolimod indicated approximately 88% absence of 6mCDP, while the OPERA I study reported 93.1% and 89.5% absence of confirmed disability progression at 24 weeks for ocrelizumab and interferon-β-1a, respectively.56,57
Importantly, this study allowed contextualization of the clinically important outcomes NEDA-3 and NEPAD with biomarker changes observed using CSF and OCT indices consistent with reduced CNS inflammation and neuroaxonal damage.
The CladT full treatment dose is completed after initiation of 2 yearly treatment courses, usually after M12. Therefore, we calculated NEDA-3 and NEPAD based on yearly intervals. In addition, NEDA-3 was re-baselined at 6 months in accordance with the MAGNIMS-CMSC-NAIMS consensus guidelines 18 and to adjust for any latency period of CladT. 5 As an IRT, CladT is anticipated to enhance NEDA-3 and NEPAD rates progressively, with the most significant impact becoming evident in Y2. 58 This pattern was observed in MAGNIFY-MS, with a higher estimated probability of achieving NEDA-3 and NEPAD in the second year of treatment compared with Y1. Participants naïve to treatment with DMTs had higher rates of NEDA-3 (69.1%) and NEPAD (67.8%) compared with those who were Tx-experienced (60.2% and 54.4%, respectively), aligning with findings from previous research.59,60 The Tx-experienced group had a longer average duration since MS onset than the Tx-naïve group; 116 versus 44 months, respectively. 61 Therefore, it is likely that the disease stage was more advanced and difficult to treat in this group.
No new safety signals were observed in the MAGNIFY-MS study, and the number and incidence of adverse events were broadly in line with what has been previously reported from clinical studies.51–53 Lymphopenia was experienced by 10.4% of participants, consistent with findings from the CLARIFY study (15.1%). 22 Some real-world studies observed higher rates of lymphopenia with cladribine treatment 3 ; this may be due to differences in inclusion criteria and monitoring practices for absolute lymphocyte counts. While continuous immunosuppressants are associated with an accumulating infection risk, IRTs such as CladT shift the immune system to a more homeostatic state, 43 and can limit the risk of latent infections. 62
The results from MAGNIFY-MS suggest a potential role for cladribine in interrupting the inflammation and neuroaxonal damage occurring in the pathogenesis of MS, which could be related to the stabilization of disease activity seen in the participants. While the clinical results from this analysis support the widely accepted understanding that CladT reduces relapses and MRI activity, particularly in those naïve to previous therapy, 54 the OCT findings combined with biomarkers of intrathecal inflammation and neuroaxonal damage provide new insights into the mechanistic effects of CladT underlying the clinical outcomes. Further investigation will provide additional insight into the pathways and mechanisms affected during CladT treatment. Investigations with direct comparisons to biomarker fluctuations and clinical changes in untreated pwRMS could help to further elucidate the potential connection between CNS and clinical effects of CladT highlighted here.
Our study had some limitations: As an open-label, single-arm study, there was no comparator or placebo arm, making conclusions susceptible to indication bias, and causation difficult to fully establish. Furthermore, the exploratory CSF and OCT sub-studies had a smaller number of participants, so these results should be interpreted with caution. We also noted some variation between the parent and sub-studies in baseline demographics: The CSF sub-study had a lower proportion of female participants, who were on average at a relatively early stage of their disease course. In the OCT sub-study, the population was older and further along in the disease course, with fewer participants who were Tx-naïve or had active T2 lesions (Table 1). Although all participants had highly active relapsing MS, the exclusion of patients previously exposed to second-line DMTs may have led to some underrepresentation of those at severe stages of the disease course. Longitudinal comparisons between pwRMS receiving CladT versus placebo would provide greater clarity of context, particularly for OCT measurements, as axonal retinal changes occur naturally in people with and without MS.
Conclusion
The current MAGNIFY-MS analyses offer valuable insights into the advantageous and pleiotropic effects of CladT for all pwRMS who participated in the study, regardless of prior treatment status. Both cohorts experienced improvements during treatment with CladT; however, Tx-naïve participants exhibited a lower ARR and better rates for NEDA-3 and NEPAD by the completion of the study, thus indicating a more pronounced effect on disability and disease progression metrics within this group. Beyond conventional clinical outcomes, changes in various biomarkers during treatment with CladT suggested reduced intrathecal inflammation and neuroaxonal damage, which could be related to the observed slowing of overall disability accumulation in pwRMS.
Supplemental Material
sj-docx-1-tan-10.1177_17562864251351760 – Supplemental material for Clinical and mechanistic effects of cladribine in relapsing multiple sclerosis: 2-year results from the MAGNIFY-MS Study
Supplemental material, sj-docx-1-tan-10.1177_17562864251351760 for Clinical and mechanistic effects of cladribine in relapsing multiple sclerosis: 2-year results from the MAGNIFY-MS Study by Klaus Schmierer, Heinz Wiendl, Frederik Barkhof, Xavier Montalban, Anat Achiron, Tobias Derfuss, Andrew Chan, Suzanne Hodgkinson, Alexandre Prat, Letizia Leocani, Finn Sellebjerg, Patrick Vermersch, Hulin Jin, Laura Sponton, Anita Chudecka, Lidia Gardner and Nicola De Stefano in Therapeutic Advances in Neurological Disorders
Footnotes
Acknowledgements
The authors would like to thank the study participants, family members, and staff from all sites that were involved in the study. Ruth Butler-Ryan of Springer Health+, Springer Healthcare Ltd., UK, provided medical writing support, which was funded and supported by Merck KGaA, Darmstadt, Germany, in accordance with the Good Publication Practice 2022 Guidelines.
Declarations
Supplemental material
Supplemental material for this article is available online.
References
Supplementary Material
Please find the following supplemental material available below.
For Open Access articles published under a Creative Commons License, all supplemental material carries the same license as the article it is associated with.
For non-Open Access articles published, all supplemental material carries a non-exclusive license, and permission requests for re-use of supplemental material or any part of supplemental material shall be sent directly to the copyright owner as specified in the copyright notice associated with the article.