
Abstract
Background:
Multiple sclerosis (MS) is a chronic immune-mediated disease of the central nervous system affecting approximately 2.8 million people worldwide. In addition to genetic and environmental factors, various lifestyle factors contribute to disease development and progression.
Objectives:
We performed a monocentric retrospective study and investigated the effect of lifestyle factors such as obesity, smoking, alcohol consumption, physical activity, and dietary habits on the degree of disability in a cohort of people with MS (pwMS) with an average onset of disease after the age of 55.
Design:
This late-onset MS (LOMS) study group (n = 47) was characterized by a mean age of 60.9 years and a mean duration of disease of 5.0 years. The LOMS study group was compared with two control groups. The study participants in the “old control group” (Cold) were on average as old and in the “young control group” (Cyoung) as long suffering from MS as the pwMS in the LOMS group.
Methods:
Data from medical documentation and a questionnaire were analyzed using descriptive frequency analyses and testing for correlation between different variables also by generalized estimating equations. The Expanded Disabilty Status Scale (EDSS) score and the progression index were used as a measure of disability.
Results:
We found a significant association between smoking history and the current EDSS score in the Cyoung group, but not in the two older study groups. For physical activity, there was a significant negative correlation with EDSS score in the study group and the Cold group, alcoholic beverage consumption correlated with decreased EDSS in the Cold group. The intake of meat negatively correlated with the progression index in the LOMS group.
Conclusion:
In summary, different life-style factors correlated with disability depending on patient age and disease duration. These life-style factors may be considered in the future counseling of pwMS at older ages.
Introduction
Multiple sclerosis (MS) is a chronic immune-mediated disease of the central nervous system characterized by inflammation and demyelination as well as axonal injury and associated reactive gliosis. Despite intense research, its pathogenesis has not yet been fully elucidated.1–3 In addition to predisposing genetic variations, numerous other risk factors such as environmental factors, and lifestyle habits may contribute to disease development and activity. 4 The typical age of disease manifestation lies between 20 and 40 years of age.5,6 In only 6% of people with MS (pwMS) the disease manifests after the age of 50, which is referred to as late-onset MS (LOMS). 7 Due to the small number of late-onset pwMS, there are few data available on this patient group so far.
Various studies have already shown that there is a different gender ratio in LOMS. While the German MS registry currently reports the proportion of female pwMS to be 71.0%, this proportion in LOMS only lies between 63.1% and 66.6%.6,8,9 Furthermore, LOMS is characterized by a higher proportion of primary progressive MS (PPMS) as well as a faster transition to secondary progressive MS (SPMS).9,10 In addition to a later diagnosis and the use of fewer (highly effective) treatment options, LOMS patients display a faster disability progression. Nutritional and lifestyle factors such as smoking,11–13 saturated, long chain fatty acids, 14 and a sugar-rich diet 15 may increase the risk of MS or MS severity, while physical activity,16,17 low carbohydrate, and “Mediterranean” diets,15,18 as well as the intake of short chain fatty acids 19 are considered as protective. Detrimental effects of high salt intake,20,21 or the protective effects of alcohol consumption22,23 are in part critically discussed. However, the potential effects of these lifestyle factors in relation to age or disease duration have not been fully addressed in previous research. Data studying the effects of variables such as body weight, smoking, consumption of alcohol, or physical activity on the course of MS in LOMS would be highly desirable to provide optimal individual counseling and care for the heterogeneous group of pwMS at older ages.
Materials and methods
Patient cohort
The participants in this retrospective observational study were recruited from a total collective of 611 pwMS, who were treated as outpatients at the MS Clinics, Department of Neurology of the University Hospital Regensburg, from 2019 until May 2022. First, all pwMS were selected and combined as the LOMS study group for which a neurologic episode after the age of 50 was documented, which were indicative for the later diagnosis of MS. In this group, a total of 47 pwMS were identified (i.e. 7.6% of the total cohort). In addition to this study group, we generated two gender-matched control groups, each encompassing another 50 pwMS. In the old control group (Cold) group, patients experienced the onset of the disease before the age of 50, but they were on average as old as the pwMS in the LOMS study group. Patients in the young control group (Cyoung) group displayed the same duration of disease as pwMS in the LOMS group, but had a typical age (on average 25.5 years) at onset of the disease.
Data collection
For data collection, discharge letters, findings from outpatient or inpatient stays, and a questionnaire completed by telephone interview were evaluated. All interviews were conducted in June 2023. Thus, the duration of the disease varied among participants at the time of the questionnaire. Age, sex, Expanded Disabilty Status Scale (EDSS), alcohol consumption per week, nutrition, smoking in pack years, physical activity, and progression index defined as EDSS change per year were collected. In the interview, patients were asked to answer questions regarding their lifestyle factors during the last 4 weeks prior to taking the questionnaire.
The standardized questionnaire was based on the “Nutrition Questionnaire of the Study of Adult Health in Germany” of the Robert Koch Institute24,25 and the “Physical Activity Questionnaire” of the Universities of Freiburg and Basel.26,27 The questions were modified according to a telephone survey. The data of 40 patients of the study group, 40 pwMS of the Cold group, and 36 pwMS of the Cyoung group were available from the questionnaire survey.
The assessed lifestyle factors include obesity which was quantified by body mass index (BMI). Furthermore, pwMS were asked about their smoking habits and were divided into the two groups “never smoked” and “smoker/ex-smoker” for the statistical analyses. In the “smoker/ex-smoker” group, the amount of nicotine consumption was also recorded using pack years as correlate. Furthermore, the consumption of alcohol was divided into the groups “low or no consumption” (i.e. at most once a week) versus “moderate to high consumption” (more than once a week). As a further parameter influencing lifestyle, the frequency of physical activity of the pwMS was also recorded. The data refer to the amount of physical activity per week, which was performed on average in the last 4 weeks. The term “physical activity” includes activities such as walking, cycling, or swimming. Based on the frequencies given, two categories were formed. The category “low to no activity” includes frequencies of 1×/week and less. All activity data that include frequencies of 2×/week or more are included in the “moderate to high activity” category. For the assessment of dietary factors, patient groups were also dichotomized. In the “low or no consumption” group, patients consumed stated nutriments up to once a week, whereas in the “moderate to high consumption” group, patients consumed the nutriments twice per week or more often.
Statistics
Descriptive statistical analysis of the relevant variables was performed using IBM SPSS-Statistics statistical software version 28.0.1.1 (Armonk, NY, USA). Statistical testing for significance was done by employing a t test or Chi-square test, where appropriate. Analysis of potential correlations between two variables was performed using Kendall–Tau correlation coefficients. *p < 0.05 was considered significant and **p < 0.01 as highly significant. We fitted generalized estimating equation (GEE) models to examine the relationship between EDSS and nutritional and lifestyle factors over time. For each patient, we used all available EDSS measurements and the lifestyle variables collected via the questionnaires. Since we were interested whether the effect of nutritional factors was heterogeneous across patient groups, we included an interaction term of the nutritional factor and the patient group in our models and reported the findings separately by patient group. To avoid overfitting, we did not include any additional interactions. EDSS was treated as a continuous outcome, and nutritional factors were categorized into “low or no consumption” (i.e. at most once a week) versus “moderate to high consumption” (more than once a week). In the models, we controlled for sex, time since initial diagnosis, BMI, alcohol consumption, smoking, and physical activity. However, we did not include age in the models due to the absence of overlapping age ranges within the study groups. This exclusion was necessary to avoid violating the positivity assumption, which would risk introducing bias. 28 GEE analyses were performed in the R software, version 4.2.3 29 using the geepack package, version 1.3.9. 30
Results
Baseline data
The patient population of the study comprised a total of 147 pwMS, who were assigned to one of the 3 study groups, that is the LOMS study group, the Cold, or the Cyoung group. In addition to the LOMS study group, both the Cold and the Cyoung control groups were matched for gender. pwMS in the control groups were each diagnosed before the age of 50. In the Cold group, they were on average as old and in the Cyoung group on average as long suffering from MS as the LOMS study group. When comparing the disease-specific characteristics, the LOMS group was significantly older than the Cyoung group and contained significantly less SPMS cases than the Cold group, but significantly more SPMS and PPMS cases than the Cyoung group. The LOMS group was significantly older at the first manifestation as well as the time of MS diagnosis than both control groups. Follow-up was significantly longer in the Cold group than in the LOMS and Cyoung groups. The EDSS at the time point of diagnosis was significantly lower in the Cyoung group than in the LOMS group. The current EDSS in the LOMS group was significantly higher than in the Cyoung group, but significantly lower than in the Cold group. Table 1 summarizes the baseline data for all three groups. The group-specific changes in the EDSS over the course of disease are illustrated in Figure 1 and show a rapid shift to higher EDSS ranges in pwMS at older ages and particularly the LOMS group as compared to the Cyoung group.
Baseline data of the LOMS and the control groups.
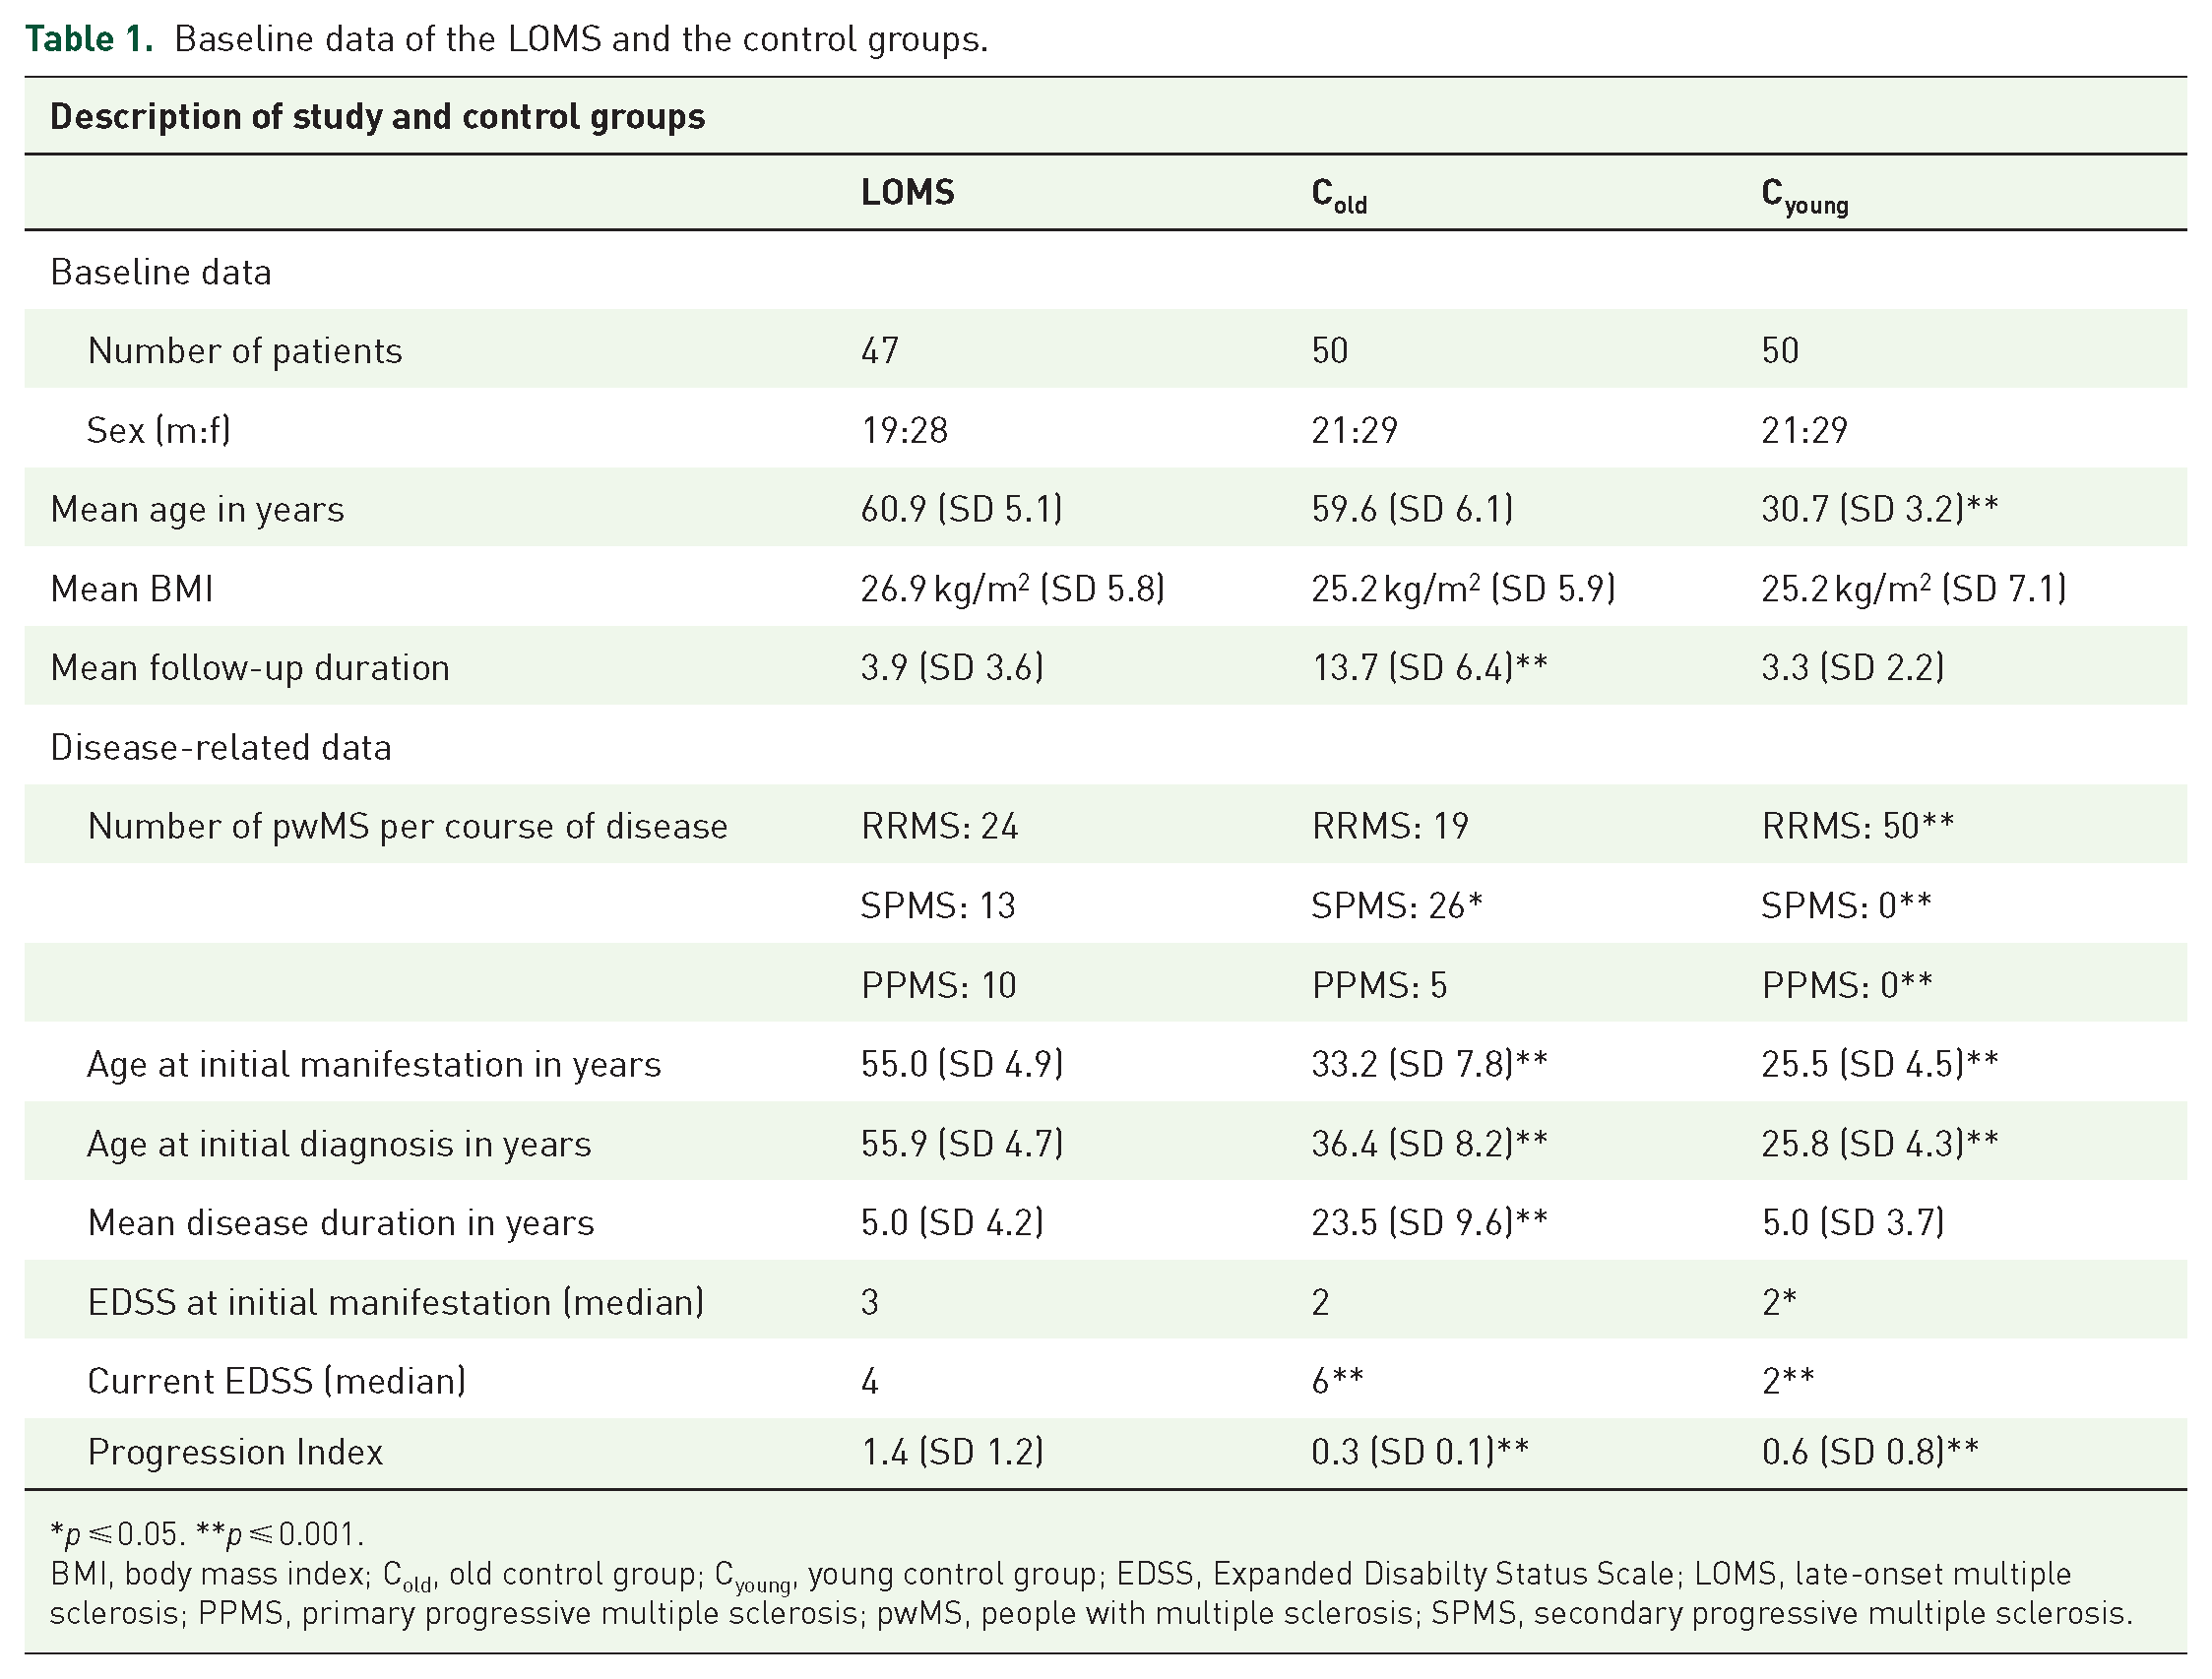
p ⩽ 0.05. **p ⩽ 0.001.
BMI, body mass index; Cold, old control group; Cyoung, young control group; EDSS, Expanded Disabilty Status Scale; LOMS, late-onset multiple sclerosis; PPMS, primary progressive multiple sclerosis; pwMS, people with multiple sclerosis; SPMS, secondary progressive multiple sclerosis.

Density plot of disease progression displaying group-specific EDSS changes over the course of disease. Note the more rapid shift to higher EDSS ranges in pwMS at older ages as compared to the Cyoung group. The bar plots below each panel represent the count of patients with available data for each follow-up year, which was used to generate the density curves.
Body weight
The first step was to investigate the influence of body weight on disease severity using the BMI. The mean BMI in the study group was 26.9 kg/m2, with a clear clustering of the categories not only “normal weight” (16 pwMS) but also “overweight/obese” (24 pwMS). In contrast, BMI was lower in the Cold group, averaging 25.2 kg/m2. The categories “normal weight” and “overweight” were most frequently represented with 19 and 15 pwMS, respectively. Similar to the Cold group, a BMI of 25.2 kg/m2 was found in the Cyoung group, with 20 pwMS having a BMI in the “normal weight” category. The second most common category was “overweight” with 9 pwMS. However, statistical analyses neither showed a significant correlation between BMI and the current EDSS nor the progression index in any of the groups (Tables 2 and 3).
Correlation between lifestyle factors and the EDSS at the LOMS and the control groups.

p ⩽ 0.05. **p ⩽ 0.001.
BMI, body mass index; Cold, old control group; Cyoung, young control group; EDSS, Expanded Disability Status Scale; LOMS, late-onset multiple sclerosis.
Correlation between lifestyle factors and the progression index at the LOMS and the control groups.
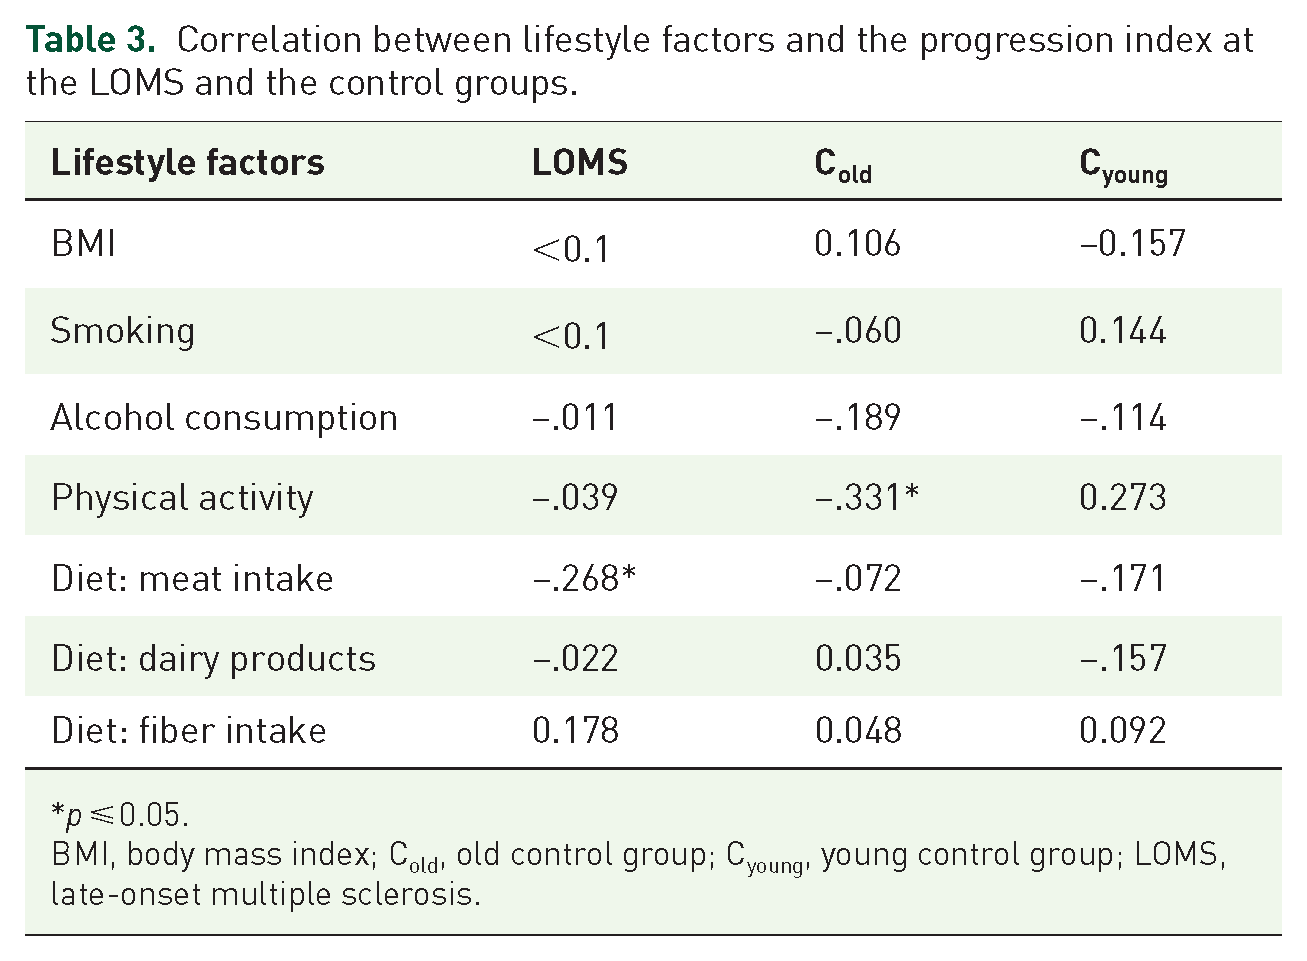
p ⩽ 0.05.
BMI, body mass index; Cold, old control group; Cyoung, young control group; LOMS, late-onset multiple sclerosis.
Smoking
The second step was to investigate the influence of nicotine consumption on MS disease severity as measured by EDSS. The majority of pwMS in LOMS (25 pwMS) stated that they currently smoked or had smoked in the past. The remaining pwMS had a negative smoking history. In the Cold group, 19 pwMS stated that they had never smoked. In contrast, 21 pwMS are still smoking or had smoked in the past. In these two groups, there was no significant correlation between smoking history and the current EDSS or the progression index (Tables 2 and 3). In the Cyoung group, a total of 19 pwMS had a positive smoking history. Testing for correlation between the two variables smoking history and current EDSS score revealed a significant positive correlation in the Cyoung group (Table 2).
Alcohol consumption
In the next step, we analyzed the influence of alcohol consumption on disease severity as measured by the EDSS. More than half of the pwMS in the study group (26 pwMS) reported drinking little or no alcohol. In the Cold group, three-quarters of pwMS reported consuming alcoholic beverages infrequently or not at all. In the Cyoung group, a total of 30 pwMS reported little or no consumption of alcoholic beverages. The analysis showed a statistically significant inverse correlation between the current EDSS score and the frequency of alcoholic beverage consumption for Cold (Table 2), which was not seen for the progression index (Table 3).
Physical activity
In another approach, we investigated the frequency of physical activity in relation to disability. The vast majority of pwMS in the LOMS study group (29 pwMS) reported being physically active more than once a week. In the Cold group, 21 pwMS reported being physically active more often than once per week. Statistical analysis showed a significant inverse correlation between physical activity and the current EDSS score for both groups. A significant correlation with the progression index was only shown for Cold. In the Cyoung group, the majority of individuals (28 pwMS) were physically active several times per week. However, in the statistical analysis, we neither found a correlation of physical activity with the current EDSS nor with the progression index (Tables 2 and 3).
Diet
Finally, we studied the relation of dietary habits like meat intake, the consumption of dairy products, or the amount of fiber intake via questionnaires. None of these dietary habits showed a significant correlation with the EDSS in any of the groups LOMS, Cold or Cyoung (Table 2). Interestingly, however, meat consumption significantly correlated inversely with the progression index in the LOMS, but not in the control groups. Such a correlation was neither seen for dairy products nor for fiber intake (Table 3).
Modeling the interaction between different risk factors
In the GEEs, we further explored these associations between EDSS and nutritional factors, while accounting for other lifestyle factors. Our analyses showed that the nutritional factors did not significantly influence disease progression, irrespective of study group. However, we found that alcohol consumption and physical activity significantly correlated with lower EDSS values when adjusting for all other factors (Tables 4–6).
Association between meat consumption and EDSS.

The model was adjusted for sex, disease duration, BMI, smoking, alcohol consumption, and physical activity. Results from the GEE model are shown separately by patient group. Regression estimates are provided for each patient group, along with their corresponding 95% CIs. Two types of p-values are reported: First, the p-value testing the null hypothesis of the estimate being equal to 0, and second, for the two control groups, a p-value testing the null hypothesis of the estimate being equal to the estimate of the LOMS group. Since the model contained only an interaction of the group effect on the meat consumption parameter, the remaining parameters are constant across all patient groups.
BMI, body mass index; CI, confidence interval; Cold, old control group; Cyoung, young control group; EDSS, Expanded Disabilty Status Scale; GEE, generalized estimating equations; H0, null hypothesis; LOMS, late-onset multiple sclerosis.
Association of dairy consumption with EDSS.
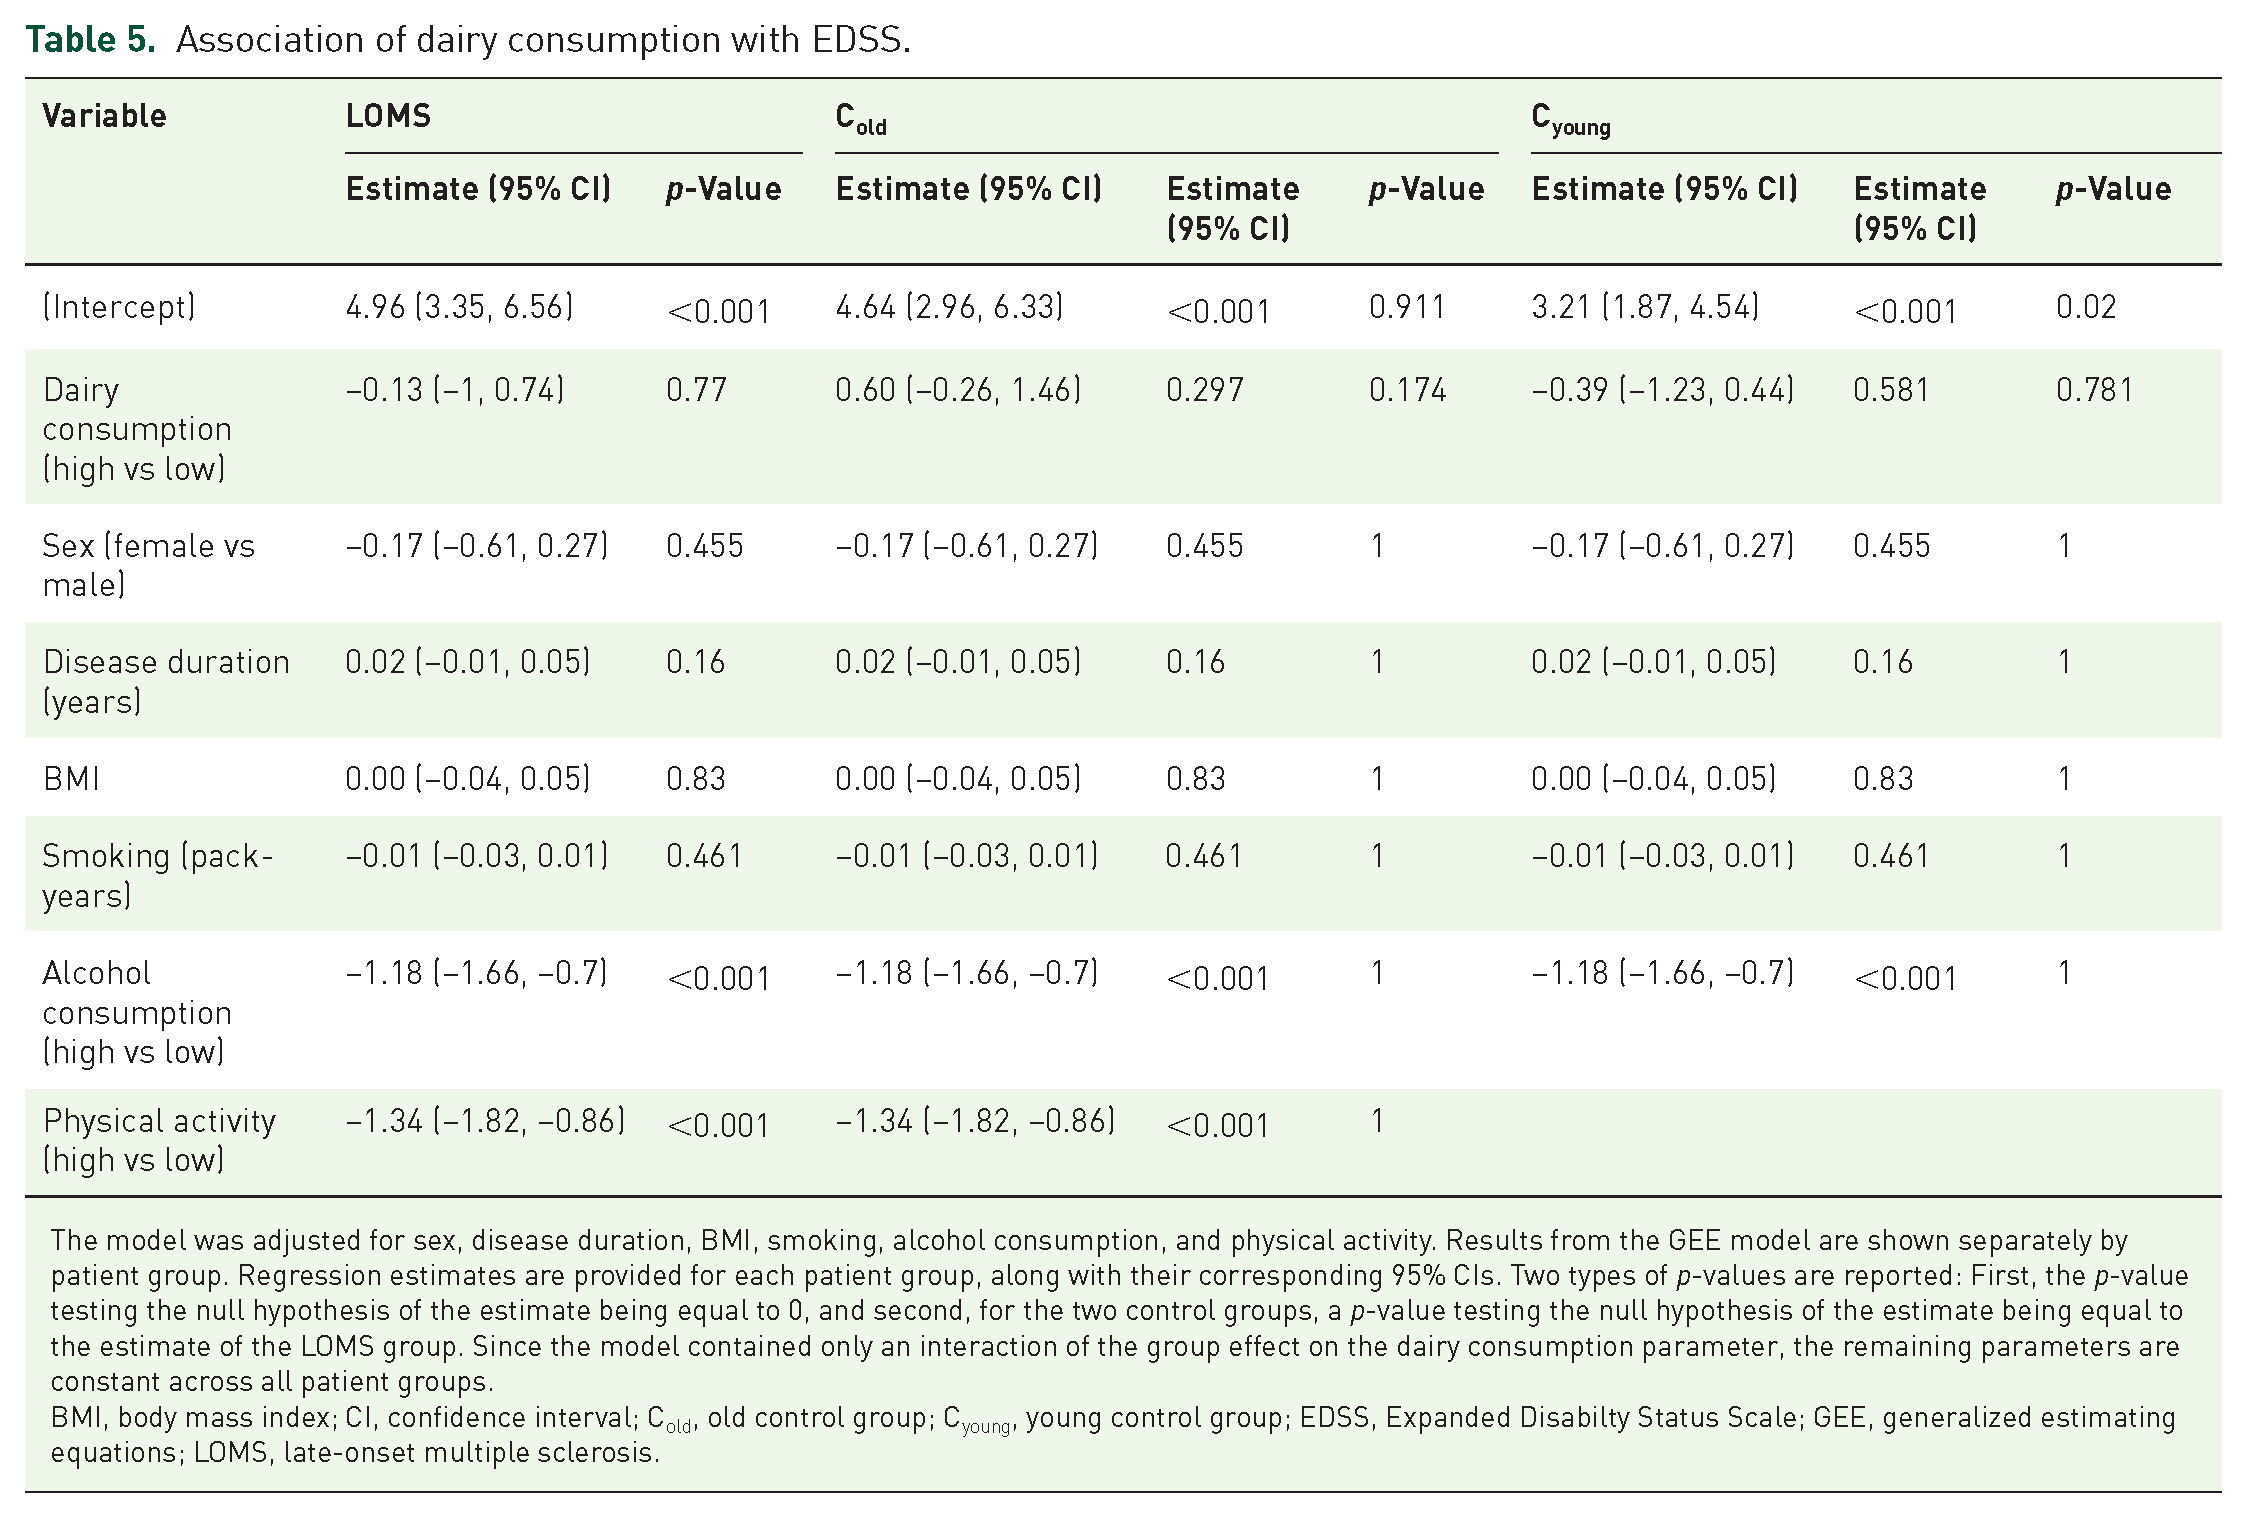
The model was adjusted for sex, disease duration, BMI, smoking, alcohol consumption, and physical activity. Results from the GEE model are shown separately by patient group. Regression estimates are provided for each patient group, along with their corresponding 95% CIs. Two types of p-values are reported: First, the p-value testing the null hypothesis of the estimate being equal to 0, and second, for the two control groups, a p-value testing the null hypothesis of the estimate being equal to the estimate of the LOMS group. Since the model contained only an interaction of the group effect on the dairy consumption parameter, the remaining parameters are constant across all patient groups.
BMI, body mass index; CI, confidence interval; Cold, old control group; Cyoung, young control group; EDSS, Expanded Disabilty Status Scale; GEE, generalized estimating equations; LOMS, late-onset multiple sclerosis.
Association of fiber intake with EDSS.

The model was adjusted for sex, disease duration, BMI, smoking, alcohol consumption, and physical activity. Results from the GEE model are shown separately by patient group. Regression estimates are provided for each patient group, along with their corresponding 95% CIs. Two types of p-values are reported: First, the p-value testing the null hypothesis of the estimate being equal to 0, and second, for the two control groups, a p-value testing the null hypothesis of the estimate being equal to the estimate of the LOMS group. Since the model contained only an interaction of the group effect on the fiber intake parameter, the remaining parameters are constant across all patient groups.
BMI, body mass index CI, confidence interval; Cold, old control group; Cyoung, young control group; EDSS, Expanded Disabilty Status Scale; GEE, generalized estimating equations; LOMS, late-onset multiple sclerosis.
Discussion
To date, there is only limited data on the influence of nutritional and lifestyle factors on the course of MS in the group of pwMS with late disease onset. Our data show an increased BMI, and inverse correlations of disability (as measured by EDSS) with physical activity, as well as a negative correlation of meat intake with the progression index. Several studies have already examined how various lifestyle factors affect disease risk as well as disability progression in MS.15,18,31–40 While the data obtained to date on the effects of alcohol consumption are still inconclusive, other variables such as smoking, BMI, physical activity, and diet clearly correlate with both disease risk and progression.11–13,15–18,22,23,31,41–44
In our study, all three pwMS groups display BMI values that exceed the limit range for the normal weight category. Comparison with data from the general population shows no significant differences in the distribution of BMI values. 45 Therefore, the hypothesis of increased prevalence of obesity among pwMS, which is strongly discussed in the current research literature, 41 cannot be supported by the results of this work. While some authors reported an association of BMI and disability in pwMS, 46 others emphasized the role of central obesity as indicated by waist circumference and its association with EDSS.42,47 However, with our data we cannot show a significant correlation between BMI and the current EDSS score or the progression index in any of the three pwMS groups. Although BMI scores are unlikely to predict future disability progression, the prevalence of overweight and obesity in our pwMS is substantial. Given the paramount influence of overweight and obesity on the quality of life,48–50 this finding should receive significantly more attention in the future counseling of pwMS.
Our data clearly demonstrate a correlation between smoking and the current EDSS for the Cyoung group, which is line with previous data.11,13,43 Yet, there was no significant correlation between smoking history and the progression index in any group. Although the demonstration of a correlation does not allow definite conclusions on causality, it is tempting to speculate that these findings may indicate a pathogenetically relevant role of the lung for priming of encephalitogenic T cells only during a definite vulnerable phase at younger age, as discussed in animal models. 51
The evaluation regarding a correlation between the frequency of alcohol consumption and the current EDSS score showed a significant negative correlation in the Cold group, while for the LOMS group the negative correlation was marginally nonsignificant (p = 0.064). Moreover, in the Cyoung group, there was a nonsignificant negative correlation of EDSS with alcohol consumption. While numerous studies have already addressed the effect of alcohol consumption on disease risk,37,38 the impact of alcohol on MS progression has much less been the subject of research so far. While some studies concluded that moderate alcohol consumption is associated with lower disease activity and severity,22,52 others showed a significantly lower risk for disease progression in abstinent patients compared with current users. 23 Yet, the general health risks of alcohol consumption should not be ignored.
In the adjusted GEEs, we mainly reproduced the findings of the correlation analyses: We found a significant negative association between EDSS and alcohol consumption, as well as EDSS and physical activity. Moreover, the analyses showed that none of the nutritional variables had a significant influence on disease progression. In the statistical analysis, a significant correlation between the current EDSS score and physical activity was demonstrated in both the LOMS and the Cold group. In contrast, there was no correlation between the current EDSS score and physical activity in the Cyoung group. A significant correlation with the progression index was only found in the Cold group. Studies examining the effects of physical activity in pwMS demonstrated a correlation with reduced disability progression in the course of the disease for both premorbid physical activity and physical activity in preexisting disease.16,17,44
While the study results for the LOMS and Cold groups are in line with the current scientific consensus, the findings in the Cyoung group, in which we neither found a correlation between physical activity and the severity of disability nor with the progression of the disease, are in contrast to the current standard of knowledge. However, it must be mentioned that all previous studies only analyzed one patient cohort and no differentiation of pwMS was made with regard to parameters such as age or duration of illness. Thus, our data suggest that physical activity has a beneficial effect on the disease severity as assessed by EDSS, especially in older pwMS, regardless of the duration of the disease. In pwMS with advanced age, there is a cumulative effect of physical limitations developing over the course of the disease and an age-related decline in physical performance. Targeted physical activity might therefore present a potential way of counteracting physiological deconditioning and slowing disability progression. However, since no causality statements can be made by testing for correlation, the concept that pwMS with a higher EDSS are less physically active than pwMS with lower disease-related disability also seems plausible. In other studies, the causal relation of physical activity leading to decreased MS severity is in part critically discussed. 53
Finally, it should be mentioned that this study has several limitations. Since this is a cross-sectional study, disease-specific data collected retrospectively cannot be verified. In addition, some data are missing for a few pwMS because they were not noted in the patient files or the pwMS did not take part in the survey. Due to the extended duration of disease follow-up and the use of a questionnaire at a single time point, the correlations and models evaluating the relationships between EDSS over time and lifestyle variables have limited evidential value. Furthermore, the self-reported data are particularly susceptible to recall bias and can lead to measurement error, especially with the nutritional variables. Since this measurement error is likely to be non-differential across pwMS groups and disease severity, the estimates from GEEs could be biased toward the null.
In summary, there are relevant differences in the impact of different lifestyle factors depending on the duration of the disease, age at first diagnosis, and current patient age. Even if no causal statements can be made on the basis of the present correlations, these results nevertheless stress the importance of future research in LOMS in order to gain a better understanding of the individual course of the disease and thus to enable optimal treatment and advice for pwMS at older ages.
Conclusion
Future studies may consider the heterogeneous clientele of pwMS at different ages in a more differentiated way. The following potential consequences for lifestyle counseling of pwMS may result from the findings of this study:
- Recommendation of smoking cessation primarily in younger pwMS.
- Recommendation of regular physical activity mainly for older pwMS
- No confirmed recommendation for alcohol abstinence in any MS cohort.