
Abstract
Magnetic resonance imaging (MRI) of the brain and spinal cord plays a crucial role in the diagnosis and monitoring of multiple sclerosis (MS). There is conclusive evidence that brain and spinal cord MRI findings in early disease stages also provide relevant insight into individual prognosis. This includes prediction of disease activity and disease progression, the accumulation of long-term disability and the conversion to secondary progressive MS. The extent to which these MRI findings should influence treatment decisions remains a subject of ongoing discussion. The aim of this review is to present and discuss the current knowledge and scientific evidence regarding the utility of MRI at early MS disease stages for prognostic classification of individual patients. In addition, we discuss the current evidence regarding the use of MRI in order to predict treatment response. Finally, we propose a potential approach as to how MRI data may be categorized and integrated into early clinical decision making.
Plain language summary
MS is a chronic autoimmune disease of the brain and spinal cord that causes physical and cognitive disability. Initially, most people with MS (pwMS) experience attacks of new symptoms and periods of partial recovery; this is called relapsing-remitting MS (RRMS). RRMS transitions to secondary progressive MS (SPMS), where there is a gradual worsening of disability. MS medications dampen parts of the immune system. They reduce the risk of relapses and delay transition to SPMS if started early. Once a person has SPMS, treatment can slow but not stop further deterioration. MS medications vary in their effects on the immune system, level of efficacy, and treatment risks. The course of MS is highly individual. When starting therapy, it can therefore be difficult to decide whether a drug with lower or higher efficacy is required. Some of the acute and chronic inflammatory changes in MS are shown as focal lesions (‘spots’) on MRI of the brain and spinal cord. They are very useful for diagnosing MS and determining disease activity. Even if there are no relapses, new lesions indicate that a MS medication is not fully effective. In addition, MRI provides a snapshot of tissue damage that has accumulated up to the examination. At the time of diagnosis, MRI reflects the natural history of MS in the individual, even before the first attack, and contains prognostic information. We review studies that investigate an association between certain MRI findings obtained early after the initial attack and the later course of MS. We propose that these metrics can be applied to a concept of grading and staging of MS as well as estimating functional reserve. We review thresholds that identify pwMS at risk of disability progression and transition to SPMS, who should be recommended highly effective therapy first line. Leveraging the prognostic capabilities of MRI may support initial treatment decisions.
Introduction
Multiple sclerosis (MS) is the most frequent chronic inflammatory demyelinating disease of the central nervous systems in young adults and can lead to long-term disability. 1 In addition to the clinical presentation and liquid biomarkers, magnetic resonance imaging (MRI) of the brain and spinal cord plays an important role in evaluating MS patients. This includes the establishment of an early and accurate diagnosis according to the 2017 revisions of the McDonald criteria as well as monitoring of treatment effectiveness and safety.2–4 Expert panel guidelines such as the MAGNIMS-CMSC-NAIMS recommendations clearly established the role of MRI for these purposes and stressed the importance of standardized image acquisition as well as the role of gadolinium use.5–9 In addition to diagnostic and treatment monitoring purposes, there is conclusive evidence that brain and spinal cord imaging findings contain important information regarding the prognosis of individual patients, including disease progression and the prediction of treatment response.10,11 It has been demonstrated that certain imaging findings in the brain and spinal cord obtained early in the course of the disease, particularly after the first clinical demyelinating attack, provide important prognostic information regarding the conversion to clinically definite MS (CDMS), long-term disability, disease progression, disability progression and the conversion from relapsing-remitting MS (RRMS) to secondary progressive MS (SPMS).10,12 This suggests that imaging findings may be of important clinical relevance in terms of treatment decision making at the time of diagnosis. However, whether and to what extent MRI findings during the first clinical presentation might aid in terms of treatment choice in clinical practice is still under debate.
The aim of this review is to present and discuss the current knowledge and scientific evidence regarding the role of MRI during the early stages of MS for prognostic classification of patients, its potential in predicting treatment response and its application in initial treatment decisions.
Current concept of MS pathology and MRI correlates
One of the main histopathological hallmarks of MS is focal inflammatory demyelination. Characterized by perivenular inflammation, it leads to the characteristic perivascular distribution of MS lesions in the periventricular and deep white matter. Blood-brain barrier disruption is evident by contrast enhancement on MRI. 13 In addition to white matter involvement, MS is characterized by leucocortical inflammatory demyelination. MRI correlates include juxtacortical and various types of cortical grey matter lesions.14,15 Another clinically relevant feature of MS with strong impact on disease course and disability progression is focal inflammatory demyelination in the spinal cord. This is frequently already present at early disease stages and accelerates over time, particularly in later progressive disease stages.16,17 (Sub)acute focal inflammatory demyelinating lesions may show signs of partial or complete tissue repair, such as remyelination, during the first 6 months.13,18,19 New or enlarging T2 lesions and contrast-enhancing lesions, which indicate ongoing focal inflammation, are the most relevant MRI marker of disease activity. These are central to treatment monitoring in clinical practice, particularly during non-progressive MS stages. 8
Certain MS lesions demonstrate a slow expansion that may be visible on sequential MRI studies. Histopathologically, slowly expanding lesions (SEL) are characterized by the combination of a fully demyelinated, inactive centre without any signs of remyelination or prominent inflammation, and an active border including iron-laden phagocytes. On MRI, some of these T2-hyperintense lesions show a low signal intensity rim on susceptibility-based imaging, and are thus called paramagnetic rim lesions (PRL); these show an association with chronic T1-hypointense lesions (‘black holes’).20,21 Also called ‘smouldering lesions’, SEL are clinically associated with progressive MS disease stages and course as well as with disability progression. 22
Another presentation of chronic inflammation in MS is characterized by clusters of B- and T-cells in the leptomeninges, which are frequently associated with demyelination of the adjacent subpial cortical grey matter. 23 It has been suggested that focal leptomeningeal inflammation corresponds to small hyperintense areas on late contrast-enhanced 3D fluid-attenuated inversion recovery (FLAIR) images. 24 Whether the accumulation of leptomeningeal immune cells directly causes cortical demyelination remains unclear. In other diseases, leptomeningeal inflammation is not typically associated with cortical demyelination. 25 A number of studies have reported an association of leptomeningeal contrast enhancement (LMCE) with focal atrophy of the adjacent cortex, but not focal demyelination,26–28 suggesting a link to diffuse rather than focal neuroinflammation. Interestingly, LMCE also correlates with focal demyelinating lesions in the thalamus and hippocampus28,29 as well as cortical and total grey matter volume (GMV).30,31 Areas of LMCE usually remain stable during follow-up, and the in vivo response to disease-modifying treatment (DMT) remains unclear. 24 Resolution of LCME has been reported in two patients treated with high-dose corticosteroids 32 and in 9 out of 20 patients treated with anti-CD20 therapies. 33 In a rat model of proteolipid protein-induced experimental autoimmune encephalitis, treatment with evobrutinib, an inhibitor of Bruton’s tyrosine kinase (BTK), promoted the resolution of focal meningeal inflammation on serial MRI. 34
Apart from focal inflammation, MS, in particular in progressive stages, is also characterized by diffuse inflammation that can appear on conventional MRI as areas of slightly increased T2-hyperintensity.35–37 Various quantitative MRI methods to detect diffuse neuroinflammation have been described. On positron emission tomography, several radioligands binding to the 18-kDa translocator protein and 11C-acetate label activated microglia and astrocytes, respectively.38,39 Besides detecting diffuse neuroinflammation, these ligands may also bind in a focal pattern, associated both with the acute formation and chronic activity of lesions. 39
In addition to neuroinflammation, MS is also a neurodegenerative disease. Signs of axonal damage are present already in the early stages, and pronounced axonal loss occurs as the disease progresses. Associated focal and global atrophy of white and grey matter structures in the brain and spinal cord are established outcome measures of neurodegeneration in clinical trials. Various DMTs can slow down grey and white matter atrophy. For the routine clinical assessment of individual disease progression, imaging of neurodegeneration and atrophy is however not recommended at this time.8,40
Prognostic value of MRI from the historical perspective
The first evidence suggesting the prognostic value of MRI measures was derived in patients presenting with a first clinical demyelinating event [later described as a clinically isolated syndrome (CIS)]. A four-parameter dichotomized MRI model including the number of lesions (using a cutoff of nine lesions), contrast enhancement and localization of lesions (juxtacortical, periventricular, infratentorial) showed a predictive value regarding the conversion to CDMS (Figure 1). 41 These so-called Barkhof criteria were later validated in a second cohort, providing a sensitivity of 73%, a specificity of 73%, an accuracy of 73%, a positive predictive value of 55% and a negative predictive value of 85%. 42 Further prediction models using a combination of these MRI criteria, cerebrospinal fluid analyses and neurophysiological findings were developed and validated.43,44 Barkhof MRI criteria – modified by including spinal cord lesions – were later incorporated into the 2001 and 2005 revised McDonald criteria for the demonstration of dissemination in space.45,46 These criteria were further simplified and continued to be included in the subsequent revisions of the McDonald criteria.2,47 In addition, the Barkhof criteria, were incorporated into the Okuda criteria and more recent diagnostic criteria for patients with radiologically isolated syndromes (RIS).48,49 The modifications of the McDonald criteria in 2001, 2005, 2010 and 2017, including adjustments to MRI and cerebrospinal fluid criteria, have progressively increased the sensitivity of diagnosing MS at the first clinical event. As a result, nearly 70% of patients experiencing their first clinical event now receive a diagnosis of MS. 50 Instead of a detailed discussion of the evolving definitions of CIS, we refer to patients with a first demyelinating attack, and interpret the risk of conversion to CDMS as risk of relapse.

MRI images of the brain (a–e) and spinal cord (e, f) obtained in MS patients presenting with the first clinical event demonstrate MRI features that provide prognostic information regarding the clinical outcome. (a) Axial FLAIR image showing a high T2 lesion load in the periventricular, deep and juxtacortical white matter; (b) axial contrast-enhanced T1-weighted image showing two contrast-enhancing lesions in the deep white matter of the left hemisphere; (c) axial contrast-enhanced T1-weighted image showing several T1-hypointense lesions (‘black holes’); (d) axial DIR image showing several leucocortical lesions; (e) axial DIR image showing multiple infratentorial lesions including a brain stem lesion; (f, g) sagittal STIR and contrast-enhanced T1-weighted image showing asymptomatic lesions in the cervical spinal cord.
Prognostic value of brain and spinal cord MRI at disease onset
Diagnostic work-up at the time of the first clinical event suggestive of MS should include a contrast-enhanced MRI of the brain and spinal cord. 8 In the following paragraphs and in Table 1, we describe and discuss various MRI measures at disease onset and/or in early RRMS that contain relevant prognostic information regarding further inflammatory disease activity, disability progression and the conversion to SPMS (Figure 1). These outcomes are better predicted by MRI findings than by clinical findings in early MS.51–53
Stratification of risk level for MRI predictors and associated outcomes.

EDSS, Expanded Disability Status Scale; MRI, magnetic resonance imaging; MSFC, Multiple Sclerosis Functional Composite; MSSS, Multiple Sclerosis Severity Scale; PASAT, Paced Auditory Serial Addition Test; SDMT, Symbol Digit Modalities Test; SPMS, secondary progressive multiple sclerosis.
T2-hyperintense white matter lesions
After the first clinical event, the presence and number of T2 white matter lesion (WML) has consistently been identified as the strongest independent predictor of further relapses.52,53–56,83,84 Even a single T2 WML confers a substantial risk of a second attack.52,85,86 This risk is highest in patients with numerous lesions, for example, ⩾10 or more.56,57 Risk, and time to relapse are modified by lesion topology in the brain71,87–90 and presence of infratentorial or spinal cord lesions.65–67,71
While the extent or development of T2 lesions are not closely associated with present clinical findings, 91 the number and volume of T2 WML are moderate predictors of disability as measured by the Expanded Disability Status Scale (EDSS) after 5, 10, 14 or 20 years as well as the time to reach disability milestones.55,57,59,60 Presence of 10 or more T2 WML at baseline was associated with accelerated development of disability after a first demyelinating attack and an 11-fold increased risk (95% CI: 6.7–19.3) of reaching EDSS 3.0 after a median follow-up of 81 months, 53 whereas 20 T2 WML or at least 2 Gd+ (gadolinium-enhancing) lesions at baseline predicted aggressive MS, defined by an EDSS of 6 after 10 years. 57 Patients who had progressed to SPMS at 20 years had higher T2 lesion volumes at baseline (median, 2.5 ml; range, 0–55 ml) compared to those who had not (0.7 ml; range, 0–13.7 ml). 55 In a study evaluating several brain MRI metrics, presence of two or more infratentorial lesions best predicted EDSS 3.0 after a median follow-up of 8.7 years. 72 In patients with at least 9 T2 lesions at onset, infratentorial lesions increased the risk of relapse and of reaching EDSS 3.0 after a median follow-up of 7.7 years. 71 Identification of at least one infratentorial lesion at baseline indicates an increased risk of EDSS >3.5 at 30 years [odds ratio (OR) 16.8; 95% CI: 2.0–139.7] and of having SPMS at 30 years disease duration (OR 26.0; 95% CI: 3.1–215.0). 73
The presence of at least one spinal cord lesion at onset predicted a second attack and increased the odds of EDSS progression after 5 years.51,66 Especially when asymptomatic, spinal cord lesions increased the risk of reaching EDSS 3.0 [hazard ratio (HR) 29.8; 95% CI: 1.1–786.5]. 67 Moreover, the number of baseline spinal lesions is independently associated with EDSS level and EDSS worsening after a median of 5.2 or 5.1 years.68,69 Within 2 years of disease onset, spinal cord lesions independently predicted EDSS ⩾4.0 after 7 years. 70 At least one spinal cord lesion at baseline predicted EDSS at 15 years and indicated strongly higher odds of having SPMS after 15 years (OR 4.71; 95% CI: 1.72–12.92). 63 Asymptomatic spinal cord lesions were found in 43 of 143 patients (30.1%) with a non-spinal first demyelinating attack; unlike brain lesions, they were identified as an independent risk factor for short-term disability. 67
In RIS patients, infratentorial and spinal cord lesions are independent predictors of a first clinical attack or conversion to primary progressive MS.92,93
T1-hypointense lesions
Lesions with persistent, marked T1-hypointensity in the absence of Gd enhancement on T1-weighted (turbo/fast) spin echo sequences are historically addressed as chronic/persistent black holes (CBH) (Figure 1). They are not frequently observed in early MS stages. CBH signify permanent tissue destruction, including neuroaxonal loss, and are correlated with disability in cross-sectional studies.94,95 The relation between baseline T1 lesion volume and long-term disability outcomes is not well understood. One study reported a significant association between a composite of baseline CBH volume and increase over time with disability after 10 years. 61 At the first demyelinating attack, T1 lesion load predicted MSFC after 6 years, whereas baseline volume did not predict disability in another study.62,96 T1 spin echo sequences are not commonly performed in the routine examination of MS patients, limiting the availability of this measure.
Gd+ lesions
Gd+ lesions indicate acute inflammation leading to blood-brain barrier disruption, that is, active disease. At onset, they predict the occurrence of a second attack.51,64 If detected at the first demyelinating attack or within 1–3 years after diagnosis of MS, indicating persistent inflammatory disease activity, Gd+ lesions are linked to mid-to-long term disability and higher odds of having SPMS after 15 years; this association is even more pronounced in patients with spinal lesions (Figure 1).51,62,63 Demonstration of two or more Gd+ lesions 3–5 months after a first demyelinating attack identified patients with aggressive MS (EDSS ⩾6.0 after 10 years) in a large cohort. 57
Cortical grey matter lesions
Imaging of cortical grey matter lesions (CL) requires appropriate acquisition parameters including sufficient spatial resolution, magnetic field strength (preferably 3T) and pulse sequences such as 3D double inversion recovery (DIR) and/or phase-sensitive inversion recovery (PSIR) (Figure 1). The clinical relevance of CL particularly regarding cognition has been conclusively demonstrated. 74 The number of CL at disease onset is an independent predictor of disability and of the risk and time until conversion to SPMS.75,76 In patients with seven or more CL present at baseline, half developed SPMS within 6.5 years. 76 This demonstrates the importance of cortical lesions when detected in the diagnostic work-up of patients with suspected MS. Accordingly, CL were included in the 2017 revised McDonald criteria for the demonstration of dissemination in time. 2 Presently, inclusion of DIR or PSIR sequences is not recommended for routine monitoring purposes due to limited availability and concerns of reproducibility.8,97
Volumetric data
Brain atrophy is a marker of irreversible neuroaxonal loss. After the first demyelinating attack, reduced normalized brain volume (NBV) and GMV are predictors of disability progression.60,77 Prognostic information appears to derive mainly from subcortical grey matter atrophy, whereas changes in white matter volume are not demonstrably predictive.77–79
Particularly in progressive MS, atrophy of the cervical spinal cord is moderately correlated with EDSS. 98 In patients with a non-spinal first demyelinating attack, the change in upper cervical cord cross-sectional area (UCCA) over 5 years was independently associated with EDSS at follow-up, whereas baseline UCCA did not predict EDDS 3.0 after 5 years. 63 Accelerated atrophy of the upper cervical spinal cord precedes conversion to SPMS by at least 4 years. 99
While considered a helpful predictor of the future disease course, quantitative MRI so far plays a limited role in the routine clinical care of individual patients, due to difficulties in implementation and numerous potential confounders. 44
Paramagnetic rim lesions
PRL are identified using susceptibility-based MRI techniques, most commonly susceptibility weighted imaging (SWI) at 3T or 7T. PRL form a relatively small subset of SEL detected in longitudinal studies. 81 On histopathological examination, PRL reflect chronic inflammation at the border of the lesion with iron-laden microglia and macrophages. 82 Overlapping histopathology terms include chronic inactive-active lesions or ‘smoldering’ lesions. This lesion type is associated with compartmentalized neuroinflammation, failure of remyelination and ongoing tissue damage.22,82,100 PRL were found in 27% of recently diagnosed RRMS patients. 101 The presence of four or more PRL was an independent predictor of disability worsening in a heterogeneous group of MS patients. 22 In a cohort of 61 recently diagnosed patients (median disease duration, 0.4 years), more than half had at least one PRL at baseline, and 92% had at least one SEL. 82 PRL showing slow expansion on follow-up scans were associated with greater EDSS progression after a median of 3.2 years. 82
Prognostic value of MRI during early follow-up
Within at least 5 years from diagnosis, T2 lesion load remains a predictor of long-term disability in established RRMS. 59 Further information can be derived by comparing baseline and follow-up MRI: New T2 lesions after 3 months identify patients with subclinical disease activity and a high risk of relapse. 52 Development of new or enlarging T2 WML over 2–3 years was weakly correlated to changes in disability. 58 An increase in T2 WML volume after 2–5 years correlated moderately with physical and cognitive impairment after 13–14 years, and a yearly increase by 2.89 ml (95% CI: 1.78–4.01) predicted SPMS after 20 years.55,59,102 Moreover, new infratentorial or spinal cord lesions within the first 1–3 years predicted SPMS after 15 years. 63 Accumulation of T2 lesions over time does not reflect the total amount of focal inflammation since lesions may remyelinate or shrink over time. In fact, atrophied T2 lesion volume has been suggested as a marker of disease progression. 103
Current focal inflammation on MRI can be assessed by Gd-enhanced imaging, if required. 8 Emergence of new Gd+ lesions predicts short-term relapses but not confirmed disability progression during the following 2 years. 104
Longitudinal MRI may identify an increased rate of brain volume loss, which is associated with subsequent disability.60,77,105 Brain atrophy can be difficult to interpret early after the initiation of anti-inflammatory DMT due to pseudoatrophy. 106 Baseline GMV predicts disability progression and conversion to SPMS after 9 years. 107 Central or subcortical grey matter atrophy may be of particular prognostic relevance in predicting clinical impairment.78,80,108,109 Accelerated atrophy may be conceptualized as premature aging of the brain, implying reduced functional reserve. 110
Prediction of treatment response
In addition to the predictive value of imaging characteristics in terms of disease and disability progression in general, MRI may also aid in predicting treatment response. An increase of T2 lesion volume, or emergence of new T2 lesions or of combined active lesions (new or enlarging T2 lesions and Gd+ lesions) on MRI in the first 1–2 years of DMT was first identified as a predictor of disability progression in interferon-treated patients.111–114 Later, no evidence of disease activity (NEDA) was introduced not only as an outcome in clinical trials, but also as a therapeutic goal and measure of individual treatment response.115–119 NEDA-3 status requires the absence of relapses, EDSS progression and inflammatory MRI activity (new or enlarging T2 lesions and Gd+ lesions).115,116 NEDA-4 expands this definition by adding the absence of increased whole brain atrophy. 120 Further modifying the NEDA concept by including liquid biomarkers, such as neurofilament light chain concentrations in the serum, has been suggested. 121 A recent meta-analysis of DMT trials found that a NEDA-3 or NEDA-4 status after 1 or 2 years indicated a lower risk of long-term disability progression after 6 years. 122
To weigh the risk of treatment failure, several operationalized derivations of the NEDA concept have been proposed to measure efficacy after 1 year of treatment. These systems aim to define a level of disease activity while on DMT (minimal evidence of disease activity, MEDA) that can be tolerated without risking disability worsening. 123 For patients treated with interferon-beta, the Rio score is calculated by adding one point each for (a) at least one relapse, (b) at least three new MRI lesions, and (c) a sustained EDSS deterioration by at least one point; this results in a prediction of low (score 0–1) or high (2–3) risk. 124 For the modified Rio score, one point is given for (a) at least five new T2 lesions, and (b) one relapse, while two points are given for two or more relapses after 1 year. Again, 0–1 points indicate low risk, while 2–3 indicate high risk. 125 Long-term follow-up of patients showed that a Rio score of at least 2 obtained after 1 year was associated with EDSS worsening after 6.7 years. 126 Obtained after 1 year, the MAGNIMS score rates 3 or more new T2 lesions with one point, one relapse with one point and two relapses with two points. A total score of 0–2 is calculated, indicating a low, moderate or high risk of treatment failure (EDSS worsening or treatment switch for inefficacy; 27% and 48% for scores 1 and 2 respectively) and of disability progression (22% and 29% for scores 1 and 2 respectively) at 3 years. 127 MAGNIMS score predicted a 7-year risk of disability worsening in teriflunomide treated patients, and long-term disability progression for up to 15 years in interferon beta-1a treated patients.128,129 Application of the MAGNIMS score to ponesimod treatment has so far only been published as an abstract. 130 In all of these scoring systems, isolated development of new lesions in the absence of clinical relapse or early EDSS progression was not significantly linked to EDSS worsening. However, longer-term follow-ups indicate an increased risk of disability also in the intermediate risk categories of the modified Rio and MAGNIMS scores, calling into question the use of MEDA thresholds in guiding therapy. 11 Unless clearly attributable to treatment inadherence, for many MS neurologists any new asymptomatic MRI activity while on platform DMTs prompts treatment escalation. 131
Inclusion of MRI in the treatment decision-making process
Need for early risk stratification in MS
Significant progress has been made in understanding the clinico-pathological evolution of MS. Very early in the disease, focal autoimmune demyelination probably lays the groundwork for smouldering inflammation and progressive neuroaxonal loss which may contribute to disability progression independent of relapse activity (PIRA).13–133 A significant role of chronically activated, pro-inflammatory microglia is increasingly recognized. 13 With current DMTs focussing on peripheral adaptive immunity, new treatment options targeting microglia are under development, including BTK inhibitors. 134
Concerning presently available DMTs, data from active-controlled trials, open-label extensions and large patient registries supports the efficacy of early highly effective treatments (HET) not only to reduce relapses and focal demyelination but also long-term disability and conversion to SPMS.135,136 However, accelerated brain atrophy and disability progression may persist even if relapses and new lesions are successfully controlled by DMT. 137 It is because of this ‘silent progression’ that the ability of current DMTs to reduce PIRA has been questioned. On the other hand, the potential of early HET to prevent smouldering inflammation and PIRA remains in part unexplored due to the imperfect suppression of focal inflammation even with HET and delayed treatment initiation in already symptomatic disease. 138
Reserving HET for clinically manifest ‘highly active’ or ‘aggressive’ MS implies foregoing a preventive approach until irreversible damage has accumulated, functional reserve has been compromised, and secondary neurodegeneration has already been induced. Considering the improved long-term safety of modern DMT, many MS neurologists therefore advocate first-line use of HET in active MS rather than following an escalation approach.121,139 Still, the risk of long-term disability from MS must be weighed against potential side effects from DMT. Tailored therapy therefore should be based on an early prognosis of the individual risk of long-term disability. 140 Most of the available evidence on unfavourable predictors was derived in cohorts that did not yet have access to HET, highlighting the potential to improve the outcome of those at risk.
Early MRI findings remain the strongest biomarkers for mid- and long-term disability outcomes in MS so far. 141 Notably, WML dynamics decrease over time and lose predictive quality with longer disease duration and in progressive disease.57,100,102,142–144 Loss of correlation of lesion load to present disability and future deterioration reflects an increasing and uncontrollable variance, introduced, for example, by strategic lesions,145,146 damage to specific networks,144,147 spinal cord involvement, 36 and diffuse pathology.35–37 For these reasons, the predictive capabilities of MRI should be applied in early RRMS and strongly guide initial treatment decisions.
Integrated interpretation of early MRI findings
Three interconnected levels of information are available from MRI at the time of diagnosis or soon thereafter (Figure 2):
- The number and/or volume of T2-hyperintense lesions indicate the extent of accumulated focal demyelination, complemented by T1-hypointense and cortical lesions. Lesion burden reflects the intensity and duration of MS in the preclinical phase and may be visualized as suggesting the actual position of the individual on a generalized MS trajectory. Hence, these metrics contain staging information.
- The number of Gd+ T1 lesions on a single study or the increase in T2 lesion load on short-term follow-up reflect disease activity. The level of disease activity relates to the dynamics of disability increase and time to onset of SPMS and can be interpreted as grading information.
- Functional reserve, that is, the ability to compensate for further neuroaxonal loss, is influenced by lesion accrual, but it also correlates to whole brain and GM atrophy and to damage of non-redundant pathways, for example, motor tracts, brain stem or spinal cord. Lower reserve implies a shorter time to disability milestones and onset of SPMS.
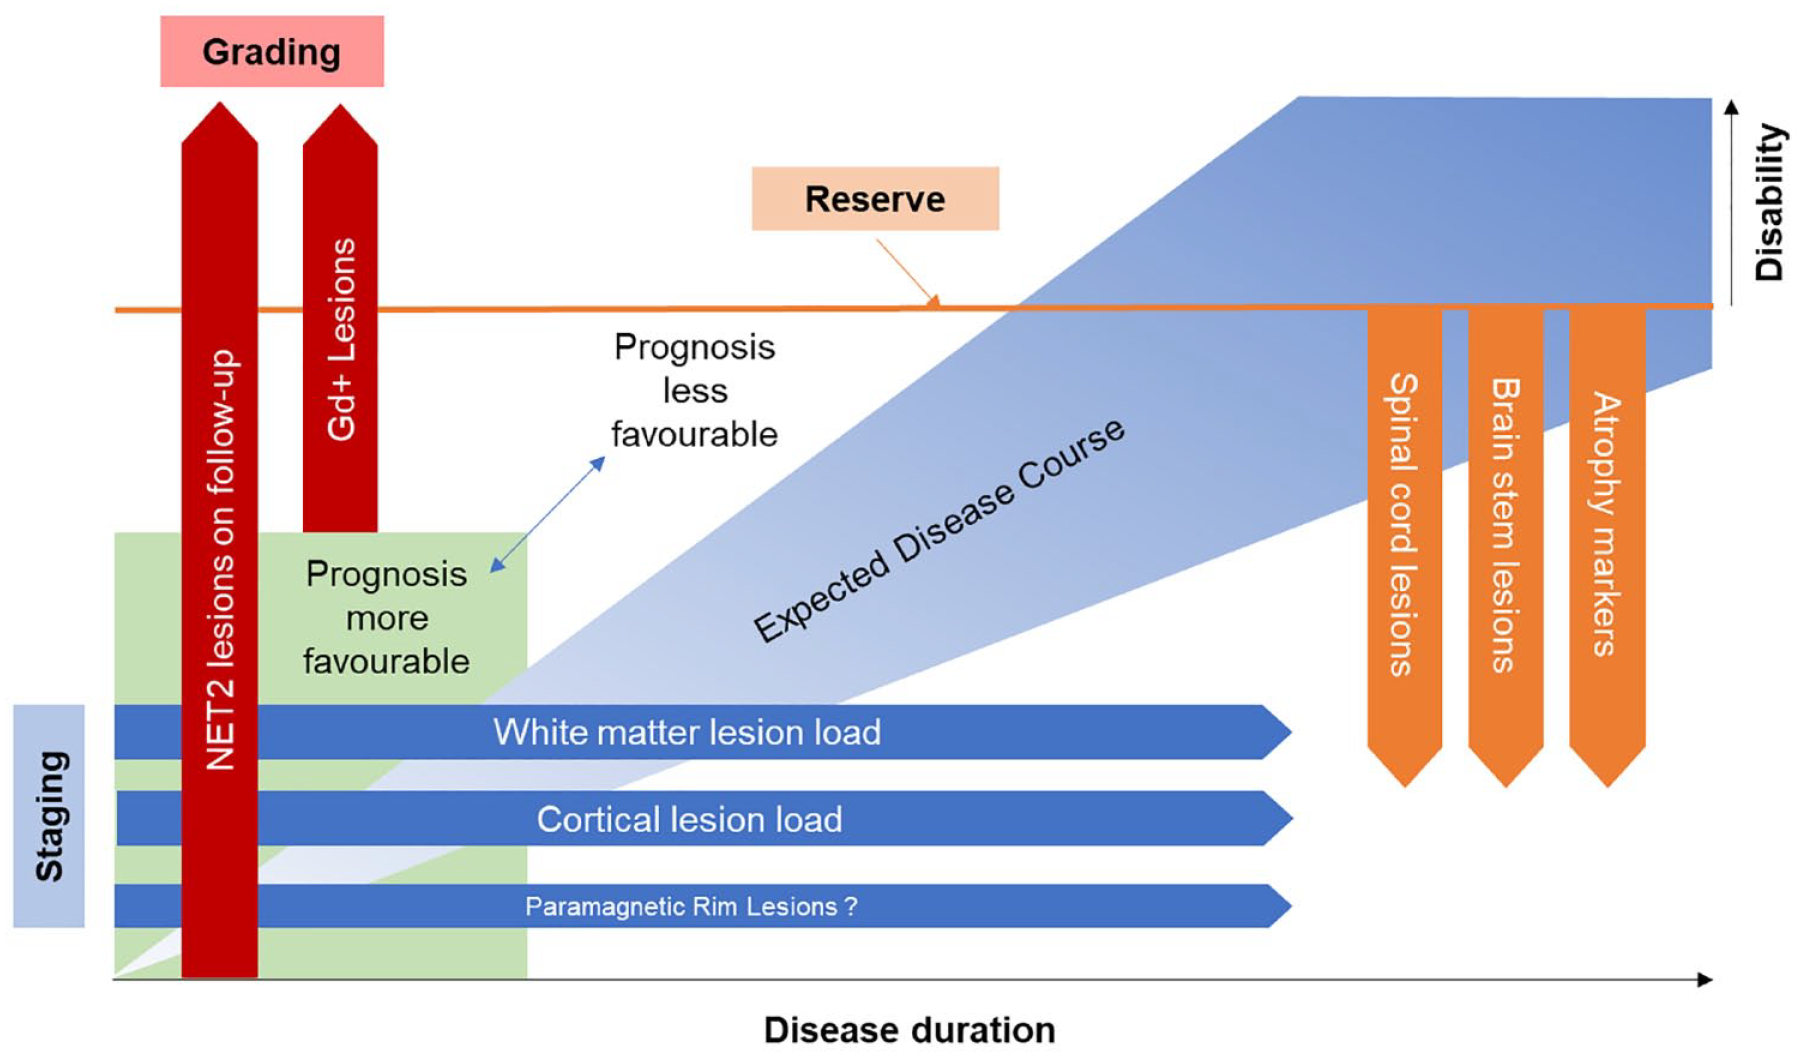
Integrated view of prognostic MRI findings. The expected course of the disease, in particular the evolution of disability over time, is modulated by the level of disease activity and brain reserve. Initial disease activity can be graded according to the presence of gadolinium-enhancing (Gd+) lesions or the number or volume of new or enlarging T2-hyperintense (NET2) lesions on short-term follow-up scans. White matter and cortical lesion load is a product metric of preclinical disease duration and severity, providing staging-related information. In addition to lesion volume, atrophy and presence of lesions in critical systems such as spinal cord and brain stem indicate lower functional reserve and a risk of more rapid development of disability. Together, staging, grading and reserve-related information may be useful in predicting the individual disease course and recommended treatment intensity.
In clinical experience, patients show abnormality typically in not one but several MRI parameters, and this is reflected in the multivariable analyses and correlation studies reviewed above.
Proposed approach to early prognosis
When discussing the role of MRI in initial treatment decisions, similar challenges emerge as with the MEDA concept for treatment escalation. Key questions include: What level of disability risk is considered acceptable? What is the requisite level of accuracy for a predictor to be deemed actionable? Most RRMS patients face a substantial risk of disability,148,149 and any avoidable impairment would be unacceptable from their perspective. If a ‘non-benign’ course of MS is assumed as the default scenario rather than a ‘benign’ one, establishing safe cutoffs for individual predictors or their combination becomes even more complex.
We propose a simplified, pragmatic approach to MRI in the initial treatment decision and follow-up: newly diagnosed patients should undergo a full MRI assessment at baseline. 8 This includes high quality 3D FLAIR and Gd-enhanced T1 scans of the brain to determine white matter T2 lesion load as well as presence of hypomyelinated and cortical lesions. If routinely available, DIR (or PSIR) and SWI sequences for improved detection of cortical lesions and PRL, as well as measurements of lesion and brain volumes can be included. All patients should undergo MRI of the entire spinal cord.
Estimated risk stratification for each metric is listed in Table 1. T2 lesion count or volume should be regarded as the strongest predictor. The specificity of any T2 lesions should be ascertained, if necessary, by demonstration of a central vein. 8 Except for atrophy measures, all remaining predictors imply the presence of T2 lesions.
In patients presenting with low-risk findings on each available staging, grading and reserve-related metric, a favourable prognosis is suggested, and these patients may be offered a moderately effective DMT as their initial treatment. If one or more predictors indicate an unfavourable prognosis, HET should be recommended first-line.
Following the initiation of a DMT, it is advisable to consistently observe patients for any signs of disease activity. A re-baselining MRI is obtained after the expected onset of effect at 3–6 months. In the absence of clinical relapse, treatment effectiveness is determined by a further MRI after 1 year of therapy. A relevant (⩾3) increase in T2 lesions predicts treatment failure and should prompt escalation to a DMT with higher efficacy. Gd-enhanced acquisitions are not recommended for routine follow-up MRI but may add predictive value when included in the re-baselining study.8,150
Treatment decisions should take into account additional risk factors for a more rapid progression of disability or earlier conversion to SPMS, including older age,89,148,151,152 male sex, 148 clinical disability, 153 early relapse frequency,89,148,154,155 presence of oligoclonal bands in the CSF, 156 elevated serum concentration of neurofilament or glial fibrillary acidic protein (GFAP),157,158 vitamin D deficiency 159 and comorbidities. 160 Moreover, individual treatment risks, patient preferences (e.g. planned pregnancy), local availability and licensing of DMTs must be considered.161,162
In view of recent advances in risk stratification of patients with RIS,48,49,80,163 it is likely that most MRI predictors also apply to preclinical MS. As we still await further evidence on DMT use in RIS,164,165 we have limited our discussion here to patients with early established MS according to the current McDonald diagnostic criteria.