
Abstract
Background:
There are limited data on the impact of myasthenia gravis (MG) on real-world healthcare resource use (HCRU) and patient burden in the United States.
Objectives:
This study aims to assess HCRU in patients with MG using data from a US health claims database.
Design:
A retrospective, database study of adult patients newly diagnosed with MG, using the IBM® MarketScan® Commercial Claims and Encounters and Medicare supplemental health insurance claims database.
Methods:
Patients with ⩾2 MG International Classification of Disease diagnosis codes ⩾3 months apart were followed from the date of their first MG diagnosis record or start of treatment. HCRU and use of immunoglobulins and plasma exchange during follow-up was assessed, as well as comorbidities, hospitalizations, emergency room (ER) visits, intensive care unit (ICU) admissions, and specialist visits per year after diagnosis, and compared with age- and sex-matched non-MG controls.
Results:
During 2010–2019, 7194 patients were followed for up to 10 years (median = 2.3 years). During follow-up, patients with MG were 2.6-fold more likely than controls to be hospitalized, and 4.5-fold more likely to be admitted to an ICU. Risk and numbers of ER admission, hospitalization, and ICU visits were the highest in the 12 months post-diagnosis of MG and were consistently higher than controls during follow-up. MG was the main cause for most hospitalizations.
Conclusion:
Patients with MG have higher HCRU, compared with the age- and sex-matched non-MG controls. The early years after MG diagnosis are a period of particularly high healthcare burden, with many patients requiring hospitalization and ICU care to manage serious exacerbations.
Introduction
Myasthenia gravis (MG) is a rare autoimmune disorder characterized by fluctuating skeletal muscle weakness and fatigue. It is a disease of the neuromuscular junction (NMJ) in which antigen-specific antibodies are directed against the acetylcholine receptor (AChR) or muscle-specific tyrosine kinase in most patients.1,2 In AChR autoantibody-positive MG, the development of pathogenic autoantibodies activates the complement cascade, causing damage to the NMJ and impaired muscle contraction. 3
International consensus guidance for the management of MG recommends acetylcholinesterase inhibitors (AChEIs) as part of patients’ initial symptomatic treatment, followed by non-specific immunosuppression with corticosteroids (CSs) and non-steroidal immune suppressants (NSISTs) in patients with an insufficient response to AChEI. 4 While sometimes used as maintenance treatments for chronic use, 5 intravenous immunoglobulin (IVIg) and plasma exchange (PLEX) are predominately used as short-term, acute treatments in patients for whom a rapid response to treatment is required, such as in the case of exacerbations or myasthenic crises. 4 Subcutaneous immunoglobulin (SCIg) is an emerging therapeutic option in the chronic maintenance of MG, which has the potential for improved ease of use compared with IVIg.5,6 Increased understanding of immunological targets has paved the way for more selective, targeted therapies coming to market, which include complement inhibitors and neonatal Fc receptor inhibitors. 6
Despite treatment, people with inadequately controlled MG can experience increased healthcare utilization and costs compared with nonrefractory MG or the general US population.7–9 As identified by a systematic review published in 2020, the main factors driving healthcare costs of MG are hospitalizations, myasthenic crises, and IVIg and PLEX use. 10 Patients in the United States who received more than 20 IVIg single infusions over 2 years accounted for 62% of all MG-related pharmacy costs. 11
There are a few published studies on real-world healthcare resource use (HCRU) in patients with MG, and further data are required to fully understand the impact MG has on healthcare resource utilization and patient burden. The IBM® MarketScan® database includes enrollment history and claims from inpatient, outpatient and emergency care (diagnosis, procedures, and administered drugs), and pharmacy services (prescriptions) for approximately 50 million covered persons in the United States annually from 2010 to 2019. Using this large, real-world database, we conducted a retrospective analysis of US insurance claims data from patients diagnosed with MG in the United States to assess their healthcare resource utilization.
Materials and methods
Study design and data source
This was a retrospective database study of newly diagnosed people with MG during 2010–2019 from the IBM® MarketScan® Commercial Claims and Encounters and Medicare supplemental, a commercial healthcare claims database that includes insurance claims from US employees and their dependents, representing all US census regions. The database is Health Insurance Portability and Accountability Act (HIPAA) compliant, and all patient data were de-identified before delivery to the study team. Patients with MG were identified using the International Classification of Diseases, Ninth and Tenth Revision (ICD-9 and ICD-10) codes for MG (ICD-9 358.0 including 358.00 and 358.01, and ICD-10 G70.0 including G70.00 and G70.01). Information on their medical and pharmacy encounters, including hospital visits and specialist visits, was assessed, using ICD-9-Clinical Modification, ICD-10, Healthcare Common Procedure Coding System, and Current Procedural Terminology-4 codes (Figure 1). The index date was defined as either the (1) date of first MG diagnosis, (2) date of start of AChEI, or (3) date of first Ig (includes IV and SC) or PLEX therapy, whichever came first. AChEI was chosen as it is generally reserved only for treatment of patients with MG; Ig and PLEX therapy were chosen to account for patients presenting with severe MG or MG crises who were likely to be initially treated with Ig or PLEX therapy. As steroids and non-steroidal immunosuppressants (e.g. azathioprine) are often used to treat other indications, treatment initiation with these drugs was not chosen as an alternative index date. Patients were followed until discontinuation of continuous medical and pharmacy benefits enrollment, end of study period, death, or end of database coverage period, whichever came first.

Study design.
Study population
The study population consisted of patients who were aged ⩾18 years and were registered with at least two MG diagnosis codes as described above, a minimum of 3 months apart. Patients were also required to have had at least 1 year of continuous medical and pharmacy benefits membership prior to the index date (an enrollment gap of up to 60 days was allowed), and to ensure that only incident patients were included, a washout period of at least 12 months prior to the index date (no MG medical encounters, AChEI, Ig, or PLEX use) was applied.
A matched general population control cohort was created; patients were selected among health plan members with no medical claims with a diagnosis code for MG (358.0x or G70.0x) at any time during the study period and were matched to patients in the MG cohort 5:1 by age and sex. For the control cohort, a patient with MG’s index date was used as a ‘pseudo-index date’ for the matched patients in the general population control group.
Study outcomes
The study outcome measures for both patients with MG and their matched controls, included comorbidities, reported before and after index during follow-up, and HCRU in terms of emergency room (ER) visits, intensive care unit (ICU), hospital admissions, visits to outpatient clinics, neurologist, and other specialist visits at baseline (12 months prior to index date), during all follow-up periods, and per year during the first 5 years after index date. In addition, for patients with MG only, HCRU directly related to MG was recorded. Furthermore, for patients with MG, clinical outcomes including MG exacerbations, myasthenic crises, and use of IVIg and PLEX treatment were also assessed during follow-up time and per year after index date. Definitions of these outcomes are presented in Appendix Table 1.
Results
Demographics and comorbidities
Between 2010 and 2019, 7194 newly diagnosed patients with MG (aged ⩾18 years) were followed for up to 10 years, with a mean follow-up time of 2.84 years (median = 2.3 years). Almost half of patients were male (49%). Overall, the mean age at diagnosis was 60 years, and 23% of patients had early onset MG (aged <50 years at time of diagnosis) (Table 1). Compared with 35,970 age- and sex-matched controls, patients with MG had more comorbidities at baseline and higher risk of developing new comorbidities during follow-up (Table 2). Prior to index date, 36% of patients with MG and 29% of controls had dyslipidemia, 23% and 16% had type 2 diabetes, 12% and 6% were obese, 5% and 3% had osteoporosis, and 19% of patients with MG versus 11% of controls had anxiety and/or depression. During follow-up (median = 2.3 years), new cases of dyslipidemia were reported in 29% of patients with MG, type 2 diabetes in 14% of patients with MG, obesity in 20% of patients with MG, osteoporosis in 8% of patients with MG, and anxiety and/or depression in 25% of patients with MG. During follow-up, compared with age- and sex-matched controls, patients with MG had 2-fold higher risk of autoimmune disease and type 2 diabetes, 1.7-fold for obesity, 1.8-fold for osteoporosis, and 1.9-fold for anxiety and/or depression. The highest difference was observed for risk of systemic infections, with a rate ratio (RR) of 3.98 (Table 2).
Baseline demographics of MG cohort (N = 7194).

MG, myasthenia gravis.
Incidence of comorbidities among patients with MG and age- and sex-matched controls 1 year prior to index date and new cases reported during follow-up.

CI, confidence interval; IR, incidence rate; MG, myasthenia gravis; RR, rate ratio.
The denominator for the percentages in these columns is the number of patients who had the comorbidity in the 12 months prior to index subtracted from the total N.
Autoimmune diseases include autoimmune thyroiditis, rheumatoid arthritis, systemic lupus erythematosus, type 1 diabetes, ankylosing spondylitis, psoriasis, psoriatic arthritis, Crohn’s disease, and ulcerative colitis.
A systemic infection was defined as: presence of a claim with ICD-9 or ICD-10 codes on different dates for bacteremia, septicemia, and systemic inflammatory response syndrome (ICD-9: 790.7, 038, 995.92, 995.94 or ICD-10: R78.81, A40.xx, A41.xx, R65.20, R65.11).
HCRU and clinical events
Overall, 61% of patients with MG included in this cohort had at least one ER visit during follow-up, with the risk of an ER visit being 2.2-fold higher than for controls (increased risk = 31.7 versus 14.4, respectively). The risk of an ER visit was the highest during first year after index date, with 43% of patients with MG visiting the ER at least once (Figure 2(a)). Event rates of MG-related ER visits in patients with ⩾1 event declined from 2.53 per patient per year (PPY) during Year 1 to 2.42 per PPY during Year 5; on average, patients with MG had 0.48–0.73 additional visits per PPY more than sex- and age-matched controls (Figure 3(a)). During follow-up, 48% of patients with MG were hospitalized; 33% during Year 1, with declining numbers over the course of the disease to around 16% during Year 5 (Figure 2(b)). As a comparison, around 8% of controls were hospitalized annually and the risk of hospitalization any time after diagnosis was 3.5-fold higher in patients with MG than controls (highest difference during first year after diagnosis with RR = 5.6, data not shown). Also, among patients with at least one event, the event rates of hospitalizations among patients with MG declined from 1.86 per PPY during Year 1 to 1.56 per PPY during Year 5. Event rates of hospitalization among controls with at least one event remained relatively similar throughout follow-up, with 1.26 events per PPY in Year 1 and 1.30 per PPY in Year 5 (Figure 3(b)).

Proportion of patients with at least one (a) ER visit, (b) hospitalization, and (c) ICU admission over 6 years.

Event rates of (a) ER visits, (b) hospitalizations, and (c) ICU admissions over 6 years in patients with at least one event.
Risk of ICU admissions followed the same declining pattern as hospitalizations, with 15% of patients with MG being admitted to ICU during Year 1, decreasing to around 5% during Year 5 (Figure 2(c)). Risk was almost 10-fold higher than in controls during Year 1 of follow-up (incidence rate [IR] = 16.8 versus 1.7, data not shown). Also, event rates of ICU admissions per year in patients with MG and at least one event declined over the course of the disease (1.58 per PPY in Year 1, 1.27 per PPY in Year 5). Event rates of ICU admissions among controls with at least one event remained relatively stable throughout follow-up, with 1.17 per PPY in Year 1 to 1.23 per PPY in Year 5 (Figure 3(c)).
Similar to hospitalizations and ICU admissions, the proportion of patients experiencing serious exacerbations and myasthenic crisis was the highest during the first year after the index date (32.3% and 2.6%, respectively) and slowly declined to 15.2% and 0.7%, respectively, during Year 5 (Table 3). Similarly, the need for acute treatment with Ig and PLEX was the highest during Year 1 (12.5% and 5.9% of patients with at least one cycle of Ig or PLEX, respectively) and the lowest during Year 5 (7.0% and 2.1%, respectively) (Table 3).
Exacerbations, crises, and Ig and PLEX cycles per year.
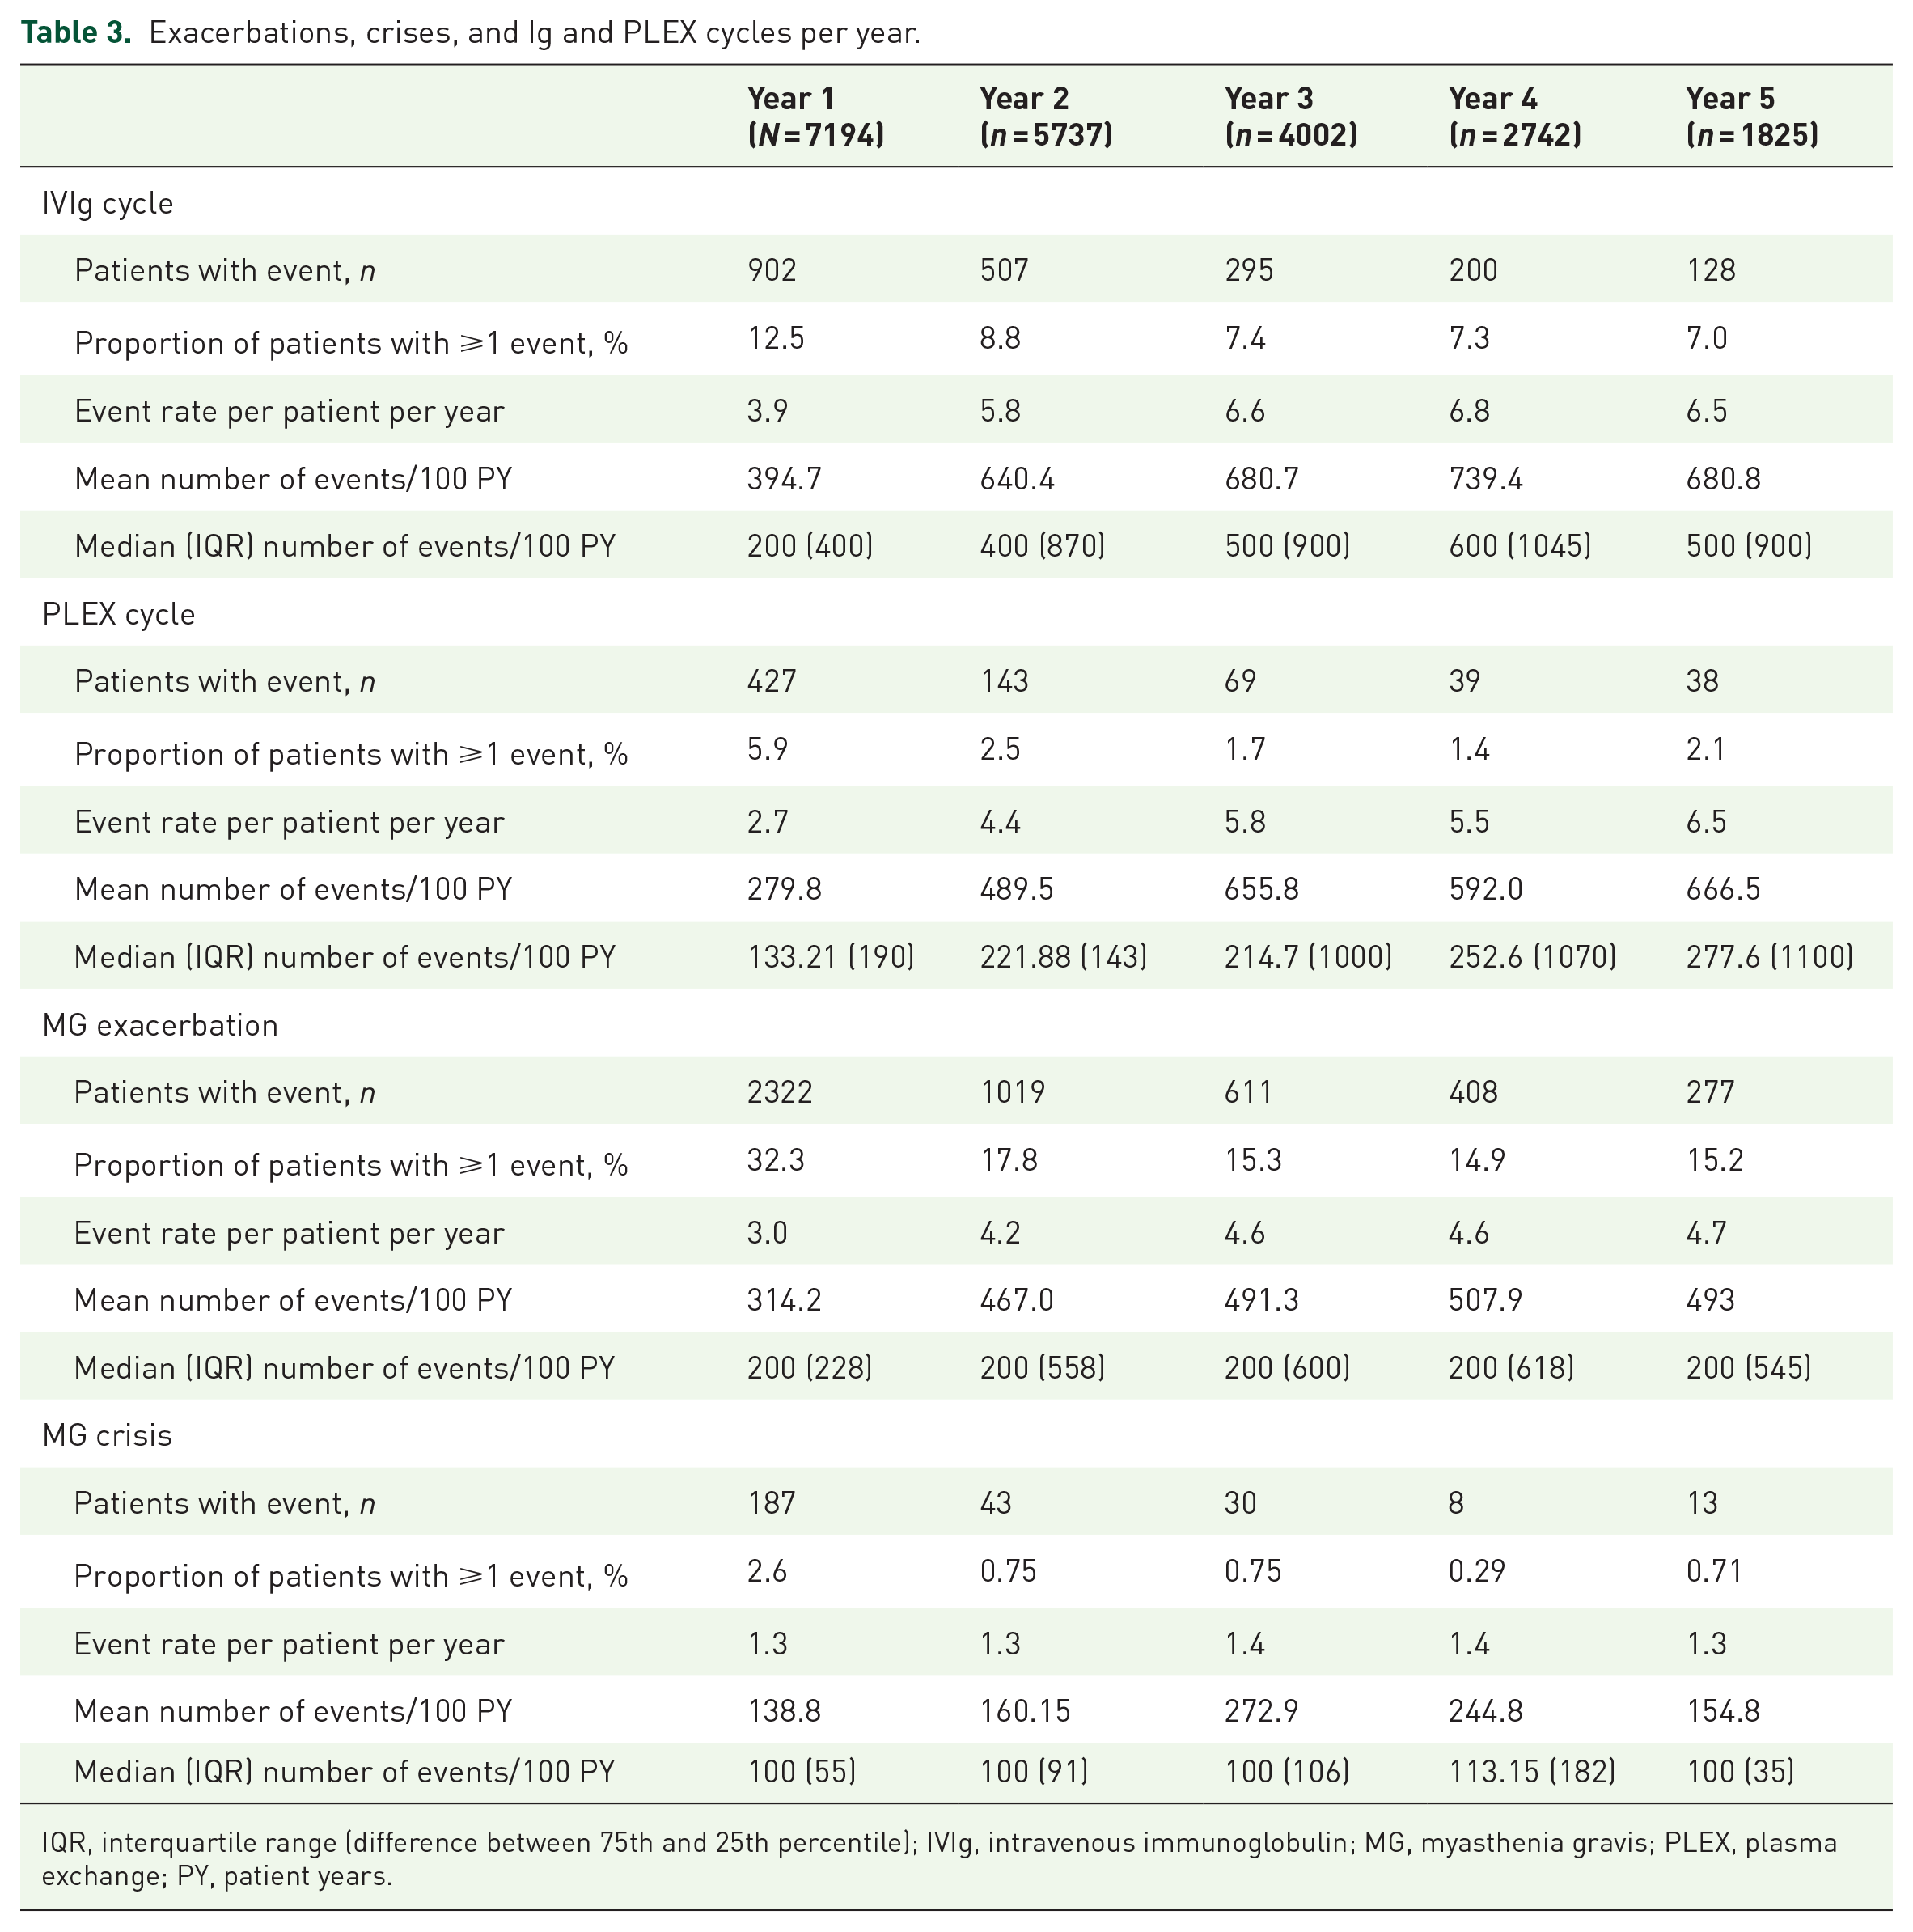
IQR, interquartile range (difference between 75th and 25th percentile); IVIg, intravenous immunoglobulin; MG, myasthenia gravis; PLEX, plasma exchange; PY, patient years.
Despite the proportion of patients experiencing exacerbations declining, the mean number of events per 100 patient years (PY) increased from 314.2 in Year 1 to 493 in Year 5, indicating that there are some patients who have frequent exacerbations and the frequency increases over time. The data show that, in Year 5, 15.2% of patients in the study at Year 5 are experiencing 4.7 exacerbations during that year. Consequently, mean and median number of Ig/PLEX cycles per year increased from Year 1 to Year 5. Only 2.6% of patients had one or more crisis in Year 1, with a mean of 1.3 crises per PY in Year 1 or 139.5 crisis events per 100 PY in Year 1 (Table 3).
The need for neurologist visits among patients with MG was also the highest during the first year after index date, with 73% of patients recording at least one visit in Year 1 falling to around 40–53% during subsequent years of follow-up (Figure 4(a)). Mean number of MG-related neurology visits declined over the course of the disease and was 1.7-fold lower at Year 5 compared with Year 1 (Figure 4(b)). In contrast, neurologist visits among non-MG controls ranged from 4.8% in Year 1 to 5.7% in Year 5, equating to 2.37–2.42 visits on average per PPY among those with at least one event. Patients with MG also had high need for treatments from other specialists: 92% during Year 1 and 80% during Year 5 (Figure 4(c)). The risk of a specialist visit was 1.5-fold higher among patients with MG compared with non-MG controls (difference being the highest during Year 1 with RR = 1.96, data not shown). Mean number of visits to other specialists declined over the follow-up, but was higher in all years of study (on average 4–7.5 additional visits per PPY) than for non-MG controls (Figure 4(d)). Almost all patients (99.9%) with MG had at least one visit to an outpatient clinic during the first year following their MG diagnosis, with more than 97% of these visits owing to an MG-related cause. This proportion declined during follow-up, with 91.4% of patients with MG having at least one all-cause outpatient visit during Year 5. By comparison, the proportion of matched non-MG controls with at least one outpatient visit stayed stable over time: 90.8% at Year 1 and 88.0% at Year 5. The mean number of all-cause outpatient visits during Year 1 was 32.6 among patients with MG, compared with 14.1 among non-MG controls, and was higher in all years of study versus controls, with rate differences ranging from 7.46 in Year 1 to 3.93 in Year 5.
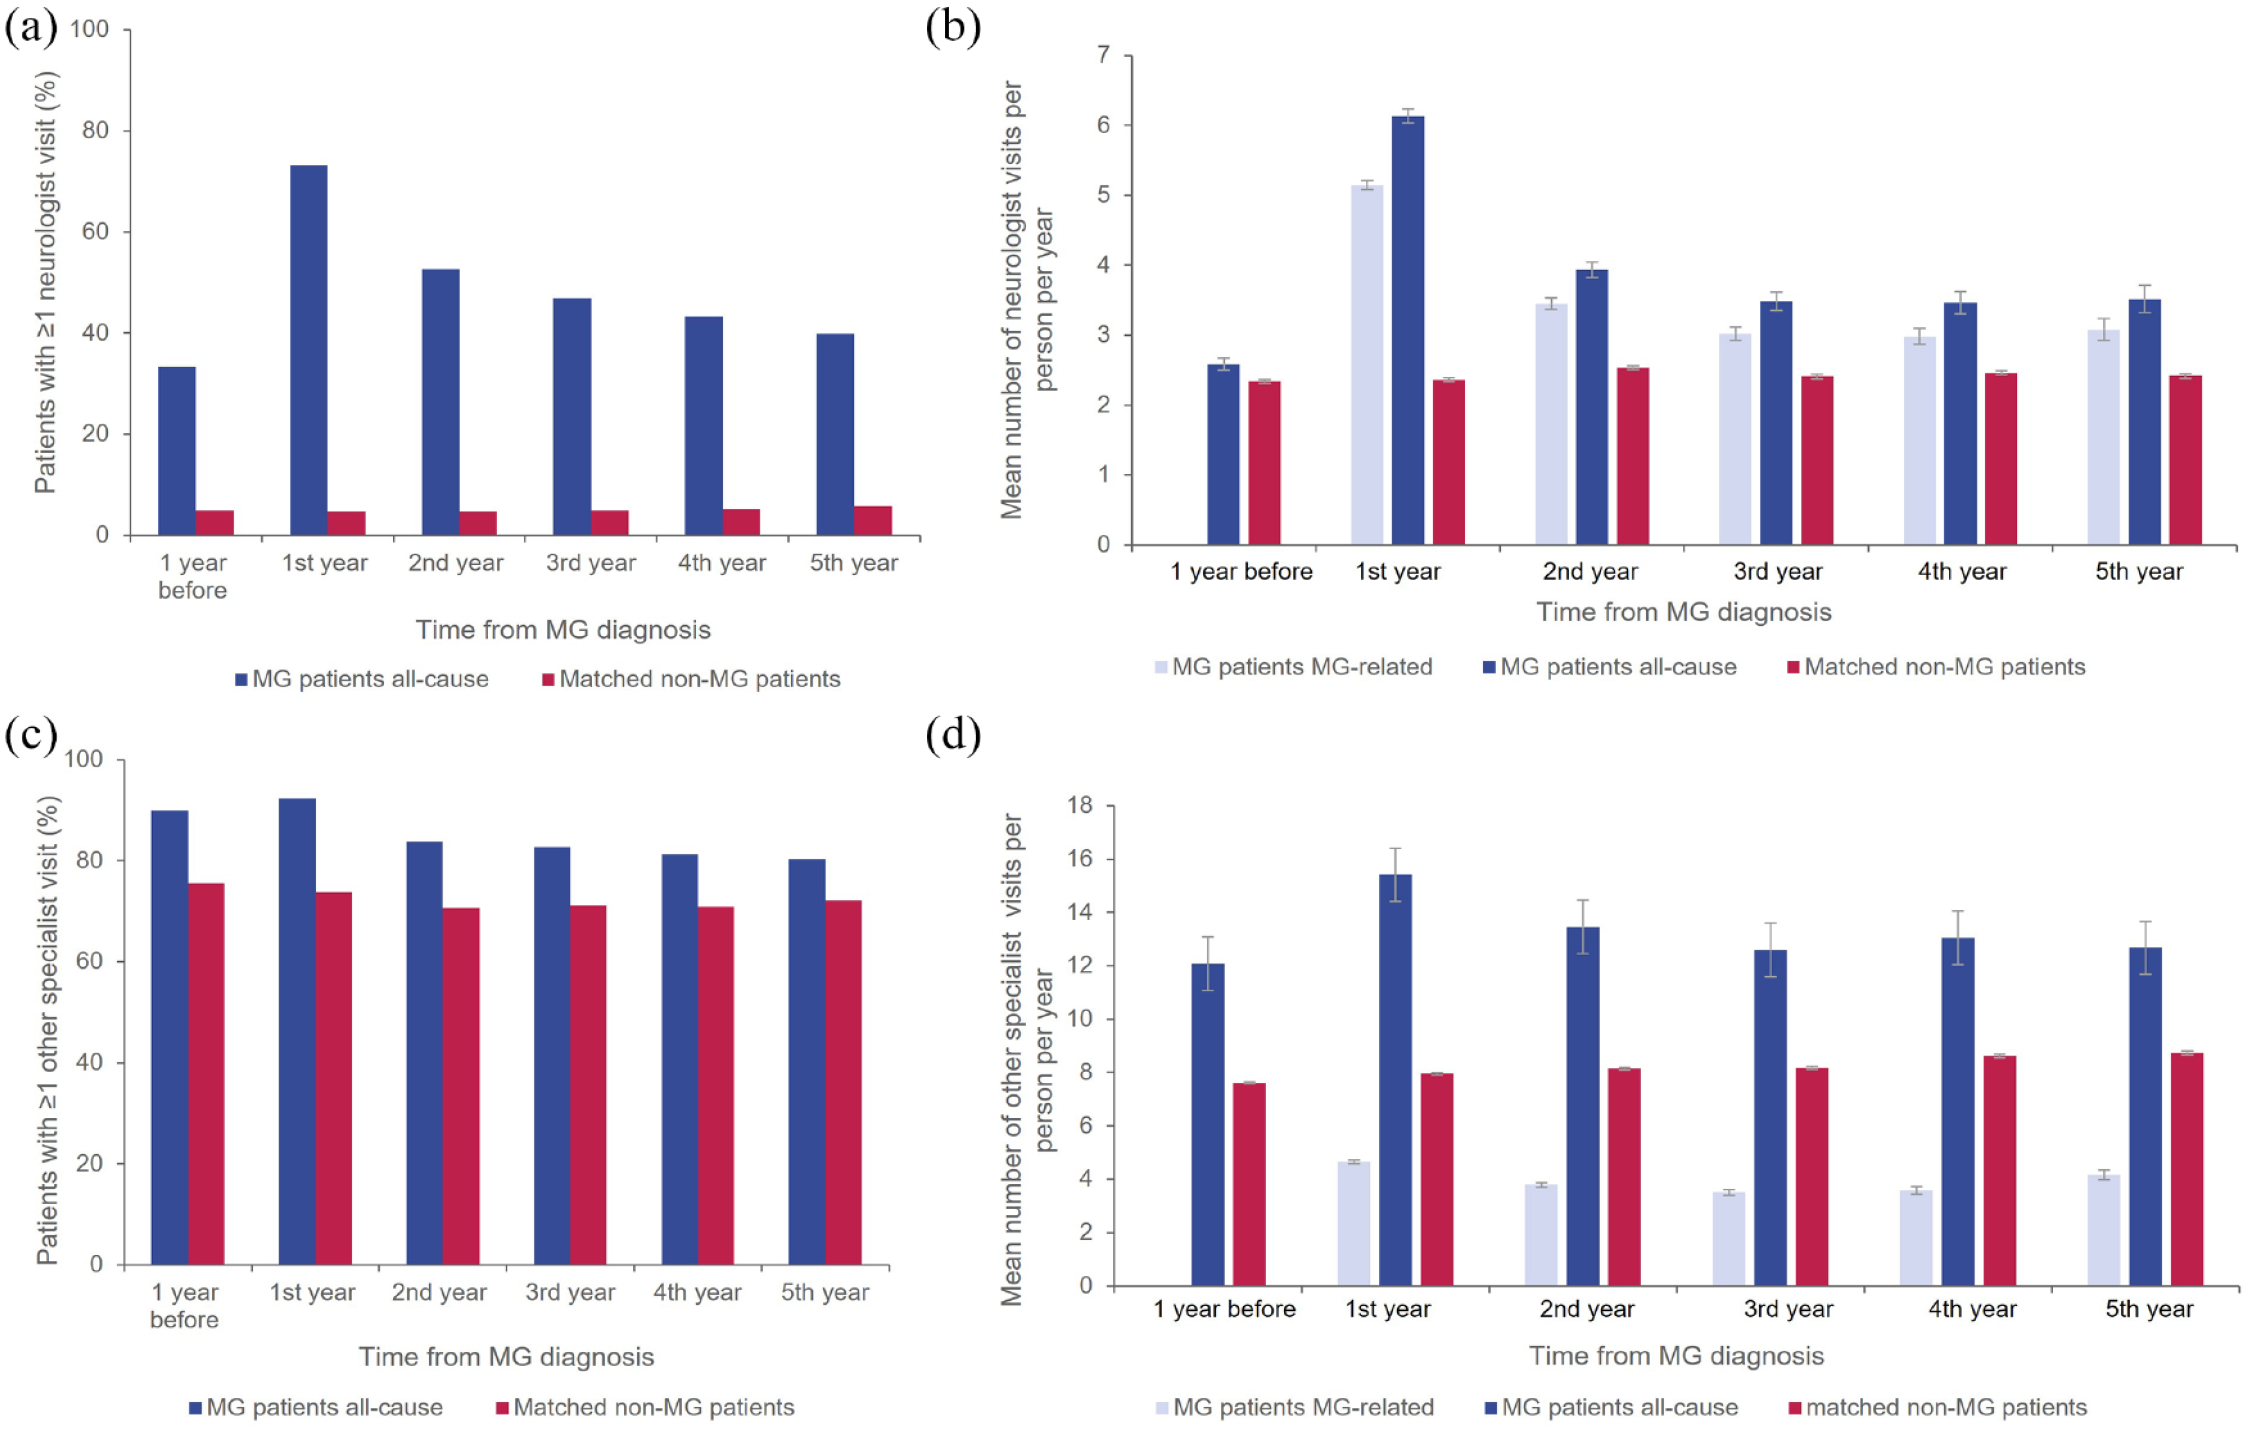
Proportions of patients with ⩾1 neurologist visit (a), mean number of neurologist visits per patient per year (b), proportion of patients with ⩾1 specialist visit (c), and mean number of specialist visits per patient per year (d).
Discussion
This study showed that, for the majority of patients with MG, clinical burden in terms of serious exacerbations and crisis is the highest in the first year after diagnosis. While overall this declined over time, however, a proportion of patients continued to experience exacerbations frequently beyond the first 1–2 years after diagnosis. Previous studies have suggested that myasthenic crises are typically experienced within the first 2 years of disease onset, as it takes time before patients initiate and respond to assigned treatment. Also, for some patients with MG, time to diagnosis is long, and serious exacerbations or crisis can be the first clear manifestations of the disease that lead to the diagnosis.12–14 Consequently, during this period, there is also a higher need for rescue treatment with recommended acute therapies IVIg and PLEX, and this study shows that the pattern of use of IVIg and PLEX closely follows the pattern of serious MG exacerbation.
Given the high clinical burden observed during the first year after disease onset, it is not surprising that the rates of hospitalizations, ICU admissions, and ER visits were also significantly higher during this period than later in the course of the disease. Despite a declining trend in ER visits, hospitalizations, and ICU admissions, the risk for each of the HCRU events was still significantly higher than in sex- and age-matched controls. The majority of HCRU events for patients with MG were MG-related. Engel-Nitz et al. 9 reported a 3-fold higher adjusted risk of ER visits and 4.4-fold higher adjusted risk of hospitalizations in patients with refractory MG compared with age- and sex-matched controls in their study based on a claims database. The risk reported by Engel-Nitz et al. is higher than the unadjusted findings of 2.2-fold and 3.5-fold increases for ER visits and hospitalizations from this study, respectively, but this could be due to their study being limited to patients with refractory disease, who were likely to have more severe disease.
In this study, 23% of patients had early onset MG, and this proportion is generally in line with the available data in the literature. Although incidence of early versus late onset MG is not well studied, a nationwide cohort study from Denmark in 2014 classified 30% of patients with MG as having early onset MG, 15 while a cross-sectional study of Spanish hospitals from 2020 also found a third of patients to have early onset MG. 16
Patients in this study suffered from many additional comorbidities, and these were more frequent in patients with MG compared with age- and sex-matched controls, both prior to disease onset and following MG diagnosis. This is reflected in the higher need for treatment from non-neurology specialists.
We have previously shown that 90% of patients in this cohort were treated, 68% with CSs and 33% with NSISTs. 17 Chronic use of high-dose steroids, which is often part of the treatment paradigm for patients with MG, is associated with increased risk for long-term adverse events18,19 and a significant impact on quality of life in patients with MG. 20 Similarly, in addition to steroids, NSIST therapy leads to general immunosuppression with increased susceptibility to infections, and in this study, the risk of infection-related hospitalization was 3.5 times higher among patients with MG compared with controls. NSIST use is also associated with an increased risk of malignancy. 21 While this study did not assess cancer as a comorbidity, future analyses with a longer time frame to assess risk of cancer in MG patients with long-term use of NSIST may be beneficial. The study has some limitations. First, the data sets were from the IBM® MarketScan® Commercial Claims and Encounters and Medicare supplemental database, and thus were limited entirely to those individuals with private medical insurance, excluding direct Medicare patients not included in the supplemental and patients who did not have commercial insurance. Consequently, the results of this analysis may not be generalizable to patients with MG who have other insurance or are without health insurance coverage, and equally, medical history prior to membership of an insurance plan will be missing. Almost all Medicare claims should, in fact, require a copayment, however, which would require the case to be passed to the Medical supplemental, so we expect our sample covers the vast majority of claims. Although patients were required to have at least 12 months’ baseline enrollment data, it is still possible that some patients were diagnosed prior to entering the MarketScan® database. Second, symptoms of MG can resemble symptoms of other neuromuscular diseases, and there may also be heterogeneity of diagnostic criteria among clinicians, meaning there was potential for misdiagnosis or misclassification. In order to mitigate this, at least two diagnoses were required for inclusion in the study and 90% of patients received treatment for MG, so misclassification was likely to be minimal. Furthermore, the definition of exacerbation applied was conservative, requiring patients to be hospitalized or receive treatment with Ig or PLEX (i.e. serious exacerbations), and consequently excluded exacerbations that are handled by an increase in dose or change of treatment. Another potential limitation is the length of the washout period. To ensure that only incident patients were included, a washout period of at least 12 months prior to the index date was applied. Patients with stable MG, however, may not seek healthcare for a period that could be a year or longer. Therefore, it is possible that some patients included in this study may not be newly developed MG but could represent patients with previously diagnosed disease. It is also possible that use of inpatient-dispensed drugs, such as Ig, was not fully reported due to the use of diagnostic-related group payment systems, and thus, some patient records could have been incomplete. As these claims, however, are associated with a reimbursement, we would expect only a small proportion of incomplete records. Furthermore, while this study did not stratify by treatment, patients were followed from diagnosis of MG, and so the majority of patients in this cohort were receiving conventional first- or second-line treatments (AChEIs, steroids, or NSISTs) throughout the follow-up period. Since the start of our observation period in 2010, the MG treatment landscape has progressed considerably. 22 Only around 2% of patients in our cohort received eculizumab or rituximab at some stage during the follow-up period, 17 so our data may not necessarily reflect outcomes after treatment with these or other recently approved therapies such as ravulizumab or efgartigimod. 23 Rituximab is recommended for use in MG patients with anti—muscle-specific kinase (MuSK+) antibodies, 23 in which treatment with complement inhibitors is not suitable due to the IgG4-mediated nature of MuSK+ disease.24,25 Our analysis did not capture antibody status, and so could not identify whether those patients treated with rituximab had MuSK+ disease. In addition, we cannot account for uncommonly prescribed treatment regimens that may have been prescribed by non-MG experts. Finally, while there was a substantial range of follow-up times extending from 0 to 9.9 years, median follow-up time was 2.3 years, and 5 years of follow-up were not available for more than half the cohort, for a number of reasons including discontinuation of continuous medical and pharmacy benefits enrollment, end of database coverage period, or death. Thus, the long-term rates of HCRU could be over- or under-estimated depending on whether these patients have more severe or less severe disease than the patients with shorter follow-up time.
This analysis encourages some further routes of investigation that could further boost the understanding of HCRU and outcomes of patients with MG. For example, a supplementary subanalysis controlling for comorbidities, to determine the incremental HCRU of patients with MG and a comorbid status similar to non-MG controls, may be performed. In addition, MG-specific hospital admissions could be assessed by index discharge diagnosis to assess the split of MG exacerbations or myasthenic crises. Furthermore, future claims analyses could aim to capture differences in HCRU by type of treatment center, such as an academic center versus a private practice setting. 26
Overall, the findings from this claims database analysis confirm that a proportion of patients with MG in the United States have uncontrolled disease. Despite chronic treatment, many patients continued to experience serious exacerbations or myasthenic crises, required rescue treatment cycles of Ig or PLEX, and in some cases, hospitalization. These data highlight that some people with MG need alternative treatment options that combine a rapid onset of action with long-term, consistent disease control. New treatments that target the underlying pathophysiology of MG have the potential to improve disease control and reduce both disease and treatment burden. 27
Supplemental Material
sj-docx-1-tan-10.1177_17562864221150327 – Supplemental material for Healthcare resource use in myasthenia gravis: a US health claims analysis
Supplemental material, sj-docx-1-tan-10.1177_17562864221150327 for Healthcare resource use in myasthenia gravis: a US health claims analysis by Milada Mahic, Ali Bozorg, Jan Rudnik, Piotr Zaremba and Anna Scowcroft in Therapeutic Advances in Neurological Disorders
Footnotes
Acknowledgements
This research was funded by UCB Pharma. Medical writing support was provided by Niall Harrison and Rachel Price of Ogilvy Health UK, and funded by UCB Pharma, in accordance with Good Publication Practice (GPP3) guidelines (![]() ). The authors thank Veronica Porkess, PhD, of UCB Pharma for publication and editorial support.
). The authors thank Veronica Porkess, PhD, of UCB Pharma for publication and editorial support.
Declarations
Supplemental material
Supplemental material for this article is available online.
References
Supplementary Material
Please find the following supplemental material available below.
For Open Access articles published under a Creative Commons License, all supplemental material carries the same license as the article it is associated with.
For non-Open Access articles published, all supplemental material carries a non-exclusive license, and permission requests for re-use of supplemental material or any part of supplemental material shall be sent directly to the copyright owner as specified in the copyright notice associated with the article.